Swing Failure Pattern

The Swing Failure Pattern indicator is an exceptional tool designed to highlight Swing Failure Patterns (SFP) on your trading chart. This unique pattern emerges when significant market participants drive liquidity, making it a potential signal for trend reversals.

How to Use the Swing Failure Pattern Indicator?

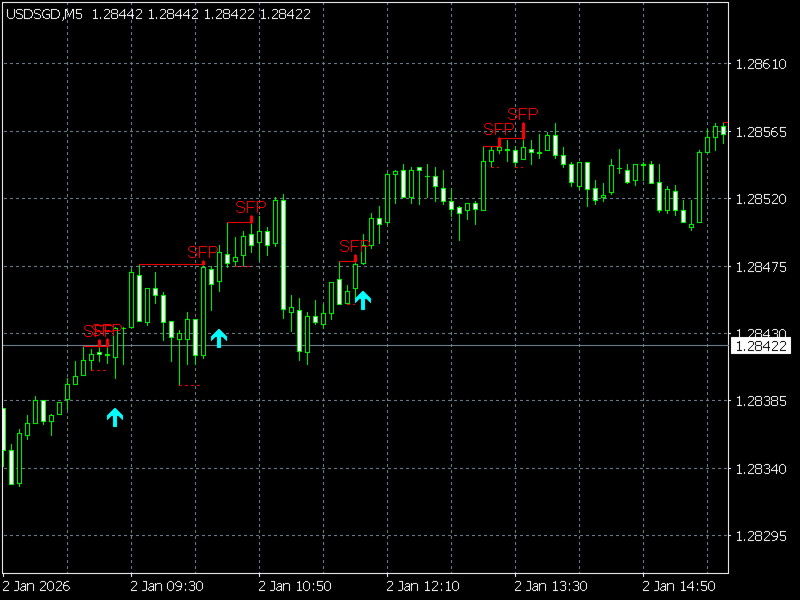
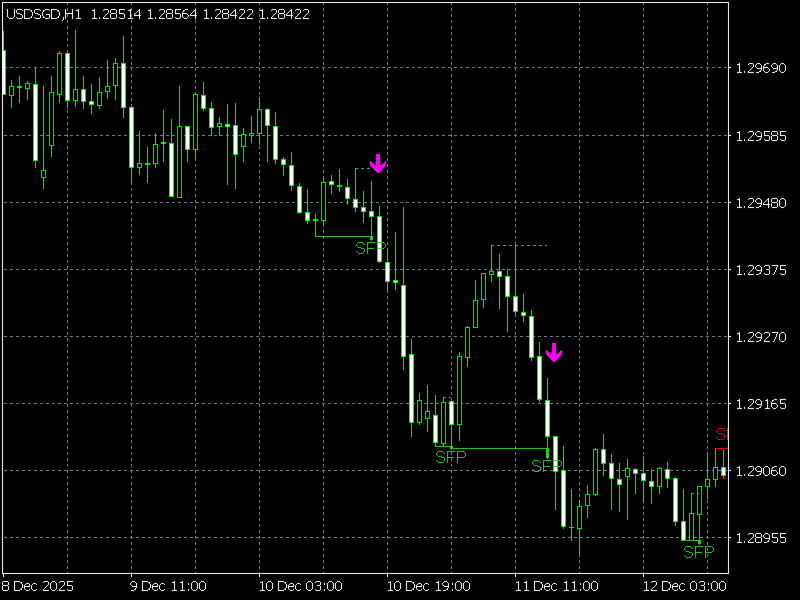
Swing Failure Patterns occur when a candle wick breaks above or below a recent swing level, only to close back within the previous level. This phenomenon often takes place due to significant market players who engineer liquidity to entice other traders. Spotting SFPs can help traders identify potential shifts in market trends.

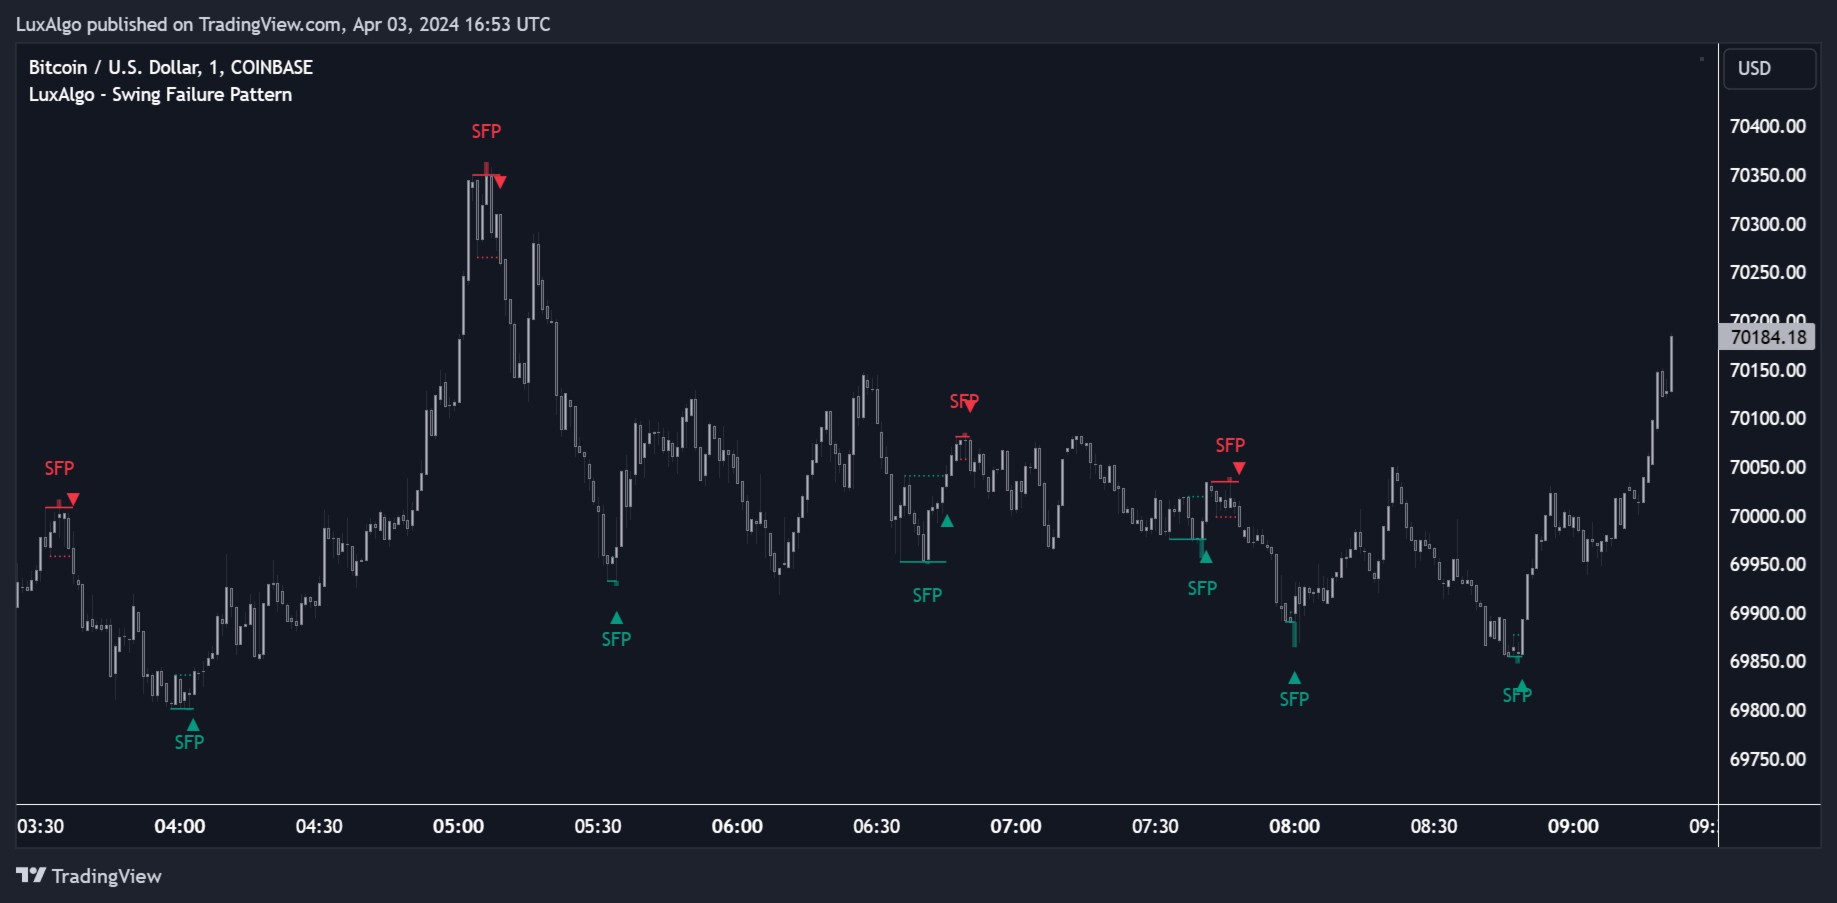
In the chart, SFPs are highlighted using labels and accentuated wick lines, which traders can disable if they wish.

Increasing the "Swings" period won't change the SFP but may reduce the frequency of their detection.

추천 제품
Overview Harmonic Patterns MT4 is a technical analysis indicator designed for the MetaTrader 5 platform. It identifies and displays harmonic price patterns, such as Butterfly, Cypher, Crab, Bat, Shark, and Gartley, in both bullish and bearish directions. The indicator calculates key price levels, including entry, stop loss, and three take-profit levels, to assist traders in analyzing market movements. Visual elements and customizable alerts enhance usability on the chart. Features Detects six ha
Monster Harmonic Indicator
Paul Geirnaerdt
4.59 (29)
Monster Harmonics Indicator is a harmonic pattern indicator. It recognizes Gartley, Bat, Crab, Butterfly, Cypher, White Swan, Black Swan, Shark and several other patterns. Projected patterns that are not yet completed are recognized, too. Monster even shows the PRZ (Potential Reversal Zone). Users can add their own user defined patterns to Monster. Besides the current pattern, Monster also shows all patterns in the symbols history. Monster will provide alerts for developing patterns. Introduced
Reversal Pattern Pro
Boonyapagorn Rodvattanajinda
Reversal Patterns Pro Reversal Patterns Pro is a Price Action (PA) analytical tool that scans the reversal patterns.  - Finds and marks the most dependable Japanese candlestick patterns in real-time. - Supports all time frames (Best for Scalping) - Doesn't repaint making it an exceptional indicator for Expert Advisors. Input parameters : - Support & Resistance Mode ( true or false ) for enabling advanced filtering - Donchian Period - RSI Period - RSI Oversold Level - RSI Overbought Level - Al
All Symbols   AND  All Time frames Scan                                                                                                                 Document Introduction   The ABCD is a basic harmonic pattern. The ABCD pattern is a visual, geometric chart pattern comprised of three consecutive price swings. It looks like a diagonal lightning bolt and can indicate an upcoming trading opportu
Auto Levels
Yaroslav Varankin
Auto Level this tool is able to determine the levels of support and resistance. search and display when the price has broken through the level and when it pushed off from it. the indicator can be useful if you use resistance support levels in your trading. or the highs and lows of the price, then it will greatly simplify your work and help you more quickly and more accurately determine the rebound or breakdown of the current trend or tendencies level. blue line bottom uptrend red line on top dow
Introduction to X3 Chart Pattern Scanner X3 Cherart Pattern Scanner is the non-repainting and non-lagging indicator detecting X3 chart patterns including Harmonic pattern, Elliott Wave pattern, X3 patterns, and Japanese Candlestick patterns. Historical patterns match with signal patterns. Hence, you can readily develop the solid trading strategy in your chart. More importantly, this superb pattern scanner can detect the optimal pattern of its kind. In addition, you can switch on and off individu
PZ Harmonacci Patterns
PZ TRADING SLU
3.17 (6)
Trade smarter, not harder: Empower your trading with Harmonacci Patterns This is arguably the most complete harmonic price formation auto-recognition indicator you can find for the MetaTrader Platform. It detects 19 different patterns, takes fibonacci projections as seriously as you do, displays the Potential Reversal Zone (PRZ) and finds suitable stop-loss and take-profit levels. [ Installation Guide | Update Guide | Troubleshooting | FAQ | All Products  ] It detects 19 different harmonic pric
Overview  Market Structure Analysis Indicator MT4 Structure Analysis Indicator   automatically identifies Market Structure based on Smart Money Concepts (SMC). It clearly displays Break of Structure (BoS), Change of Character (CHoCH), Higher Highs, Higher Lows, Lower Highs, and Lower Lows in real-time. Key Features Automatic Market Structure Detection   Break of Structure (BoS)   - Price breaks previous structure in trend direction   Change of Character (CHoCH)   - Trend reversal sig
Elliott Wave Trend MT4
Young Ho Seo
4 (7)
Elliott Wave Trend was designed for the scientific wave counting. This tool focuses to get rid of the vagueness of the classic Elliott Wave Counting using the guideline from the template and pattern approach. In doing so, firstly Elliott Wave Trend offers the template for your wave counting. Secondly, it offers Wave Structural Score to assist to identify accurate wave formation. It offers both impulse wave Structural Score and corrective wave Structure Score. Structural Score is the rating to sh
RTrends
Nikolay Likhovid
The RTrends indicator does two things: first, it automatically draws the layout of the price chart by plotting trend lines and, secondly, it produces bearish and bullish signals. The layout reflects the fractal nature of the market. Trends from different time horizons are applied simultaneously on the chart. Thus, from a single chart a trader can see trend lines of higher timeframes. The lines, depending on the horizon, differ in color and width: the older the horizon, the thicker the line is. T
The indicator displays Renko bars on the chart, uses them to plot the ZigZag - trend lines connecting the local Lows and Highs of the price movement, and highlights them based on the Gartley patterns, showing the potential price reversal points. Renko - specialized display of the price action, in which the graph is displayed not every bar of the time frame, but only under the condition that the price had passed more than the specified number of points. Renko bars are not bound to a time frame, s
The Supply and Demand Zones indicator is one of the best tools we have ever made. This great tool automatically draws supply and demand zones, the best places for opening and closing positions. It has many advanced features such as multi timeframe zones support, displaying the width of zones, alert notifications for retouched zones, and much more. Because of market fractality, this indicator can be used for any kind of trading. Whether you are a positional, swing, or intraday trader does not ma
CyberZingFx Trend Reversal
Afsal Meerankutty
4.18 (17)
NEW YEAR SPECIAL DISCOUNT RUNNING NOW 40% DISCOUNT Price slashed from $149 to $89 until 3rd Jan 2025 Indicator captures the trend reversals with no-repaint Buy and Sell Arrow signals. CyberZingFx Trend Reversal Indicator - your go-to solution for accurate and reliable trend reversal signals. With its  advanced trading strategy , the indicator offers you Buy and Sell Arrow signals that do not repaint, making it a reliable tool for catching Swing Highs and Swing Lows in any market and any time fr
Point Of Interest
Scott Edward Merritt
What is a Point of Interest? Traders who follow Smart Money Concepts may call this a Liquidity Point, or where areas of liquidity have been built up by retail traders for for Big Banks to target to create large price movements in the market. As we all know, retail traders that use outdated and unreliable methods of trading like using trendlines, support and resistance, RSI, MACD, and many others to place trades and put their stop losses at keys points in the market. The "Big Banks" know these me
Korean 코드의 장점 설명 (코드 언급 없음) 1. 정밀한 시장 상태 구분 (3차원) 단순한 상승/하락뿐만 아니라 '횡보(Sideways)' 구간을 분리해 줍니다. 매수 우위 (Bullish) 매도 우위 (Bearish) 핵심: 시장의 방향성이 없는 구간을 파악하여 진입 실수를 줄입니다. 2. 오실레이터 강도 측정 (0-100) 과열 구간: 과매수/과매도 구간(예: 80 이상, 20 이하)을 표시합니다. 영역 채우기: 피크 구간에 색상을 입혀 직관적으로 보여줍니다. 3. 노이즈 필터링의 유연성 (스무딩) 거짓 신호 감소: 다양한 이동평균 방식(RMA, EMA 등)을 통해 차트의 노이즈를 제거합니다. 거래량 가중치: **거래량(Volume)**을 계산에 포함시켜 신뢰도를 높일 수 있습니다. 4. 명확한 시각적 신호 교차 화살표: 추세가 전환될 때 화살표로 진입 시점을 알려줍니다. 화면 설정: 차트를 깔끔하게 유지하기 위해 선이나 색상을 켜고 끌 수 있습니다. 5. 성능 및 안정성
CyberZingFx Volume Plus
Afsal Meerankutty
4.94 (17)
Advanced version of CyberZingFx Volume Plus, the ultimate MT4 indicator for traders seeking highly accurate buy and sell signals. With an additional strategy and price action dot signals that enhances its effectiveness, this indicator offers a superior trading experience for professionals and beginners alike. The CyberZingFx Volume Plus Advanced version combines the power of volume analysis and historical price data with an additional strategy, resulting in even more precise and reliable signals
The Master Figures indicator analyzed the market for the most common chart patterns. The first pattern is called Pin bar . This pattern can rightly be considered one of the most widespread. This pattern looks like a candle with a small body and large tail (wick). Once you see it on the chart, open a position against the wick. It is better to use the resistance lines for closing. Master Figures shows this pattern in the form of circles. A position should be opened when a new candle appears after
Chart Patterns Detect 15 patterns (Ascending Triangle, Descending Triangle, Rising Wedge, Falling Wedge, Bullish Flag, Bearish Flag, Bullish Rectangle, Bearish Rectangle Symmetrical triangle, Head and Shoulders, Inverted Head and Shoulders, Triple top, Triple Bottom, Double Top, Double Bottom) Use historical data to calculate the probability of each pattern to succeed (possibility to filter notification according to the chance of success) gives graphic indication about the invalidation level and
The   Fibonacci Confluence Toolkit   is a technical analysis tool designed to help traders identify potential price reversal zones by combining key market signals and patterns. It highlights areas of interest where significant price action or reactions are anticipated, automatically applies Fibonacci retracement levels to outline potential pullback zones, and detects engulfing candle patterns. Its unique strength lies in its reliance solely on price patterns, eliminating the need for user-define
This indicator finds technical analysis reversal patterns such as Double Bottom, Triple Bottom, Head & Shoulders and their opposite counterparts. The indicator shows them on the chart of a currency pair and can signal a trader if a pattern has been formed recently. This allows you to quickly detect a possible trend reversal or correction, it is enough to add an indicator to the chart, after that, you can change different timeframes to quickly find such patterns, if the patterns are not located
Easy RSI divergences
Carlos Mendez Sanchez
Easy RSI Divergences – Unlock Professional-Level Divergence Trading Easy RSI Divergences is a cutting-edge indicator for MetaTrader 4, crafted for traders who want to gain a competitive edge by accurately identifying RSI (Relative Strength Index) divergences in real time. Whether you are a beginner or a professional, this tool transforms complex market signals into clear, actionable insights. The indicator automatically detects both classic divergences (indicating potential trend reversals) a
Gartley Projection D
Oleksandr Medviediev
3.71 (7)
The indicator identifies the harmonic patterns (XABCD) according to developments of H.M.Gartley ( "Profits in the Stock Market" , 1935г). It projects D-point as a point in the perspective projection (specify ProjectionD_Mode = true in the settings). Does not redraw. When a bar of the working timeframe closes, if the identified pattern point has not moved during Patterns_Fractal_Bars bars, an arrow appears on the chart (in the direction of the expected price movement). From this moment on, the ar
Alpha Trend sign has been a very popular trading tool in our company for a long time. It can verify our trading system and clearly indicate trading signals, and the signals will not drift. Main functions: Based on the market display of active areas, indicators can be used to intuitively determine whether the current market trend belongs to a trend market or a volatile market. And enter the market according to the indicator arrows, with green arrows indicating buy and red arrows indicating se
This is a new strategy for SUPPLY DEMAND areas It is based on a calculation using the tick volume to detect the big price action in market for both bear /bull actions this smart volume action candles are used to determine the supply and demand areas prices in between main supply and demand lines indicate sideway market  up arrows will be shown when prices moves above the main supply and the secondary supply lines Down arrows will be shown when prices moves below the main demand and the secondary
Fractal Support/Resistance Clusters is an indicator that draws support and resistance lines based on fractals whose sources have not yet been broken and are therefore still relevant. A fractal is relevant as an indicator of support or resistance when the price of its previous opposing fractal has not been broken. Clusters of support and resistance zones are derived using the density-based spatial clustering of applications with noise (DBSCAN) algorithm and can be drawn on the screen. These clust
El indicador "MR BEAST ALERTAS DE LIQUIDEZ" es una herramienta avanzada diseñada para proporcionar señales y alertas sobre la liquidez del mercado basándose en una serie de indicadores técnicos y análisis de tendencias. Ideal para traders que buscan oportunidades de trading en función de la dinámica de precios y los niveles de volatilidad, este indicador ofrece una visualización clara y detallada en la ventana del gráfico de MetaTrader. Características Principales: Canal ATR Adaptativo: Calcula
Candlestick Patterns Analytics is a powerful tool for analyzing candlestick patterns. Do you trade based on candlestick patterns? Then Candlestick Patterns Analytics is designed for you. The undeniable advantage of the indicator: Predicts trading result when trading candlestick patterns; Uses statistical data based on the history of the selected symbol and timeframe. What the indicator does Finds and marks on the chart 29 candlestick patterns; Draws arrows to indicate the classical and statist
MT4용 Crypto_Forex 지표 "Morning Star and Evening Star pattern", 리페인트 및 지연 없음. - "Morning Star and Evening Star pattern" 지표는 가격 변동 거래에 매우 강력한 지표입니다. - 이 지표는 차트에서 Morning Star와 Evening Star 패턴을 감지합니다. - 상승 모닝 스타 패턴 - 차트에 파란색 화살표 신호(그림 참조). - 하락 모닝 스타 패턴 - 차트에 빨간색 화살표 신호(그림 참조). - PC, 모바일 및 이메일 알림 기능 제공. - "Morning Star and Evening Star pattern" 지표는 지지/저항선과 함께 사용하기에 매우 좋습니다. 여기를 클릭하여 고품질 트레이딩 로봇과 지표를 확인하세요! 이 제품은 MQL5 웹사이트에서만 제공되는 오리지널 상품입니다.
MT4용 Crypto_Forex 지표 "행잉 맨 패턴", 리페인트 없음, 지연 없음. - "행잉 맨 패턴" 지표는 가격 변동 거래에 매우 강력한 지표입니다. - 이 지표는 차트에서 하락세 행잉 맨 패턴을 감지합니다. 차트에 빨간색 화살표 신호가 나타납니다(그림 참조). - PC, 모바일 및 이메일 알림 기능을 제공합니다. - "행잉 맨 패턴" 지표는 지지/저항선과 함께 사용하기에 매우 좋습니다. ............................................................................. Click here to see high quality Trading Robots and Indicators! 본 제품은 MQL5 웹사이트에서만 제공되는 오리지널 상품입니다.
Индикатор Price Bars and Chart Patterns основан на трех баровых паттернах:  Double Key Reversal Bar Popgun Multiple Inside Bar Индикатор  Price Bars and Chart Patterns  выставляет значки на покупку - зеленый цвет, и на продажу - красный цвет. Значки выставляются согласно сформированным баровым моделям после их подтверждения. Индикатор  Price Bars and Chart Patterns  работает на всех тайм-фреймах.Входные параметры отсутствуют. Индикатор  Price Bars and Chart Patterns  самостоятельно проделывает р
이 제품의 구매자들이 또한 구매함
Neuro Poseidon MT4
Daria Rezueva
4.84 (43)
Neuro Poseidon is a new indicator by Daria Rezueva. It combines precise trading signals with adaptive TP/SL levels - creating best possible trades as a result! Message me and get  Neuro Poseidon Assistant  as a gift to automize your trading process! What makes it stand out? 1. Proven profitability on all assets and timeframes 2. Only confirmed BUY and SELL signals present on the chart 3. Adaptive TP & SL levels generated by the software for each trade 4. Easy to understand - suitable for all
Gann Made Easy
Oleg Rodin
4.84 (167)
Gann Made Easy 는 mr.의 이론을 사용하여 최고의 거래 원칙을 기반으로 하는 전문적이고 사용하기 쉬운 Forex 거래 시스템입니다. W.D. 간. 이 표시기는 Stop Loss 및 Take Profit Levels를 포함하여 정확한 BUY 및 SELL 신호를 제공합니다. PUSH 알림을 사용하여 이동 중에도 거래할 수 있습니다. 구매 후 거래 방법 안내 및 유용한 추가 지표를 무료로 받으시려면 저에게 연락주세요! 아마도 Gann 거래 방법에 대해 이미 여러 번 들었을 것입니다. 일반적으로 Gann의 이론은 초보자 거래자뿐만 아니라 이미 거래 경험이 있는 사람들에게도 매우 복잡한 것입니다. Gann의 거래 방식은 이론적으로 적용하기 쉽지 않기 때문입니다. 나는 그 지식을 연마하고 Forex 지표에 최고의 원칙을 적용하기 위해 몇 년을 보냈습니다. 표시기는 적용하기가 매우 쉽습니다. 차트에 첨부하고 간단한 거래 권장 사항을 따르기만 하면 됩니다. 지표는 지속적으로 시장 분석
Prop Firm Sniper
Mohamed Hassan
5 (1)
Prop Firm Sniper MT4  is a professional market structure indicator that automatically identifies high-probability BUY and SELL opportunities using BOS and CHoCH analysis. Recommended Timeframes: For backtesting, use the indicator on   M5 or M15   for Gold (XAUUSD), and   M15 or H1   for more volatile Forex pairs such as   GBPUSD, USDJPY, EURGBP , and similar markets. CONTACT ME AFTER PURCHASE TO CLAIM YOUR FREE BONUSES! Prop Firm Sniper  is a professional market structure indicator designed t
Neo Wave PRO
Nikolay Raykov
5 (1)
Price & Time Market Structure Indicator A professional market structure tool that analyzes waves through both price and time — not price alone. Main Description NeoWave PRO is a professional market structure indicator for MetaTrader 4 designed for traders who want to move beyond traditional one-dimensional wave tools such as ZigZag, swing indicators, and basic high/low systems. Most wave indicators analyze only one thing: Price. But a real market wave is not only a price movement. A true wave de
이 제품은 2026년 시장에 맞게 업데이트되었으며 최신 MT5 빌드에 최적화되었습니다. 가격 업데이트 안내: Smart Trend Trading System은 현재 $99 에 제공됩니다. 다음 30회 구매 후 가격은 $199 로 인상됩니다. 특별 혜택: Smart Trend Trading System 구매 후 저에게 개인 메시지를 보내시면 Smart Universal EA를 무료 로 받을 수 있으며, Smart Trend 신호를 자동 거래로 전환할 수 있습니다. Smart Trend Trading System은 리페인트 없음, 재그리기 없음, 지연 없음의 완전한 트레이딩 시스템으로, 더 깨끗한 신호, 더 나은 추세 방향, 그리고 더 체계적인 시장 거래 방식을 원하는 트레이더를 위해 제작되었습니다. Online course , manual and [download presets] . 이 시스템은 추세 감지, 반전 구간, Smart Cloud, 트레일링 스톱 로직, 지지와 저항, 캔들
Miraculous Indicator – Gann Square of Nine 기반 100% 비리페인트 Forex 및 바이너리 도구 이 영상은 Miraculous Indicator 를 소개합니다. 이 지표는 Forex 및 바이너리 옵션 트레이더를 위해 특별히 개발된 매우 정확하고 강력한 트레이딩 도구입니다. 이 지표가 독특한 이유는 전설적인 **Gann Square of Nine(Gann 9의 사각형)**과 **Gann's Law of Vibration(Gann 진동의 법칙)**에 기반을 두고 있기 때문입니다. 이는 현대 트레이딩에서 가장 정밀한 예측 도구 중 하나로 손꼽힙니다. Miraculous Indicator는 완전히 비리페인트(non-repaint) 됩니다. 즉, 캔들이 마감된 후에도 신호가 변경되거나 사라지지 않습니다. 보이는 것이 곧 결과입니다. 이는 트레이더가 자신감을 가지고 거래에 진입하고 청산할 수 있는 신뢰할 수 있고 일관된 기반을 제공합니다. 주요 특징: Gann
System Trend Pro
Aleksandr Makarov
5 (3)
System Trend Pro - This is the best trend trading indicator!!! The indicator no repaint!!!  The indicator has   MTF   mode, which adds confidence to trading on the trend (   no repaint   ). How to trade? Everything is very simple, we wait for the first signal (big arrow), then wait for the second signal (small arrow) and enter the market in the direction of the arrow. (See screens 1 and 2.) Exit on the opposite signal or take 20-30 pips, close half of it, and keep the rest until the opposite
Advanced Supply Demand
Bernhard Schweigert
4.91 (301)
현재 30% 할인! 초보자나 전문 트레이더를 위한 최고의 솔루션! 이 보조지표는 우리가 다수의 독창적 기능과 새로운 공식을 통합한 독특하고 고품질이며 저렴한 거래 도구입니다. 이 업데이트를 통해 이중 시간대를 표시할 수 있습니다. 더 높은 TF를 표시할 수 있을 뿐만 아니라 차트 TF와 더 높은 TF 모두를 표시할 수 있습니다: 중첩 영역 표시. 모든 Supply Demand 트레이더들이 좋아할 것입니다. :) 중요한 정보 공개 Advanced Supply Demand의 잠재력을 극대화하려면 다음을 방문하십시오. https://www.mql5.com/ko/blogs/post/720245   진입 또는 목표의 명확한 트리거 포인트를 정확히 찾아냄으로 해서 거래가 어떻게 개선될지 상상해 보십시오. 새로운 알고리즘을 기반으로 매수자와 매도자 간의 잠재적인 불균형을 훨씬 더 쉽게 분간할 수 있습니다. 왜냐하면 가장 강한 공급영역과 가장 강한 수요 영역과 과거에 어떻게 진행 되었는지를(이전
M1 Sniper
Oleg Rodin
5 (24)
M1 SNIPER 는 사용하기 쉬운 거래 지표 시스템입니다. M1 시간대에 맞춰 설계된 화살표 지표입니다. 이 지표는 M1 시간대 스캘핑을 위한 단독 시스템으로 사용할 수 있으며, 기존 거래 시스템의 일부로도 사용할 수 있습니다. 이 거래 시스템은 M1 시간대 거래용으로 특별히 설계되었지만, 다른 시간대에도 사용할 수 있습니다. 원래는 XAUUSD와 BTCUSD 거래를 위해 이 방법을 설계했지만, 다른 시장 거래에도 유용하다는 것을 알게 되었습니다. 이 지표의 신호는 추세 방향과 반대로 거래될 수 있습니다. 저는 지표의 신호를 활용하여 양방향으로 거래할 수 있도록 돕는 특별한 거래 기법을 알려드립니다. 이 방법은 특별한 동적 지지선과 저항선 가격 영역을 활용하는 것을 기반으로 합니다. 구매하시면 M1 SNIPER 화살표 지표를 바로 다운로드하실 수 있습니다. 또한, 아래 스크린샷에 표시된 Apollo Dynamic SR 지표는 M1 SNIPER 도구를 사용하는 모든 사용자에게 무료로
Owl smart levels
Sergey Ermolov
4.26 (38)
추세를 따라 거래할 때 가장 어려운 점은 레벨을 찾는 것이 아니라, 어디에서 진입이 실제로 유효한지를 이해하는 것입니다. 가격은 종종 레벨에 반응하지만 움직임이 이어지지 않는 경우가 많으며, 이는 잘못된 진입이나 기회 상실로 이어집니다. Owl Smart Levels는 단순히 레벨만 표시하는 것이 아니라 , 시장 구조와 되돌림을 기반으로 형성된 구간을 보여줍니다. 이를 통해 진입 포인트를 다르게 평가할 수 있으며 일부 잘못된 신호를 피할 수 있습니다. Owl Smart Levels 시스템 구성 Owl Smart Levels 는 단순한 레벨 표시가 아니라, 각 요소가 서로 보완하는 완전한 트레이딩 모델 입니다. 구성 요소: Owl Smart Levels (지표) 추세 방향, 되돌림 구간, 그리고 사전에 정의된 진입, StopLoss, TakeProfit 레벨을 표시 시스템 가이드 실제 거래에서 신호를 어떻게 활용할지 설명: 어떤 상황을 고려하고 어떤 상황을 건너뛸지, 그리고 거래
PZ Trend Trading
PZ TRADING SLU
4.8 (5)
Capture every opportunity: your go-to indicator for profitable trend trading Trend Trading is an indicator designed to profit as much as possible from trends taking place in the market, by timing pullbacks and breakouts. It finds trading opportunities by analyzing what the price is doing during established trends. [ Installation Guide | Update Guide | Troubleshooting | FAQ | All Products ] Trade financial markets with confidence and efficiency Profit from established trends without getting whips
ORB Seeker
Marcela Goncalves De Oliveira
특별 출시 가격! 단돈 79달러! 10개 판매 후 가격이 인상되어 최종 가격은 199달러가 됩니다. 구매 후 연락 주시면 완전 자동화되고 최적화된 설정 파일을 사용하여 돌파 신호를 거래할 수 있는 무료 보너스 EA를 드립니다. 깔끔한 세션 브레이크아웃을 자신감 있게 활용하세요! ORB Seeker는 정확성, 단순성, 유연성 및 명확한 차트 구조를 원하는 트레이더를 위해 개발된 전문적인 시가 범위 돌파(ORB) 지표입니다. 이 프로그램은 모든 금융 상품에 대해 장전 거래 또는 사용자 지정 세션 범위를 자동으로 표시하고, 진입, 손절매, 목표 수익 및 선택적으로 50% 부분 목표 수익 수준을 포함한 명확한 돌파 신호를 제공합니다. 모든 계산은 실시간으로 차트에 직접 표시됩니다. 런던 개장, 뉴욕 세션, 아시아 세션 또는 사용자 지정 시장 시간대를 선택하여 거래하세요. ORB Seeker는 사용자가 선택한 세션 시간에 맞춰 작동하므로 시장 범위, 돌파 수준 및 거래 레벨을 정확하게 확
PRO Renko System
Oleg Rodin
5 (31)
PRO Renko System 은 RENKO 차트 거래를 위해 특별히 고안된 매우 정확한 거래 시스템입니다. 이것은 다양한 거래 상품에 적용될 수있는 보편적 인 시스템입니다. 체계는 효과적으로 당신에게 정확한 반전 신호에 접근을 주는 소위 시장 소음을 중화합니다. 이 표시기는 사용하기가 매우 쉽고 신호 생성을 담당하는 매개 변수가 하나만 있습니다. 당신은 쉽게 당신의 선택의 어떤 무역 계기에 공구를 적응시킬 수 있고 renko 막대기의 크기. 나는 항상 당신이 내 소프트웨어로 수익성있게 거래 할 수 있도록 추가 지원을 제공 할 준비가되어 있습니다! 나는 당신에게 행복하고 수익성있는 거래를 기원합니다! 구매 후 저에게 연락하십시오! 내 렌코 차트 생성기를 보내드립니다. 또한 내 개인 권장 사항 및 시스템의 다른 모듈을 무료로 공유 할 것입니다!
Scientific trade
Aleksey Ivanov
5 (1)
An extremely convenient indicator that truly makes the process of making money on the exchange easy. It is based on the scientifically rigorous theory of the market developed by the author, the beginning of which is presented here .                The full algorithm of this indicator operation is presented in the article .               The indicator calculates the most probable price movement trajectory and displays it on the chart. Based on the predicted price movement trajectory
M1 Quantum
Hamed Dehgani
M1 Quantum을 이용한 실시간 트레이딩 신호 : 신호 개발자 안내:   구매 후 저에게 연락하시면 최신   추천 설정 파일(Set File) , 거래 팁, 그리고   VIP 지원 그룹 초대를 받으실 수 있습니다. 여기에서 다른 M1 Quantum 사용자들과 소통할 수 있습니다. MT5 버전 사용 가능 : MT5 방문 M1 Quantum 은 M1 전용 전문 트레이딩 시스템으로, 손절(Stop Loss), 익절(Take Profit), 그리고 스마트 자금 관리 기능이 내장된 빠르고 정확한 거래 신호를 제공합니다. M1 Quantum 은 연속 수익 거래 에 집중하여 계좌를 빠르게 성장시키도록 설계된 전문 자금 관리 시스템을 포함하고 있습니다. M1 Quantum 인디케이터 의 주요 기능 M1 타임프레임 및 모든 주요 통화쌍 용으로 설계됨 모든 거래에 손절과 익절 적용 자금 관리 시스템 이 포함되어 트레이더가 쉽게 거래할 수 있도록 안내 높은 승률 및 높은 연속 수익률 리페인트 없음
Smart Price Action Concepts
Issam Kassas
4.77 (13)
이 제품은 2026년 시장에 맞게 업데이트되었으며 최신 MT5 빌드에 최적화되었습니다. 가격 업데이트 안내: Smart Price Action Concepts는 현재 $200 에 제공됩니다. 다음 30회 구매 후 가격은 $299 로 인상됩니다. 특별 혜택: 구매 후 저에게 개인 메시지를 보내시면 무료 보너스 + 선물 을 받을 수 있습니다. 먼저, 이 트레이딩 도구는 리페인트 없음, 재그리기 없음, 지연 없음의 인디케이터이므로 전문적인 트레이딩에 적합하다는 점을 강조하고 싶습니다. Online course , and manual Smart Price Action Concepts Indicator는 초보자와 경험 많은 트레이더 모두에게 매우 강력한 도구입니다. 20개 이상의 유용한 인디케이터를 하나로 결합하고, Inner Circle Trader Analysis와 Smart Money Concepts Trading Strategies 같은 고급 트레이딩 아이디어를 통합합니다. 이 인디
Scalping Lines System - 은 M1-H1 시간 프레임에서 금(XAUUSD) 자산을 거래하기 위해 특별히 설계된 스캘핑 트레이딩 시스템입니다. 추세, 변동성, 과매수/과매도 시장 분석 지표를 하나의 오실레이터로 통합하여 단기 신호를 식별합니다. 신호선의 주요 내부 매개변수는 사전 설정되어 있습니다. "Trend Wave Duration"은 이동평균선 추세를 사용하여 추세 방향으로 일련의 신호 지속 시간을 조절하고, "Apply Smoothing to Signal Line"은 신호선 생성 방식을 조정하는 매개변수로, 수동으로 조정할 수 있습니다. 시가에서 신호선을 계산할 때는 차트가 다시 그려지지 않습니다. 다른 가격대에서는 신호 화살표가 깜빡일 수 있습니다. 신호는 캔들 마감 후에 나타나며, 다양한 알림 유형을 사용할 수 있습니다. 권장 시간 프레임: M1, M5, M15, M30, H1. 이 지표는 원래 금 거래를 위해 설계되었지만, 스프레드가 낮은 변동성이
현재 30% 할인 ! 초보자 또는 전문가 트레이더를 위한 최고의 솔루션! 이 대시보드 소프트웨어는 28개의 통화 쌍에서 작동합니다. 2가지 주요 지표(Advanced Currency Strength 28 및 Advanced Currency Impulse)를 기반으로 합니다. 전체 Forex 시장에 대한 훌륭한 개요를 제공합니다. 고급 통화 강도 값, 통화 이동 속도 및 모든(9) 시간대의 28 Forex 쌍에 대한 신호를 보여줍니다. 추세 및/또는 스캘핑 기회를 정확히 파악하기 위해 차트의 단일 지표를 사용하여 전체 시장을 볼 수 있을 때 거래가 어떻게 개선될지 상상해 보십시오! 잠재적인 거래를 식별하고 확인하면서 강력한 통화와 약한 통화를 더욱 쉽게 식별할 수 있도록 이 지표에 기능을 내장했습니다. 이 표시기는 통화의 강세 또는 약세가 증가 또는 감소하는지 여부와 모든 시간대에서 수행되는 방식을 그래픽으로 보여줍니다. 추가된 새로운 기능은 현재 시장 조건 변화에 적응하는
Friends, we present to your attention our new Forex Gump Laser indicator. Since there are no designers in our team, but mainly mathematicians, financiers, programmers and traders, we did not make any special changes in the indicator design. In appearance, it resembles the usual Forex Gump. On the other hand, Forex Gump has become not just the name of an indicator, it is a brand. And we try to preserve the corporate identity in all its varieties. The whole essence of the indicator in its operatio
Market Structure Patterns MT4
Samuel Manoel De Souza
5 (18)
Market Structure Patterns   is an indicator based on   smart money concepts   that displays   SMC/ICT   elements that can take your trading decisions to the next level. Take advantage of the   alerts ,   push notifications   and   email messages   to keep informed from when an element is formed on the chart, the price crosses a level and/or enters in a box/zone. Developers can access the values of the elements of the indicator using the   global variables  what allows the automation of trading d
Cycle Sniper
Elmira Memish
4.39 (36)
Please contact us after your purchase and we will send you the complimentary indicators to complete the system Cycle Sniper is not a holy grail but when you use it in a system which is explained in the videos, you will feel the difference. If you are not willing to focus on the charts designed with Cycle Sniper and other free tools we provide, we recommend not buying this indicator. We recommend watching the videos about the indiactor and system before purchasing. Videos, settings  and descri
Scalper Inside PRO
Alexey Minkov
4.68 (69)
Scalper Inside PRO Scalper Inside PRO is an intraday trend and scalping indicator that uses exclusive built-in algorithms to evaluate market direction and key target levels. The indicator automatically calculates entry and exit points and several profit target levels, and it shows detailed performance statistics, so you can see how different instruments and strategies behaved on historical data. This helps you select instruments that fit current market conditions. You can also connect your own a
Atomic Analyst
Issam Kassas
5 (8)
이 제품은 2026년 시장에 맞게 업데이트되었으며 최신 MT5 빌드에 최적화되었습니다. 가격 업데이트 안내: Atomic Analyst는 현재 $99 에 제공됩니다. 다음 30회 구매 후 가격은 $199 로 인상됩니다. 특별 혜택: Atomic Analyst 구매 후 저에게 개인 메시지를 보내시면 Smart Universal EA를 무료 로 받을 수 있으며, Atomic Analyst 신호를 자동 거래로 전환할 수 있습니다. Atomic Analyst는 리페인트 없음, 재그리기 없음, 지연 없음의 Price Action 거래 인디케이터로, 수동 거래, 신호 명확성, EA 자동화를 위해 설계되었습니다. User manual: settings, inputs and strategy.     &   User Manual PDF . 가격 움직임, 강도, 모멘텀, 다중 시간대 방향 및 고급 필터를 분석하여 트레이더가 노이즈를 줄이고 약한 세팅을 피하며 더 체계적인 거래 결정을 내릴 수 있도
Easy Breakout
Mohamed Hassan
4.71 (14)
After your purchase, feel free to contact me for more details on how to receive a bonus indicator called VFI, which pairs perfectly with Easy Breakout for enhanced confluence!    Easy Breakout is a powerful price action trading system built on one of the most popular and widely trusted strategies among traders: the Breakout strategy ! This indicator delivers crystal-clear Buy and Sell signals based on breakouts from key support and resistance zones. Unlike typical breakout indicators, it levera
CRT Candle Range Theory HTF MT4.   Ultimate CRT Indicator: Advanced ICT Concepts and Malaysian SnR Trading System Master the Market Maker's Footprints with the Most Advanced Candle Range Theory Indicator Discounted   Price   $50  !!     Secure your lifetime access   now   before it switches to   subscription-only ! Unlock the true power of  Smart Money Concepts (SMC)  and trade precisely like the institutions with the  Ultimate CRT Indicator . Built exclusively for serious traders, this indicat
BTMM State Engine Pro MT4
Garry James Goodchild
BTMM State Engine Pro is a MetaTrader 4 indicator for traders who use the Beat The Market Maker approach: Asian session context, kill zone timing, level progression, peak formation detection, and a multi-pair scanner from a single chart. It combines cycle state logic with a built-in scanner dashboard so you do not need the same tool on many charts at once. What it does Draws the Asian session range; session times can follow broker server offset or be set in inputs. Tracks level progression (L
Dynamic Forex28 Navigator
Bernhard Schweigert
4.43 (7)
Dynamic Forex28 Navigator - 차세대 외환 거래 도구. 현재 49% 할인. Dynamic Forex28 Navigator는 오랫동안 인기 있는 지표의 진화형으로, 세 가지의 힘을 하나로 결합했습니다. 고급 통화 Strength28 지표(695개 리뷰) + 고급 통화 IMPULSE with ALERT(520개 리뷰) + CS28 콤보 신호(보너스). 지표에 대한 자세한 정보 https://www.mql5.com/en/blogs/post/758844 차세대 Strength 지표는 무엇을 제공합니까?  원래 지표에서 좋아했던 모든 것이 새로운 기능과 더 높은 정확도로 강화되었습니다. 주요 기능: 독점적인 통화 Strength 공식.  모든 시간대에 걸쳐 부드럽고 정확한 강도선. 추세와 정확한 진입을 식별하는 데 이상적입니다. 역동적인 시장 피보나치 수준(시장 피보나치).  이 지표에만 있는 고유한 기능. 가격 차트가 아닌 통화 강도에 피보나치가 적용됩니다.
Non Repaint Trend Bands
Ravshan Chuliev
5 (1)
Channel Trend Bands – A Comprehensive Indicator for Market Analysis MetaTrader 5 Version Simple to Use, Effective in Application User-Friendly and Suitable for All Traders This indicator stands out due to its straightforward functionality. Whether you're a beginner exploring the market or an experienced trader refining your strategy, this tool offers valuable insights. Using a Triangular Moving Average (TMA) with additional ATR-based bands , it provides structured market data to support well-i
Super Signal – Skyblade Edition 전문가용 노리페인트 / 노래그 트렌드 신호 시스템, 뛰어난 승률 제공 | MT4 / MT5용 1분, 5분, 15분과 같은 낮은 타임프레임에서 가장 좋은 성능을 보입니다. 핵심 기능: Super Signal – Skyblade Edition은 추세 매매를 위해 설계된 스마트 신호 시스템입니다. 이 시스템은 다중 필터 로직을 활용하여, 명확한 방향성과 실질적인 모멘텀이 수반된 고품질 추세만을 감지합니다. 이 시스템은 고점 또는 저점을 예측하지 않으며 , 다음 세 가지 조건이 모두 충족될 때만 신호를 발생시킵니다: 명확한 추세 방향 강화되는 모멘텀 건전한 변동성 구조 또한, 시장 세션 기반의 유동성 분석을 통해 신호의 신뢰성과 타이밍을 더욱 향상시킵니다. 신호 특성: 모든 화살표 신호는 100% 리페인트 없음 / 지연 없음 신호가 한 번 발생하면 고정되며, 깜빡이거나 사라지지 않음 차트 상의 시각적 화살표, 정보 패널, 팝업 알
Apollo BuySell Predictor 는 여러 거래 모듈을 포함하는 전문 거래 시스템입니다. 트레이더에게 고유한 브레이크아웃 영역, 피보나치 기반 지원 및 저항 수준, 피벗 추세선, 풀백 볼륨 신호 및 모든 트레이더가 매일 필요로 하는 기타 유용한 기능을 제공합니다. 시스템은 모든 쌍과 함께 작동합니다. 권장 시간 프레임은 M30, H1, H4입니다. 지표는 H4보다 높은 시간 프레임을 제외하고 다른 시간 프레임에서도 작동할 수 있습니다. 이 시스템은 모든 트레이더가 성공적인 거래에 필요한 모든 것을 제공하므로 보편적입니다. 이 시스템은 여러 가지 방법으로 사용할 수 있습니다. 데이 트레이딩, 스윙 트레이딩, 심지어 스캘핑까지 사용할 수 있습니다. 귀하가 선호하는 거래 스타일에 관계없이 시스템은 귀하가 시장을 실제 모습으로 볼 수 있도록 도와줄 것입니다. 모든 신호는 다시 칠하지 않고 지체하지 마십시오! 거래 기본 설정 및 작업에 따라 시스템의 다른 모듈을 켜거나 끌 수 있습
제작자의 제품 더 보기
Break Out Zones mt4
Ifeanyi Charles Nneli
Overview Break Out Zones is a comprehensive market structure analysis indicator for MT4 that identifies and displays key price levels, order blocks, and structural breakouts in real-time. The indicator helps traders understand market flow by automatically detecting swing points, internal structure changes, and significant zones where price action may react. Key Features 1. Market Structure Detection Automatic identification of swing highs and lows with configurable length parameter. Internal st
EfratBuilds MACD mt4
Ifeanyi Charles Nneli
OMACD(이동평균 수렴확산 오실레이터)는 기존 MACD 지표의 고급 변형으로, 트레이더에게 더 빠른 신호 감지와 향상된 시장 변화 반응성을 제공합니다. 가격 방향을 측정하는 기존 MACD와 달리 OMACD는 모멘텀 자체의 변화를 감지하는 데 중점을 두어 더 깊은 수준의 시장 분석을 제공합니다. 이 지표는 지수 이동평균을 재귀적으로 적용하여 작동합니다. 먼저 가격의 빠른 지수 이동평균과 느린 지수 이동평균의 차이를 계산하여 표준 MACD를 계산합니다. 그런 다음 OMACD는 여기서 멈추지 않고 이 결과에 동일한 계산 프로세스를 다시 적용하여 트레이더들이 2차 모멘텀 지표라고 부르는 것을 만듭니다. 시각적 표시는 여러 구성 요소로 이루어져 있습니다. 메인 OMACD 라인은 초기 MACD 히스토그램에 적용된 빠른 지수 이동평균과 느린 지수 이동평균 간의 차이를 나타냅니다. 신호선은 OMACD 라인의 평활화된 버전으로 추세 변화를 식별하는 데 도움이 됩니다. 히스토그램은 이 두 라인 간의
필터:
리뷰 없음
리뷰 답변