Smart Ict Fvg Pro Multi Timeframe
- インディケータ
- バージョン: 3.0

Overview
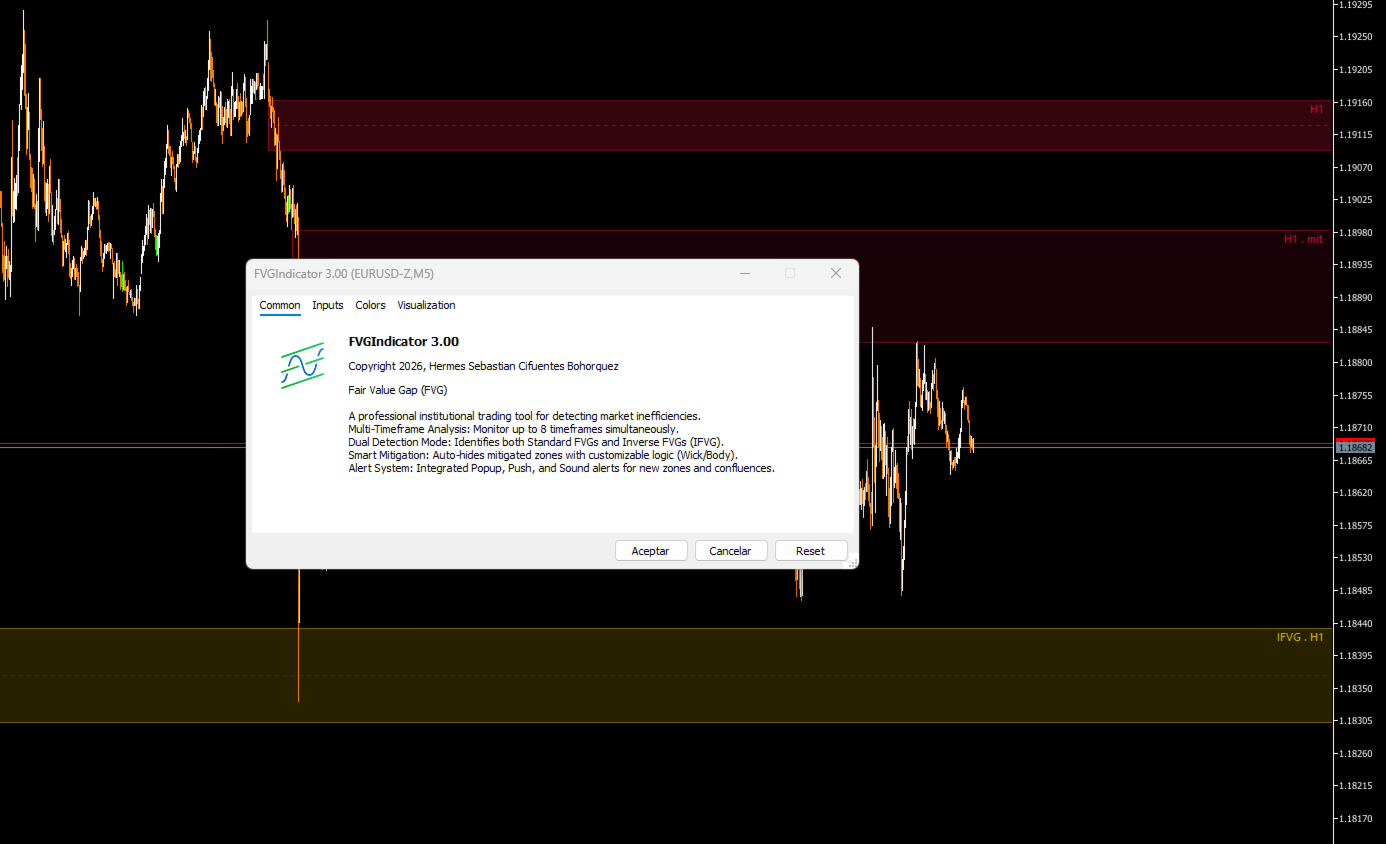
The Fair Value Gap (FVG) Indicator v3.0 is a professional tool for MetaTrader 5 designed to detect and visualize market imbalances (inefficiencies) in real time. This indicator identifies areas where the price has left liquidity gaps, which often act as price magnets or support/resistance zones.
Key Features
Automatic Detection: Accurately identifies bullish and bearish FVGs.
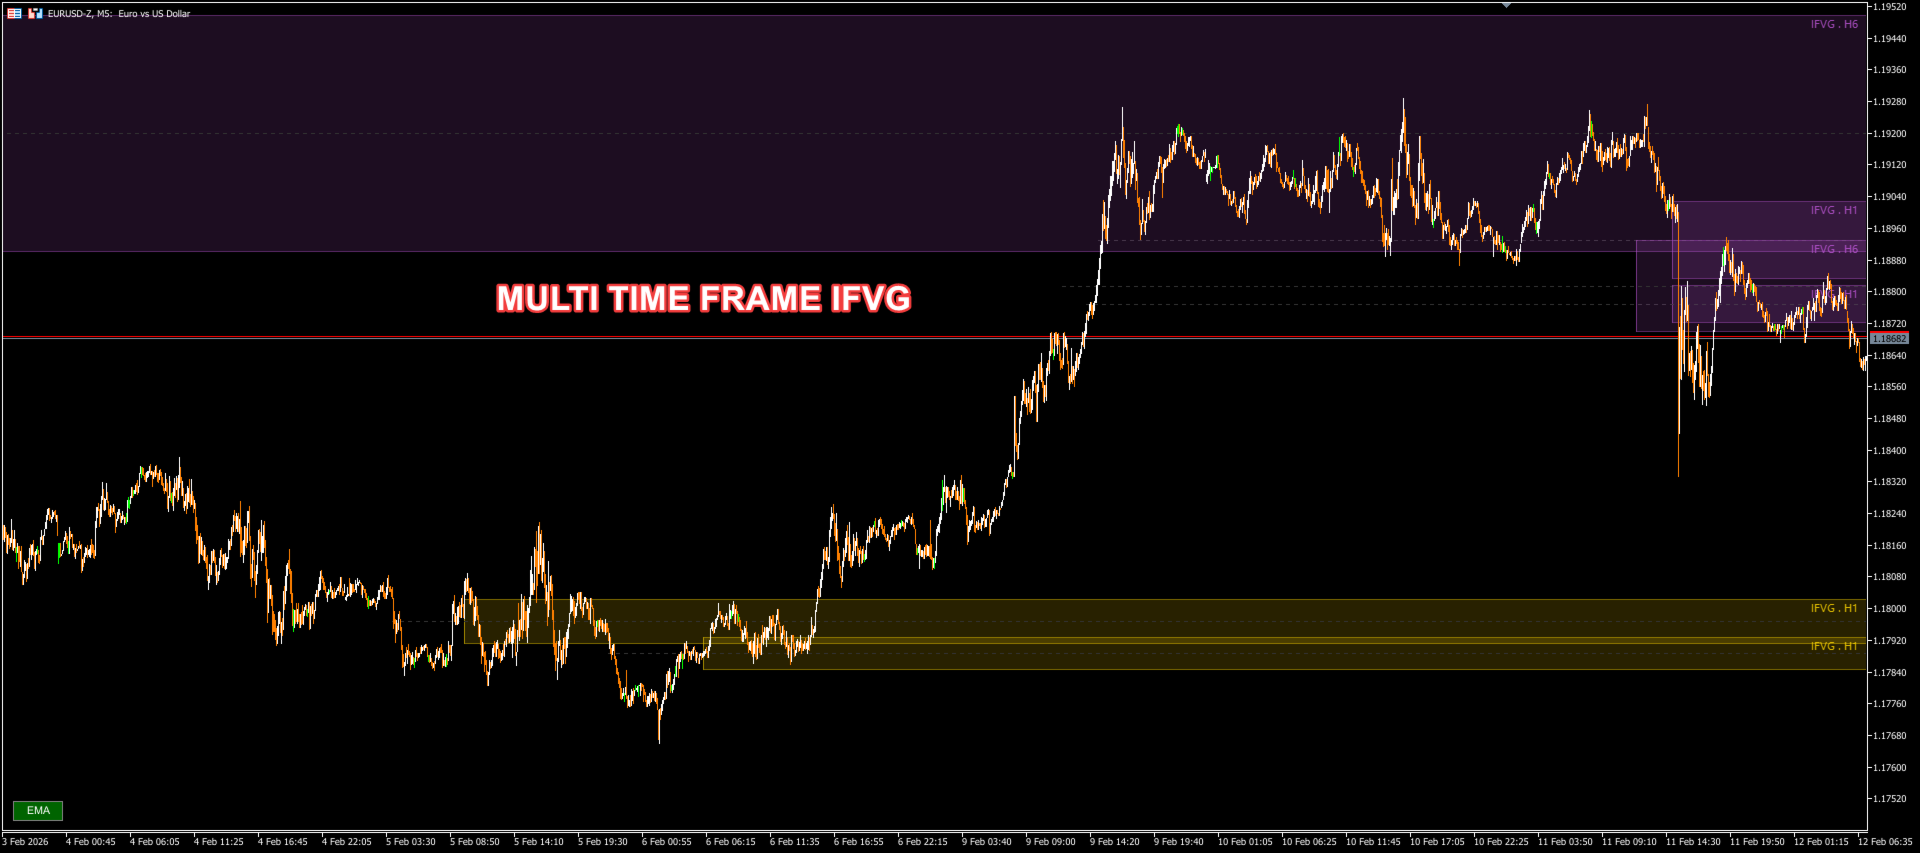
Multi-Timeframe (MTF): Monitors up to 8 timeframes simultaneously on a single chart.
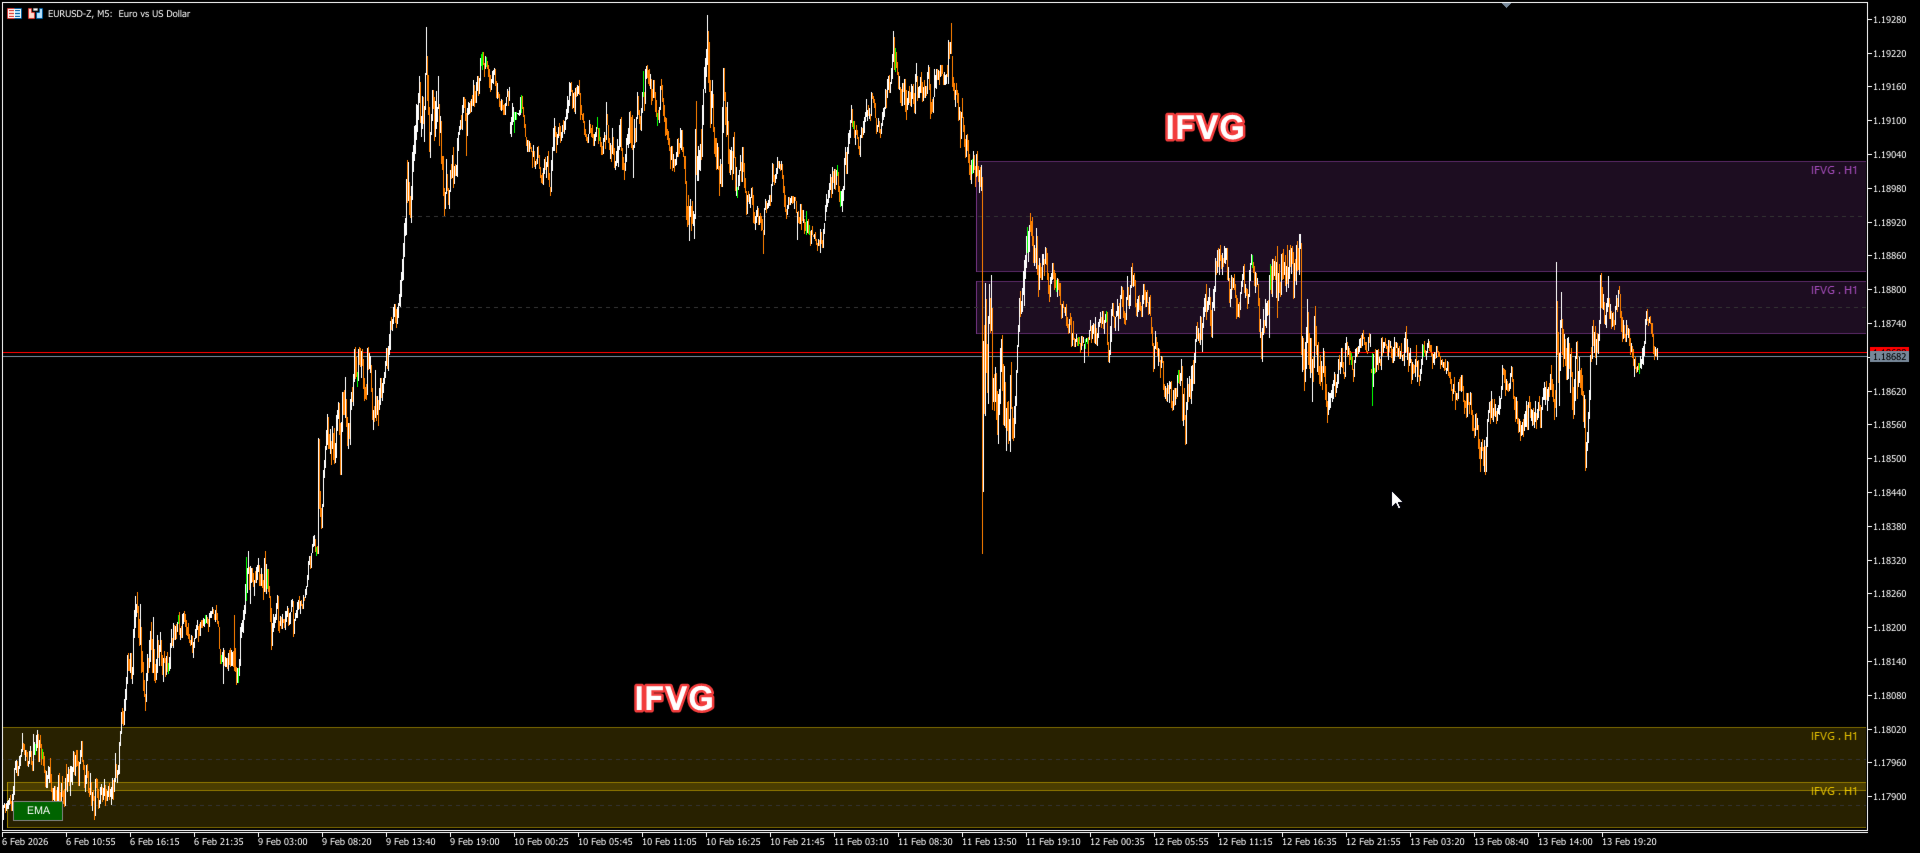
Inverse FVG (IFVG): Detects when an FVG zone is broken and becomes an inverse zone (support becomes resistance and vice versa).
Advanced Mitigation Logic: Options to define when a zone is considered "mitigated" (Wick, Body, or 50%).
Comprehensive Alerts: Pop-up, push (mobile), and sound notifications when the price touches a zone or confluences are detected.
Optimized Performance: High-performance graphics rendering system that doesn't slow down the platform or cause flickering.
Visual Interpretation
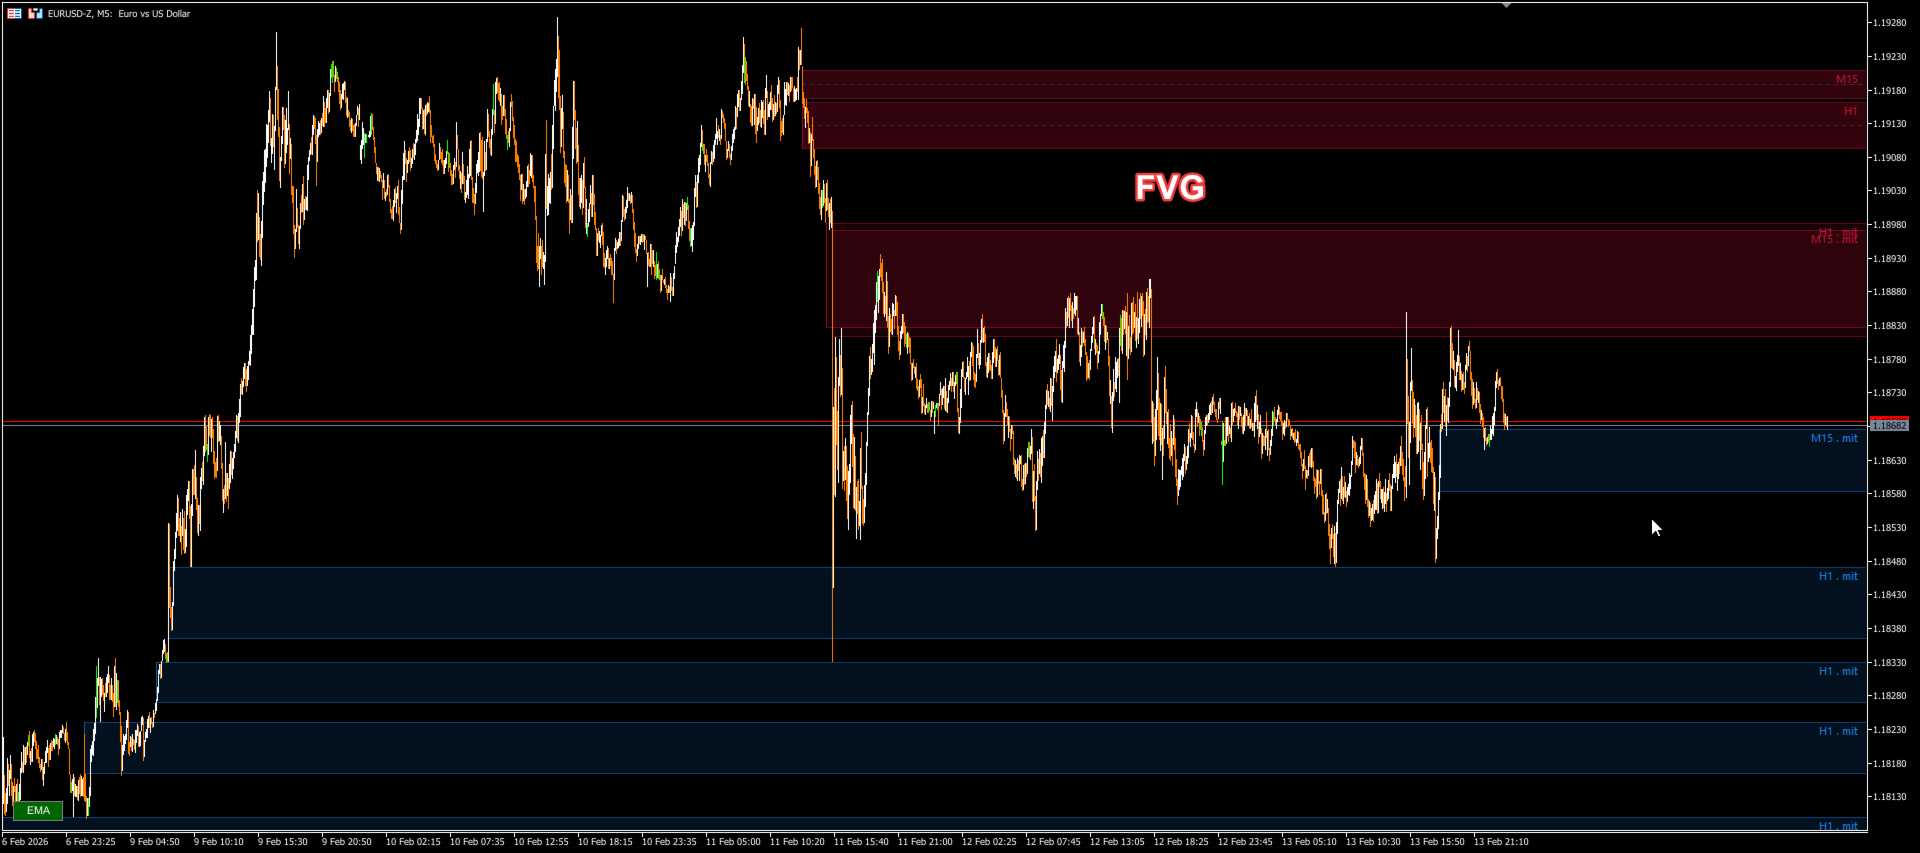
1. Solid Rectangles (Active FVG)
These represent areas of imbalance that have not yet been fully mitigated or invalidated.
Blue (Configurable): Bullish FVG. Potential demand zone. Expect upward bounces.
Red (Configurable): Bearish FVG. Potential supply zone. Expect downward rejections.
2. Dashed Line
A dashed line in the center of the rectangle marks the 50% of the zone (Consecutive Encroachment), a key level for institutional reaction.
3. Inverse Zones (IFVG)
When the price closes with a body outside of an IFVG, the zone changes color (e.g., Gold/Violet) and expands as an Inverse IFVG.
If a Bullish IFVG breaks down, it becomes Resistance (Bearish IFVG).
If a Bearish IFVG breaks up, it becomes Support (Bullish IFVG).
4. Mitigation
When the price touches the zone according to the chosen configuration, the zone is considered mitigated. It can be configured to disappear or become more transparent.
Configuration Parameters
=== Multi-Timeframe (8 Slots) ===
Allows you to overlay IFVGs from higher timeframes on your current chart.
Timeframe Slots 1-8: Select the timeframes to monitor (e.g., H1, H4, D1). Leave it as CURRENT for the current timeframe or NONE to disable the slot.
Max Historical Bars: Number of past bars to analyze (recommended: 500-1000).
=== FVG Visualization ===
Show Standard FVGs: Show/Hide standard FVGs.
Show Bullish / Bearish: Filter for only one direction.
Colors: Customize colors for bullish and bearish zones.
=== Inverse FVG (IFVG) ===
Enable IFVG Detection: Activates zone reversal logic.
IFVG Colors: Different colors for inverse zones.
=== Zone Validation ===
Validation Period: Number of bars a zone must remain valid before being confirmed.
Validation Factor: Sensitivity adjustment (0.1 - 1.0) to validate zone strength.
Max Visible FVGs: Maximum number of rectangles per timeframe to keep the chart clean.
=== Noise Filters ===
Validation Period: Uses 20 candles to filter out insignificant zones.
ValidationFactor: Zones smaller than this size will be ignored as "noise."
Mitigation Method: Defines what counts as mitigation:
Wick: A wick simply needs to touch the zone.
Body: The candle body must close within the zone.
50 Percent: The price must touch the 50% mark of the zone.
Stop Extension on Mitigation: If true, the rectangle stops being drawn on the right once the price mitigates it.
=== Visual Options ===
Show 50% Mid-Line: Displays the 50% mid-line within the rectangle.
Show Labels: Displays text labels with the timeframe (e.g., "H1," "H4 · mit").
=== Zone Extension ===
Stop Extension on First Touch: Stops the rectangle immediately upon first price contact.
=== Transparency ===
Adjust the opacity (0-255) to avoid obstructing the view of the candlesticks.
Active Alpha: Opacity of live areas.
Mitigated Alpha: Opacity of areas already touched (if displayed).
Border Alpha: Opacity of the rectangle's border.
=== Alerts ===
Popup / Push / Sound: Types of alerts to receive.
Alert Cooldown: Wait time in seconds between repeated alerts to avoid saturation.
Confluence Alert: Special alert if the price touches an area where FVGs from multiple timeframes coincide.
Troubleshooting Common Problems
Rectangles not appearing: Verify that ActiveTFs has at least one slot configured (e.g., Slot 1 = Current) and that there is sufficient historical data.
Too many areas: Reduce Max Historical Bars or activate Stop Extension on Mitigation.