Breakout Trend Scanner MT5
- インディケータ
- バージョン: 2.1
- アップデート済み: 5 6月 2026
- アクティベーション: 20

Contact me for instruction, any questions!
- Lifetime update free
- Non-repaint
- I just sell my products in Elif Kaya Profile, any other websites are stolen old versions, So no any new updates or support.
Introduction
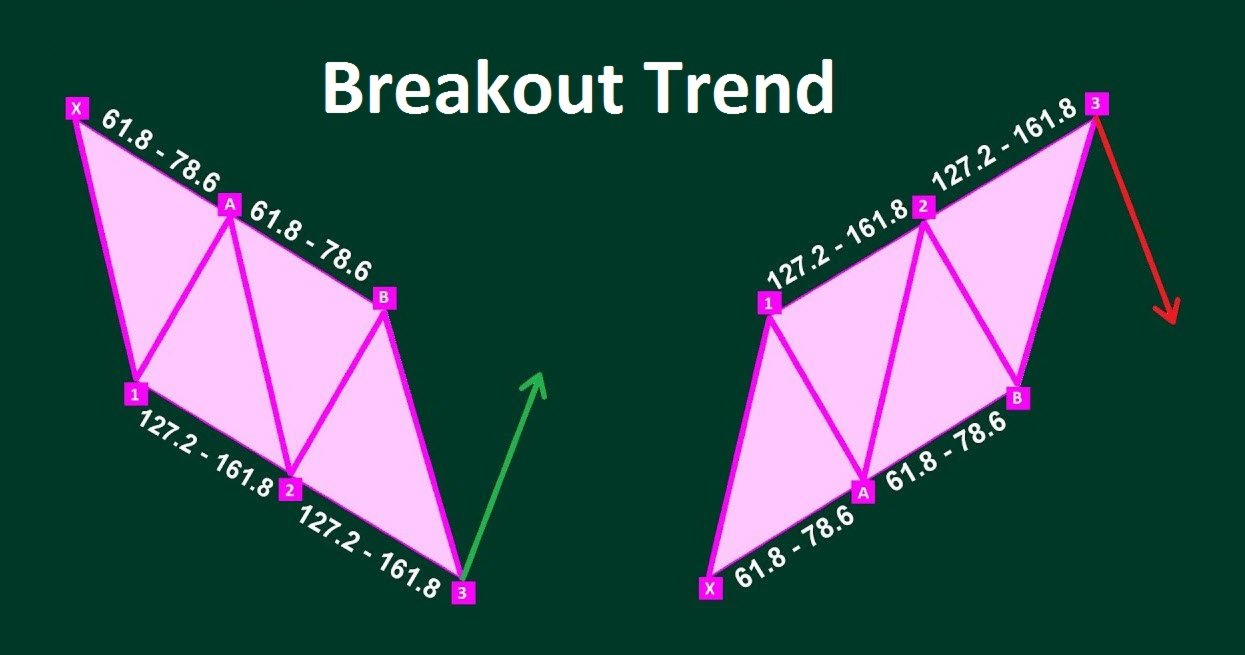
Breakout Trend Scanner indicator works based on the Elliott Wave in technical analysis describes price movements in the financial market that are related to changes in trader sentiment and psychology and finds end of movement and breakout trend.
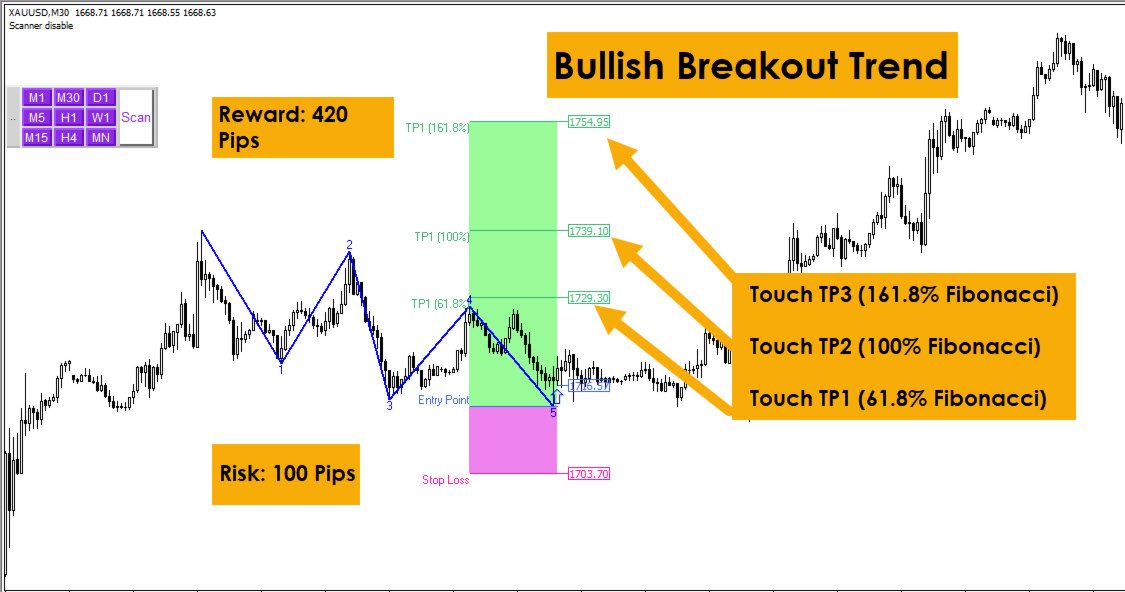
The Elliott Wave pattern that is formed by 5 consecutive symmetrical moves up or down. In its bullish form, the market is making 5 drives to a bottom before an uptrend forms. In a bearish 5-drive, it is peaking before the bears take over.
Trend Breakout Scanner
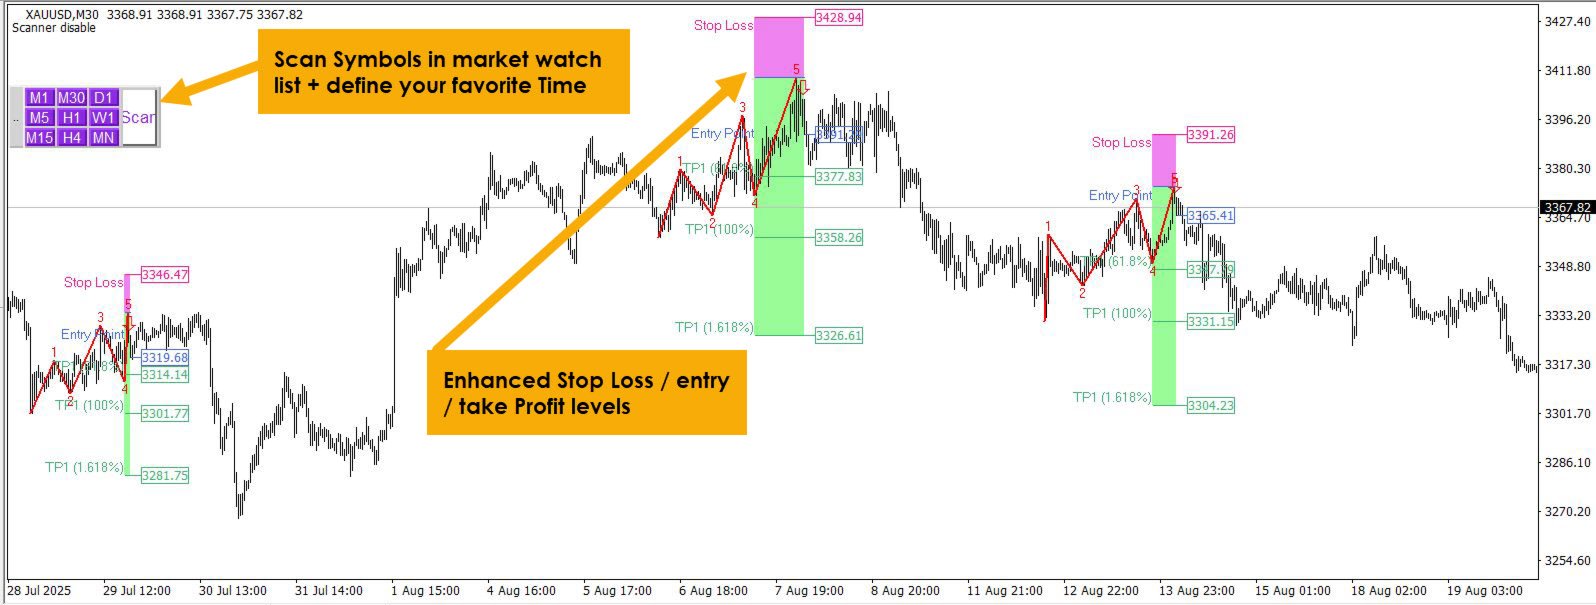
Scan, Fibonacci calculations and pattern recognition are completely done by Breakout Trend Scanner indicator; All you do is "press the scan button". It sends alert and push notification on your mobile.
How To Work