Super Trend Strategy
- インディケータ
- バージョン: 1.1
- アップデート済み: 30 4月 2025

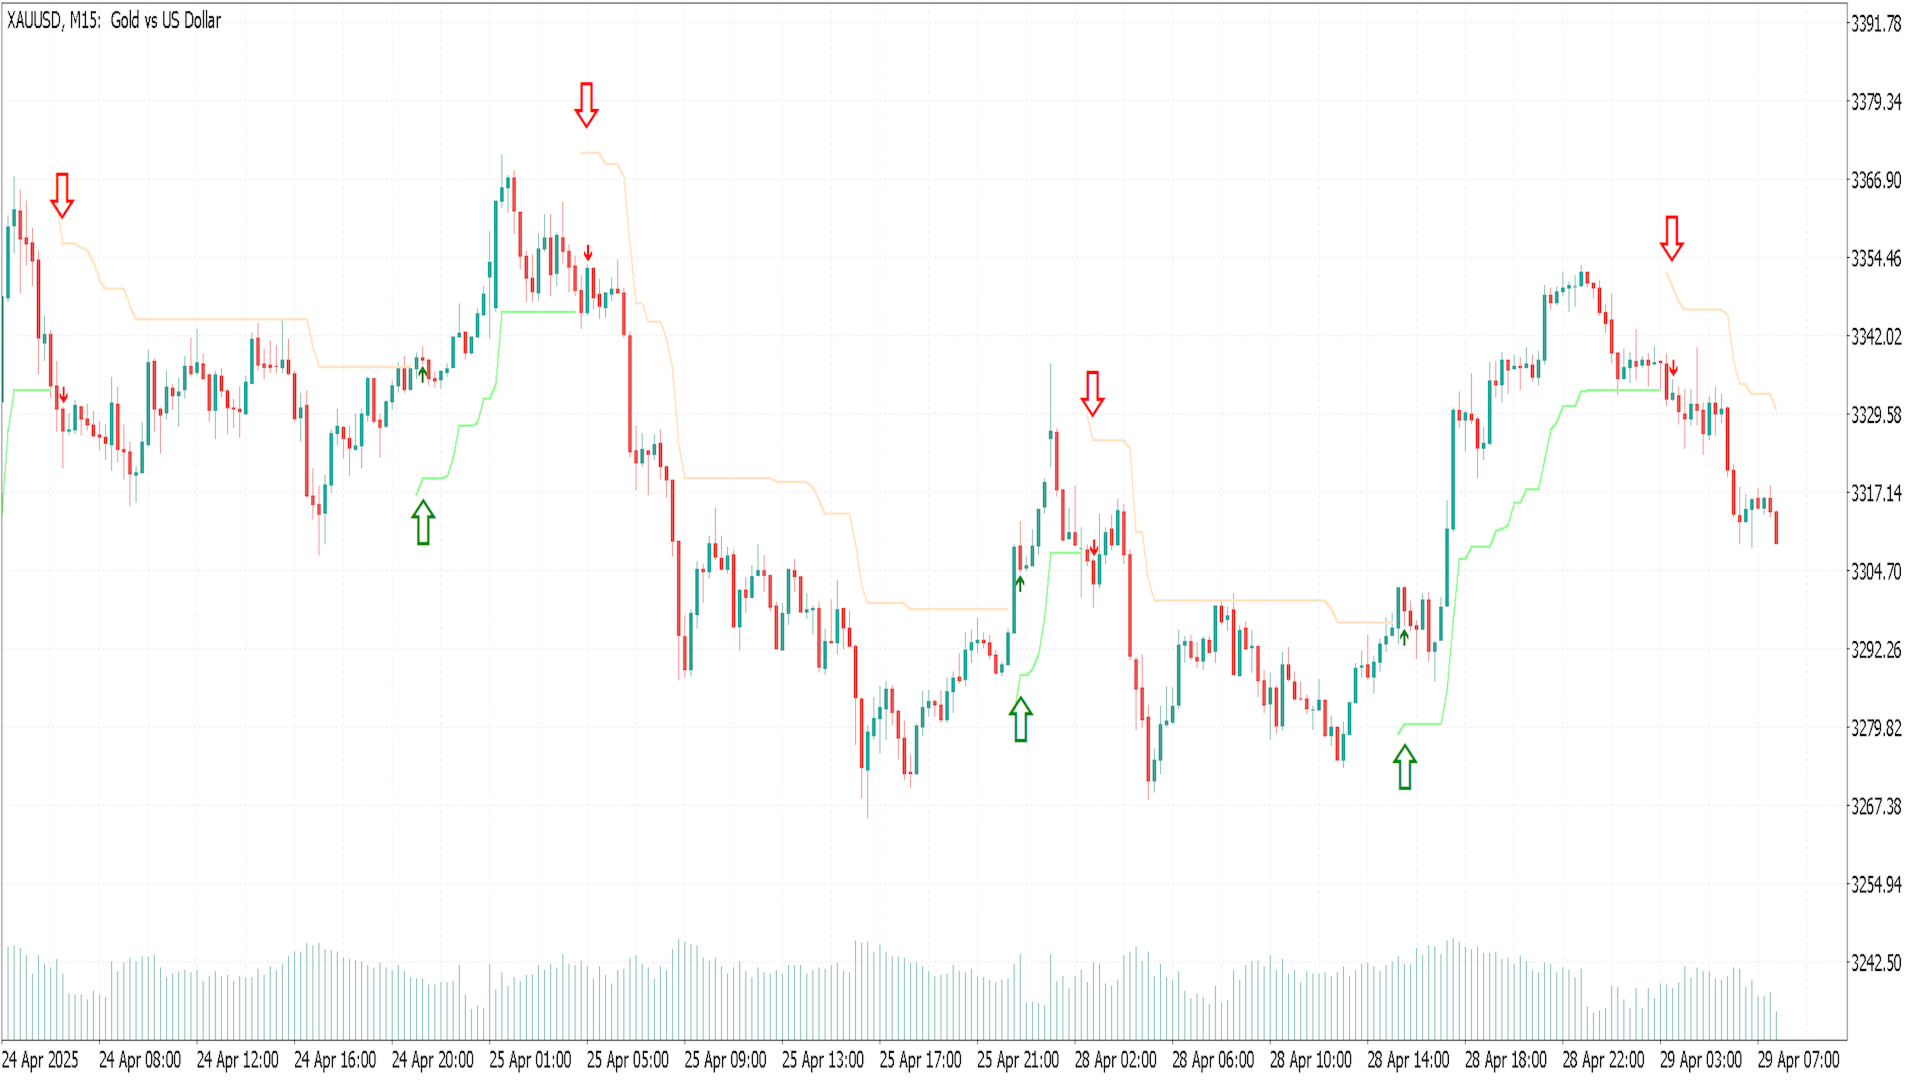
The SuperTrend Strategy is a widely-used technical indicator based on the Average True Range (ATR), primarily employed as a trailing stop tool to identify prevailing market trends.
The indicator is designed for ease of use while providing reliable insights into the current market trend. It operates based on two key parameters: the period and the multiplier. By default, it uses a period of 15 for the ATR calculation and a multiplier of 3.
The Average True Range (ATR) plays a crucial role in the SuperTrend’s calculation, as it measures market volatility and adjusts the indicator’s position relative to price movements accordingly.
Signal Generation:
-
A buy signal is generated when the SuperTrend plots below the closing price.
-
Conversely, a sell signal is triggered when the SuperTrend plots above the closing price.
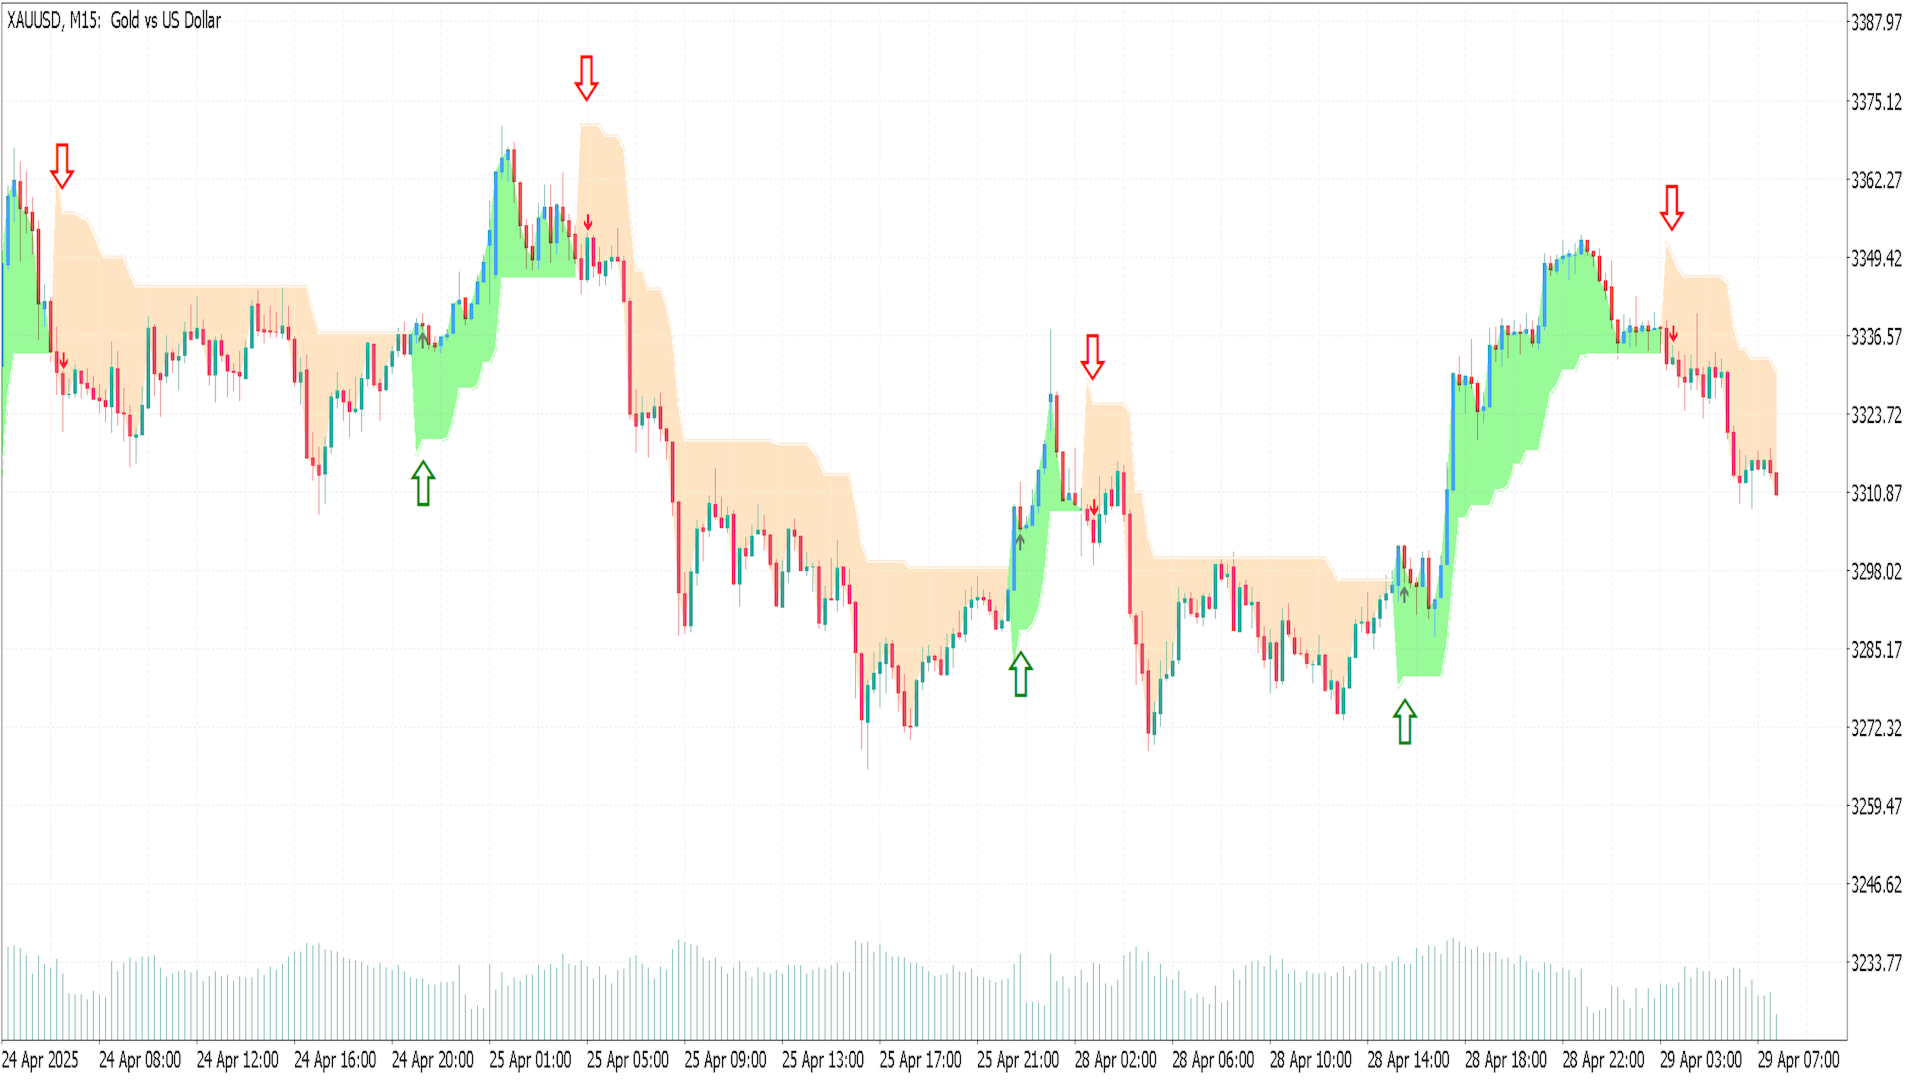
These signals indicate potential shifts in market direction — for instance, a move from a downtrend to an uptrend or vice versa — typically accompanied by a color change in the indicator’s display (e.g., from green to red).
The SuperTrend indicator can be applied across various markets, including equities, futures, forex, and cryptocurrencies, and is suitable for use on multiple timeframes such as hourly, daily, or weekly charts. However, it tends to be less effective in sideways or ranging market conditions, where clear trends are absent.
IMPORTANT NOTE:
This Indicator works best on XAUUSD M15.
Buy and sell signals generated by the indicator can occasionally produce false or noisy signals; therefore, it is recommended to confirm entries using additional indicators or price action analysis for improved trade accuracy.


Hello beautiful work, can you make a notification on the phone?