Follow The Line MT5
- インディケータ
- バージョン: 1.0

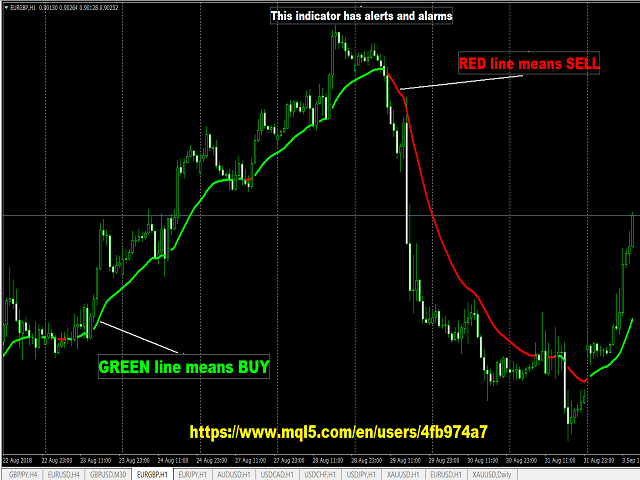
This indicator obeys the popular maxim that: "THE TREND IS YOUR FRIEND"
It paints a GREEN line for BUY and also paints a RED line for SELL. (you can change the colors).
It gives alarms and alerts of all kinds. IT DOES NOT REPAINT and can be used for all currency pairs and timeframes.
Yes, as easy and simple as that. Even a newbie can use it to make great and reliable trades.
NB:
For best results, get my other premium indicators for more powerful and reliable signals. Get them here:
https://www.mql5.com/en/market/product/31361
https://www.mql5.com/en/market/product/31365
Check my other products and EAs too:
https://www.mql5.com/en/users/4fb974a7/seller#products
IF YOU NEED THE SOURCE CODE FOR YOUR PROJECT, CONTACT ME. IT'S ONLY $60


Not bad