• 概要
  • レビュー (12)
  • コメント (87)
  • 最新情報

Blahtech Market Profile MT5

5

Was: $249  Now: $149  

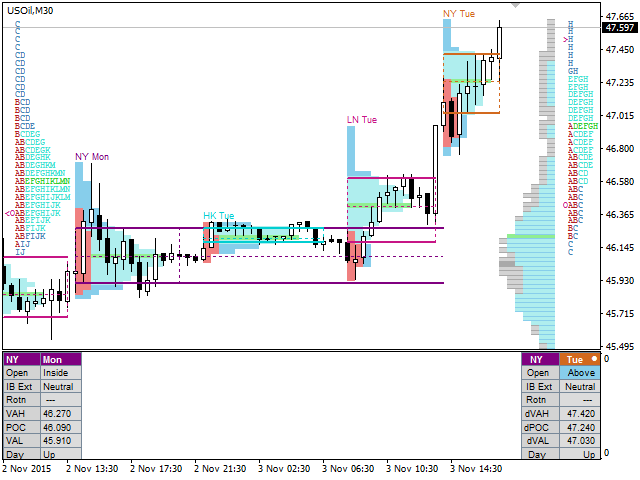
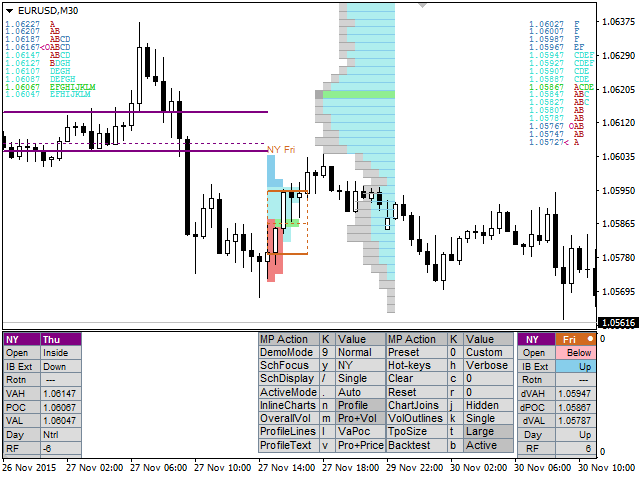
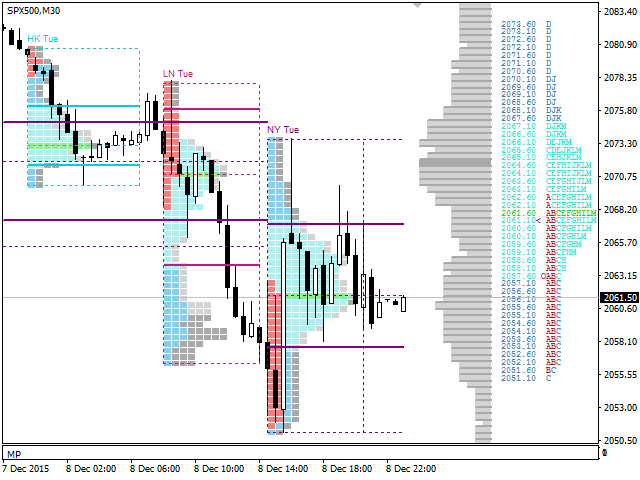
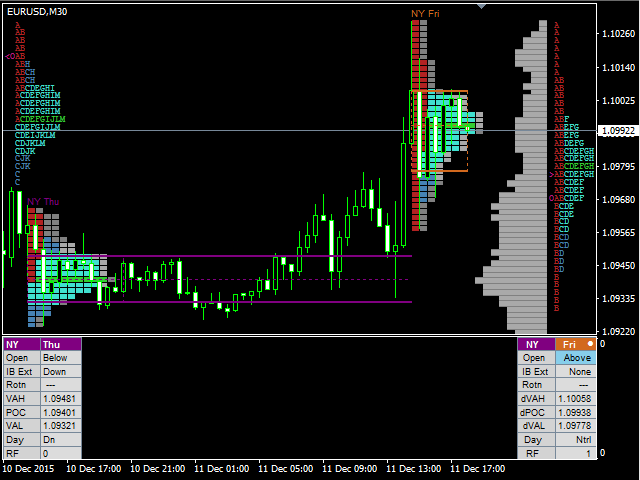
Market Profile defines a number of day types that can help the trader to determine market behaviour. A key feature is the Value Area, representing the range of price action where 70% of trading took place. Understanding the Value Area can give traders valuable insight into market direction and establish the higher odds trade. It is an excellent addition to any system you may be using.

Inspired by Jim Dalton’s book “Mind Over Markets”, this indicator is designed to suit the needs of all profile traders. It delivers functionality usually only available on futures platforms and adds innovations like auto focus switching and backtest mode.

Links [ Documentation | Install | Update Training All Products ]


Feature Highlights

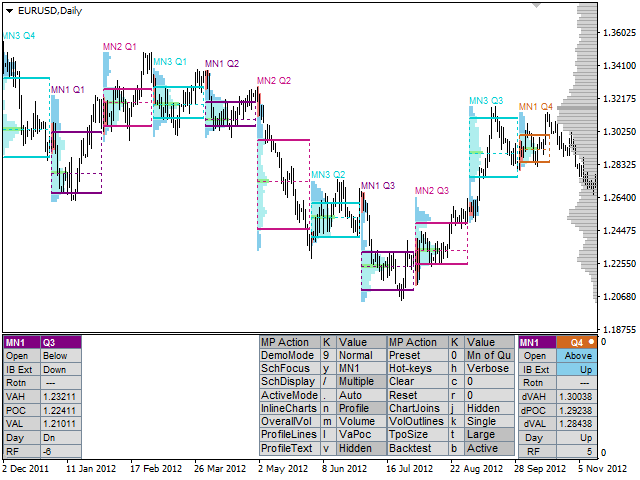
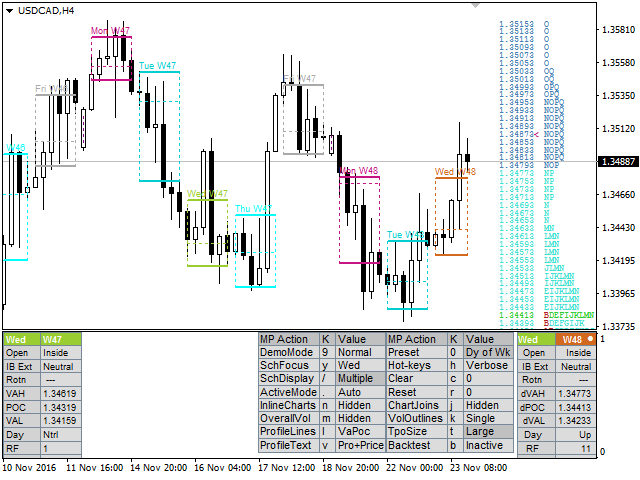
  • Configuration presets for schedules on higher timeframes
  • Auto switching of focus to next active session
  • Highlight of business rules – Open, IB Extension and Rotation Rules
  • Backtest directly on the chart
  • Custom sessions, intervals and timeframe period
  • Overall market and volume profiles
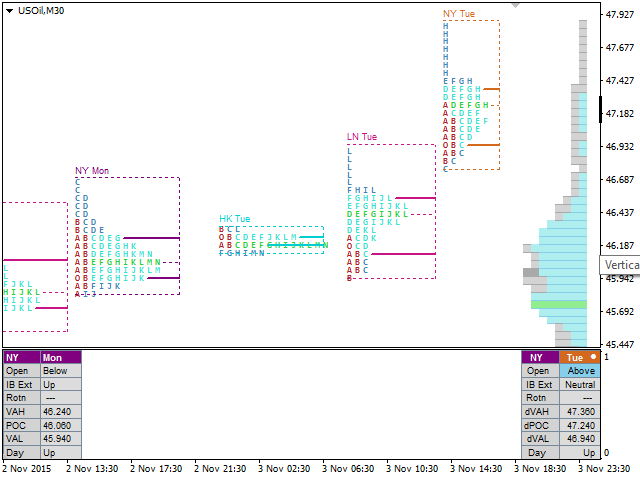
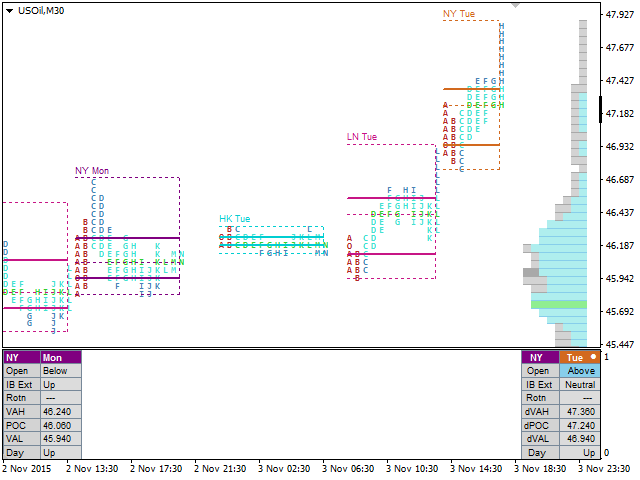
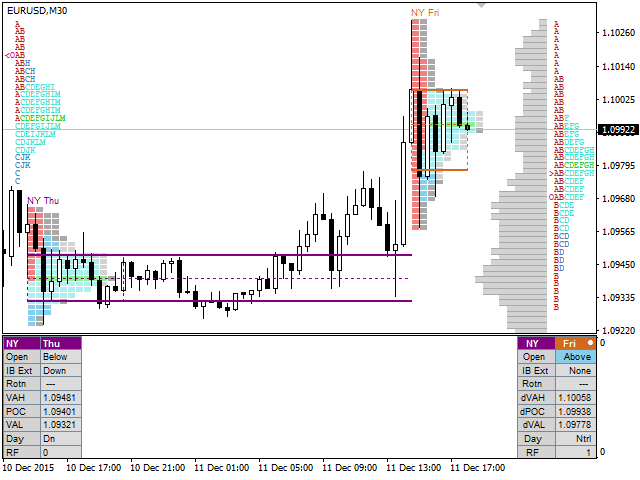
  • Text based TPO profiles
  • Configurable TPO start letter
  • Value Areas, Initial balance, Point of control
  • Fast access hot-keys


Full parameter documentation - https://www.mql5.com/en/blogs/post/700844


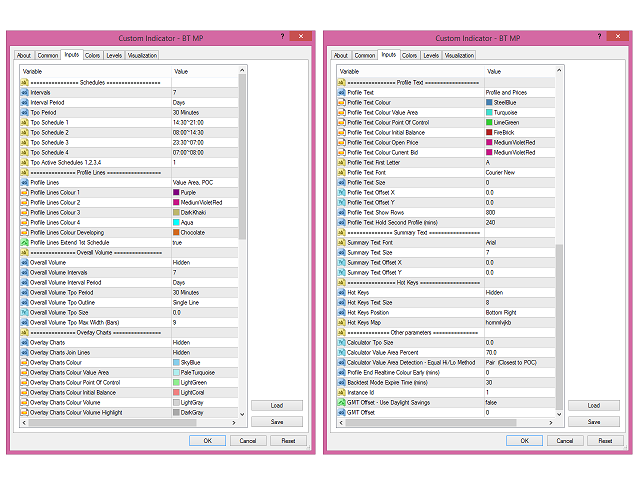
Input Parameters

Presets

  • Configuration Preset – Choose custom or predefined schedules. Hotkey “0”

Schedules

  • Intervals- Number of interval periods to display
  • Interval Period - Timeframe of the intervals (Days)
  • TPO Period - Timeframe for each TPO row (30 mins)
  • TPO size
  • TPO Schedule 1-7
  • TPO Schedule Names
  • TPO Schedule Display - Single / Multi. Hotkey “/”
  • TPO Schedule Active Mode - Auto/Man. Hotkey “.”
  • TPO Active Schedules - e.g. 2,1,3

Profile Lines

  • Profile Lines - Choose which lines are shown on chart. Hot-Key "L"
  • Profile Lines Colour 1-7, styles, fonts
  • Profile Lines Width Horizontal
  • Profile Lines Width Vertical - (0 to remove)
  • Profile Lines Titles - Choose the titles to be displayed on the chart
  • Profile Lines Extend Active Schedule - Extend previous active schedule lines to the next interval

Overall Volume

  • Overall Volume - Display graphic profile. Hot-Key "M"
  • Overall Volume Interval Period - Timeframe of the intervals (Days)
  • Overall Volume TPO Period - Timeframe for each TPO row (30 mins)
  • Overall Volume TPO size
  • Overall Volume TPO Outline - Outline style (Single line). Hot-Key "K"
  • Overall Volume Highlight Value Area
  • Overall Volume Custom Schedule

Overlay Charts

  • Overlay Charts - Display graphic profile. Hot-Key "N"
  • Overlay Charts Join Lines - Separators between each TPO. Hot-Key "J"
  • Overlay Charts Colours x7

Profile Text

  • Profile Text – Display text profile at the sides of the chart. Hot-Key "V"
  • Profile Text Colours x6
  • Profile Text Show Rows - Set limit for the maximum number of TPO rows to display
  • Profile Text First Letter - Start char for TPO letters (A)

Summary Text

  • Summary Text Font, Size, positions
  • Summary Text Composite Day Text

Hot Keys

  • Hot Keys - Display Hot Keys dialog. Hot-Key "H"
  • Hot Keys Text Size, Positions
  • Hot Key Map - Keyboard hot-key input map - Allows the user to re-assign the hot-keys

Other Parameters

  • Instance Id - Unique id for multiple instances per chart
  • Calculator Tpo Size Factor - Normal/Large TPO scaling. Hotkey “T”
  • Calculator Value Area Percent - TPO within the Value Area (70%)
  • Configuration Presets – Overall Volume Intervals – Override for presets
  • GMT Offset - Use Daylight Savings - Use Daylight savings. Adjust the time by 1 hour in March/September
  • GMT Offset - Manual GMT offset in seconds
レビュー 12
Lamar Jackson
316
Lamar Jackson 2025.02.04 09:12 
 

N°1 Form the middle of trading, A+++++++++++++++++++

Denis Sokolovsky
421
Denis Sokolovsky 2023.06.25 21:39 
 

thank you :)

RiaB
59
RiaB 2022.11.14 21:23 
 

This is a powerful tool for a serious intraday trader. It is highly customizable and full of unique features second to none on the market.

おすすめのプロダクト
SMC Venom Model BPR インジケーターは、スマート マネー (SMC) コンセプトで取引するトレーダー向けのプロフェッショナル ツールです。価格チャート上の 2 つの主要なパターンを自動的に識別します。 FVG   (フェアバリューギャップ) は、3 本のローソク足の組み合わせで、最初のローソク足と 3 番目のローソク足の間にギャップがあります。ボリュームサポートのないレベル間のゾーンを形成し、価格修正につながることがよくあります。 BPR   (バランス価格範囲) は、2 つの FVG パターンの組み合わせで、「ブリッジ」を形成します。これは、価格がボリュームアクティビティの少ない動きで動くときに、ブレイクアウトしてレベルに戻るゾーンで、ローソク足の間にギャップを作成します。 これらのパターンは、大規模な市場プレーヤーと一般参加者の相互作用が発生するチャート上のボリュームと価格動向の分析に基づいて、トレーダーが主要なサポート/レジスタンス レベル、ブレイクアウト ゾーン、エントリ ポイントを識別するのに役立ちます。 インジケーターは、長方形と矢印の形でパターンを視覚
Advanced Volume Profile Analysis Tool for MetaTrader 5 The Kecia Volume Profile Order Finder provides traders with volume profile analysis capabilities. This MT5 indicator combines volume profile visualization with statistical calculations to help identify potential trading opportunities and suggests entry, stop loss, and take profit levels based on market structure. Market Profile Visualization Transform your chart with customizable volume profile visualizations: Multiple visualization options
The market is unfair if only because 10% of participants manage 90% of funds. An ordinary trader has slim changes to stand against these "vultures". This problem can be solved. You just need to be among these 10%, learn to predict their intentions and move with them. Volume is the only preemptive factor that faultlessly works on any timeframe and symbol. First, the volume appears and is accumulated, and only then the price moves. The price moves from one volume to another. Areas of volume accumu
プレミアムレベルは、正しい予測の精度が80%を超える独自の指標です。 この指標は、最高のトレーディングスペシャリストによって2か月以上テストされています。 あなたが他のどこにも見つけられない作者の指標! スクリーンショットから、このツールの正確さを自分で確認できます。 1は、1キャンドルの有効期限を持つバイナリーオプションの取引に最適です。 2はすべての通貨ペア、株式、商品、暗号通貨で機能します 手順: 赤い矢印が表示されたらすぐにダウントレードを開き、青い矢印が表示されたら閉じます。青い矢印の後に開くこともできます。 試してテストしてください!推奨設定はデフォルトです! 日足チャートで最高の精度を示します! インディケータは、2600 Pipsの収益性に対して、約10Pipsという非常に小さなマージンを使用します。
To download MT4 version please click here . - This is the exact conversion from TradingView: "Trend Direction Force Index - TDFI [wm]" By "causecelebre". - The screenshot shows similar results from tradingview and Metatrader when tested on ICMarkets on both platforms. - This indicator uses multiple levels of averaging to detect trend strength. - You can optimize filter low and filter high levels to achieve best results. - You have access to buffers to use in EAs. - This is a light-load processin
Was: $299  Now: $149  Supply Demand uses previous price action to identify potential imbalances between buyers and sellers. The key is to identify the better odds zones, not just the untouched ones. Blahtech Supply Demand indicator delivers functionality previously unavailable on any trading platform. This 4-in-1 indicator not only highlights the higher probability zones using a multi-criteria strength engine, but also combines it with multi-timeframe trend analysis, previously confirmed swings
The volume profile indicator of the market + a S mart oscillator . It works on almost all instruments - currency pairs , stocks , futures , cryptocurrency , on real volumes and on tick ones . You can set both the automatic definition of the profile range , for example , for a week or a month , etc . , and set the range manually by moving the boundaries ( two vertical lines red and blue ) . It is shown as a histogram . The width of the histogram at this level means , conditionally , the number of
Market Profile Introducing the Market Profile MetaTrader Indicator—your gateway to mastering market dynamics with precision and insight. This powerful tool delivers a classic Market Profile analysis, revealing price density over time and highlighting crucial levels, including the value area and control value for any trading session.  Compatible with timeframes from M1 to D1, it adapts to daily, weekly, monthly, or even intraday sessions, offering you unmatched flexibility. Lower timeframes prov
インディケータは現在のクオートを作成し、これを過去のものと比較して、これに基づいて価格変動予測を行います。インジケータには、目的の日付にすばやく移動するためのテキスト フィールドがあります。 オプション: シンボル - インジケーターが表示するシンボルの選択; SymbolPeriod - 指標がデータを取る期間の選択; IndicatorColor - インジケータの色; HorisontalShift - 指定されたバー数だけインディケータによって描画されたクオートのシフト; Inverse - true は引用符を逆にします。false - 元のビュー。 ChartVerticalShiftStep - チャートを垂直方向にシフトします (キーボードの上下矢印)。 次は日付を入力できるテキストフィールドの設定で、「Enter」を押すとすぐにジャンプできます。
Noize Absorption Index - is the manual trading system that measures the difference of pressure between bears forces and bulls forces. Green line - is a noize free index that showing curent situation. Zero value of index shows totally choppy/flat market.Values above zero level shows how powerfull bullish wave is and values below zero measures bearish forces.Up arrow appears on bearish market when it's ready to reverse, dn arrow appears on weak bullish market, as a result of reverse expectation.
これはほぼ間違いなく、MetaTraderプラットフォームで見つけることができる最も完全な調和価格形成自動認識インジケーターです。 19種類のパターンを検出し、フィボナッチプロジェクションをあなたと同じように真剣に受け止め、潜在的逆転ゾーン(PRZ)を表示し、適切なストップロスとテイクプロフィットレベルを見つけます。 [ インストールガイド | 更新ガイド | トラブルシューティング | よくある質問 | すべての製品 ] 19の異なる調和価格形成を検出します プライマリ、派生および補完フィボナッチ投影(PRZ)をプロットします 過去の価格行動を評価し、過去のすべてのパターンを表示します この指標は、独自の品質とパフォーマンスを分析します 適切なストップロスとテイクプロフィットのレベルを表示します ブレイクアウトを使用して適切な取引を通知します すべてのパターン比をグラフにプロットします 電子メール/音声/視覚アラートを実装します スコット・M・カーニーの本に着想を得て、この指標は最も純粋で急を要するトレーダーのニーズを満たすように設計されています。ただし、トレードを容易にする
Before installing the HeatMap indicator make sure you are using a broker that gives you access to the Depth of market (DOM) !! This indicator creates a heatmap on your chart allowing you to see the buy or sell limit orders easily and in real time. You have the possibility to change the setting and the colors of the HeatMap in order to adapt to all markets and all charts. Here is an example of a setting you can use with the NASDAQ100 on the AMPGlobal broker :  https://www.youtube.com/watch?v=x0Y
Market profile was developed by Peter Steidlmayer in the second half of last century. This is a very effective tool if you understand the nature and usage. It's not like common tools like EMA, RSI, MACD or Bollinger Bands. It operates independently of price, not based on price but its core is volume. The volume is normal, as the instrument is sung everywhere. But the special thing here is that the Market Profile represents the volume at each price level. 1. Price Histogram The Price Histogram i
Description: The Volume Profile displays detailed informations of historical trading activities at certain price levels (Market Profile). Locate the areas with the best prices in the market and get an advantage over other market participants. Features: Customizable Market Profile Shows the "fair" Value Area with 70% of all Volume Shows critical low volume zones Shows VPOC, VAL and VAH Points integrated resource management to reduce the load while working with multiple charts Works on all timefr
This indicator allows you to enjoy the two most popular products for analyzing request volumes and market deals at a favorable price: Actual Depth of Market Chart Actual Tick Footprint Volume Chart This product combines the power of both indicators and is provided as a single file. The functionality of Actual COMBO Depth of Market AND Tick Volume Chart is fully identical to the original indicators. You will enjoy the power of these two products combined into the single super-indicator! Below is
The Penta-O is a 6-point retracement harmonacci pattern which usually precedes big market movements. Penta-O patterns can expand and repaint quite a bit. To make things easier this indicator implements a twist: it waits for a donchian breakout in the right direction before signaling the trade. The end result is an otherwise repainting indicator with a very reliable trading signal. The donchian breakout period is entered as an input. [ Installation Guide | Update Guide | Troubleshooting | FAQ | A
Trading Utility for Forex Currency Pairs Only not for Gold  Functions Auto Lot Calculation based on Risk Auto stoploss  Auto TakeProfit Breakeven Auto Close Half % Close in percentage with respect to the PIPs Pending Orders BuyLimit Sell Limit with distances BuyStop Sell Stop    with distances Trading Informations Risk in percentage For Multiple trades Combine Takeprofit and Combine Stoplosses
新しい統合インジケーター - 3つの機能が1つに 市場分析と投資戦略を向上させるための取引ツールをお探しですか?私たちは、最も優れたインジケーター3つを1つの強力で便利なソリューションに組み合わせ、取引において最高の価値を提供します。 1. オーダーブロックインジケーター (以前は32.90$で販売) オーダーブロックインジケーターは、市場における重要な機関投資家の関心エリアを特定するための基本的なツールです。このインジケーターは、価格の反転やトレンドの継続が発生する可能性のあるキーゾーンを表すオーダーブロックキャンドルの高値と安値を示します。単独で使用する場合、オーダーブロックインジケーターは、潜在的なサポートとレジスタンスゾーンを特定し、取引の意思決定を向上させます。 リンク: https://www.mql5.com/it/market/product/121633?source=Site+Market+MT5+Search+Rating006%3aorderblock+indicator 2. FVGインジケーター (以前は34.90$で販売) FVGインジケーターは、公正価値
DYJ BoS インジケーターは、次のような市場構造の変化の主な要素を自動的に識別してマークします。 構造のブレイクアウト (BoS): 価格が大きく変動し、構造の前のポイントを突破したときに発生します。 彼は上昇トレンドと下降トレンドの可能性のあるライン(UP と DN、つまり連続した新高値と新安値)をマークし、価格がこれらのラインを突破すると、赤(弱気)と緑(強気)の矢印でマークします。 BoS は通常、価格が以前の価格変動によって確立されたスイング安値または高値を決定的に突破したときに発生します。価格がスイング高値を上回ったりスイング安値を下回ったりすると、単に以前に形成された市場構造から抜け出すだけなので、「ブレイクアウト」構造と呼ばれます。これは多くの場合、市場センチメントとトレンドの方向の変化を示し、既存のトレンドの継続または新しいトレンドの始まりを示唆します。 ポジションのクローズの精度を高めるために、通常はストップロスとテイクプロフィットを設定しないことが推奨されます。最終ポジションは通常、同じ方向の次のブレイクスルー ポイント、または反対方向のブレイクスルー
This is a multi-symbol and multi-timeframe table-based indicator designed for a candlestick patterns detection with 46 patterns for META TRADER 5. Each formation has own image for easier recognition. Here you find most popular formations such as "Engulfing", "Hammer", "Three Line Strike", "Piercing" or Doji - like candles. Check my full list of patterns on my screenshots below. Also you can not only switch all bearish or bullish patterns from input, but also select formation for a specified symb
MT4版  |  FAQ Owl Smart Levels Indicator は、 Bill Williams の高度なフラクタル、市場の正しい波構造を構築する Valable ZigZag、エントリの正確なレベルをマークする Fibonacci レベルなどの一般的な市場分析ツールを含む 1 つのインジケーター内の完全な取引システムです。 利益を得るために市場と場所に。 戦略の詳細な説明 インジケータを操作するための指示 顧問-取引助手 プライベートユーザーチャット ->購入後に私に書いて、私はプライベートチャットにあなたを追加し、あなたはそこにすべてのボーナスをダウンロードすることができます 力はシンプルさにあります! Owl Smart Levels 取引システムは非常に使いやすいので、専門家にも、市場を勉強し始めて自分で取引戦略を選択し始めたばかりの人にも適しています。 戦略と指標に秘密の数式や計算方法が隠されているわけではなく、すべての戦略指標は公開されています。 Owl Smart Levels を使用すると、取引を開始するためのシグナルをすばやく確認し、注文を出すための
Crash 1000 Scalping Indicator for the Crash 1000 Deriv Synthetic Index. Introduction The Crash 1000 Scalping Indicator is a specialized tool designed for the Crash 1000 index on the Deriv Synthetic market. This indicator is particularly useful for scalping on the M1 timeframe, helping traders to identify precise entry and exit points for buy positions. It is designed to be non-repainting, providing clear signals with audible alerts and push notifications, and is compatible with mobile devices th
Your Trend Friend
Luigi Nunes Labigalini
5 (1)
The trend is your friend! Look at the color of the indicator and trade on that direction. It does not  repaint. After each candle is closed, that's the color of the trend. You can focus on shorter faster trends or major trends, just test what's most suitable for the symbol and timeframe you trade. Simply change the "Length" parameter and the indicator will automatically adapt. You can also change the color, thickness and style of the lines. Download and give it a try! There are big movements w
Introducing PivotWave – your ultimate trading companion that redefines precision and market analysis. Designed with traders in mind, PivotWave is more than just an indicator; it’s a powerful tool that captures the pulse of the market, identifying key turning points and trends with pinpoint accuracy. PivotWave leverages advanced algorithms to provide clear visual signals for optimal entry and exit points, making it easier for traders to navigate volatile market conditions. Whether you are a begin
Basic Support and Resistance   インジケータは、テクニカル分析を強化するために必要なソリューションです。このインジケータを使用すると、チャートにサポートレベルとレジスタンスレベルを投影できます/ mt4バージョン 機能 フィボナッチレベルの統合: サポートと抵抗レベルとともにフィボナッチレベルを表示するオプションを使用すると、私たちの指標は市場行動と逆転領域の可能性についてさらに深い洞察を提供します。 パフォーマンスの最適化: 各バーの開口部のみで拡張ラインを更新するオプションを使用すると、インジケータは、サポートレベルと抵抗レベルの精度を犠牲にすることなく最適なパフォーマンスを保証します。 入力 メイン設定 Timeframe:  この入力を通じて、より高い時間枠のサポートラインとレジスタンスラインをチャート上に表示することを選択できます。 Support/Resistance Strength [Number of Bars]:   この入力を使用して、サポートと抵抗の強度を決定できます。数が高いほど、サポート/抵抗がより強くなります。 Pric
数列の一つに「森林火災数列」があります。これは、最も美しい新しいシーケンスの 1 つとして認識されています。その主な特徴は、このシーケンスが線形トレンドを回避することです。最短のものであってもです。この指標の基礎を形成したのはこのプロパティです。 財務時系列を分析する場合、この指標は可能なすべての傾向オプションを拒否しようとします。そして失敗した場合にのみ、トレンドの存在を認識し、適切なシグナルを発します。このアプローチにより、新しいトレンドの始まりの瞬間を正しく判断できます。ただし、偽陽性の可能性もあります。それらの数を減らすために、このインジケーターに追加のフィルターが追加されました。新しいバーが開くとシグナルが生成されます。いずれの場合も再描画は発生しません。 指標パラメータ: Applied Price   - 適用価格定数; Period Main   - インディケータのメイン期間、その有効な値は 5 ~ 60 です。 Period Additional   - 追加の期間。このパラメーターの有効な値は 5 ~ 40 です。 Signal Filter   - 追加の信号
Cumulative delta indicator As most traders believe, the price moves under the pressure of market buying or selling. When someone redeems an offer standing in the cup, the deal is a "buy". If someone pours into the bid standing in the cup - the deal goes with the direction of "sale". The delta is the difference between purchases and sales. A cumulative delta - the difference between the cumulative sum of purchases and sales for a certain period of time. It allows you to see who is currently contr
Visual Bronze Path Indicator
AL MOOSAWI ABDULLAH JAFFER BAQER
Bronze Path Indicator The Bronze Path Indicator is a powerful yet customizable trading tool designed to help traders identify potential market opportunities using advanced technical analysis. This indicator provides a clear visual representation of buy and sell signals, ensuring traders can make informed decisions based on market conditions. Please note that this indicator is not optimized; it is created for you to fine-tune and optimize it according to your trading strategy and preferences. Ho
Provided Trend is a complex signal formation indicator. As a result of the work of internal algorithms, you can see only three types of signals on your chart. The first is a buy signal, the second is a sell signal, and the third is a market exit signal. Options: CalcFlatSlow - The first parameter that controls the main function of splitting the price chart into waves. CalcFlatFast - The second parameter that controls the main function of splitting the price chart into waves. CalcFlatAvg - Para
This Indicator enhances the default Relative Strength Index (RSI) by introducing several improvements. First, it visually highlights overbought and oversold regions by changing the RSI color from white to red. Second, it includes additional reference lines at 20, 40, 50, 60, and 80, providing a clearer framework for assessing RSI values. The most notable feature is the use of the middle 50-line to indicate the current market cycle. The color of the 50-line dynamically reflects the cycle: green f
このプロダクトを購入した人は以下も購入しています
MonetTrend — Премиум-индикатор для торговли по тренду (M30, H1, H4) MonetTrend — это мощный и визуально понятный трендовый индикатор, созданный для торговли на таймфреймах M30, H1 и H4. Он идеально подходит для работы с волатильными инструментами, такими как: • Золото (XAUUSD) • Криптовалюты (BTCUSD) • Валютные пары (EURUSD, USDJPY и др.) Ключевые особенности MonetTrend: • Автоматическое отображение Take Profit 1 (TP1) и Stop Loss (SL): После появления сигнала индикатор сразу показывает: • TP
反転ゾーン / ピークボリューム / 主要プレーヤーのアクティブゾーン =       TS TPSプロシステム 説明書 RUS       /       説明書     英語     /           バージョン MT4        このインジケーターを購入したすべての購入者は、さらに以下を無料で受け取ります: RFI SIGNALS サービスからの取引シグナルへの 6 か月間のアクセス - TPSproSYSTEM アルゴリズムに従った既製のエントリ ポイント。 定期的に更新されるトレーニング資料 - 戦略に没頭し、プロフェッショナル レベルを高めます。 平日は 24 時間 365 日サポート、非公開のトレーダー チャットへのアクセス - コミュニケーション、サポート、市場状況の分析。 著者の設定ファイル - 余分な労力をかけずに最大の結果を達成するための自動インジケーター設定。 主な機能: 売り手と買い手のアクティブなゾーンを表示します。 このインジケーターは、購入と販売の正しい最初のインパルス レベル/ゾーンをすべて表示します。これらのレベル/ゾーンがアクティブに
NOTE: CYCLEMAESTRO is distributed only on this website, there are no other distributors. Demo version is for reference only and is not supported. Full versione is perfectly functional and it is supported. CYCLEMAESTRO , the first and only indicator of Cyclic Analysis, useful for giving signals of TRADING, BUY, SELL, STOP LOSS, ADDING. Created on the logic of   Serghei Istrati   and programmed by   Stefano Frisetti ;   CYCLEMAESTRO   is not an indicator like the others, the challenge was to inter
Viking_Strategy_Signal Indicator is a solution I offer to beginner, amateur, and professional traders. My scalping robot :  https://www.mql5.com/fr/market/product/133191 By purchasing this indicator, you will first save time because it automatically analyzes the market based on Dow Theory and the Smart Money Concept (High (H), Low (L), Higher High (HH), Lower Low (LL), Break of Structure (BOS) to determine market structure and trend). It is built on my strategy, which relies on the NRTR theory t
今、147ドル(いくつかの更新後に499ドルに増加します) - 無制限のアカウント(PCSまたはMac) RelicusRoad ユーザー マニュアル + トレーニング ビデオ + プライベート Discord グループへのアクセス + VIP ステータス 市場の新しい見方 RelicusRoad は、外国為替、先物、暗号通貨、株式、および指数の世界で最も強力な取引インジケーターであり、トレーダーに収益を維持するために必要なすべての情報とツールを提供します。初心者から上級者まで、すべてのトレーダーが成功するためのテクニカル分析と取引計画を提供します。これは、将来の市場を予測するのに十分な情報を提供する重要な取引指標です。意味をなさないチャート上のいくつかの異なる指標ではなく、完全な解決策を信じています.これは、信号、矢印 + 価格アクション情報を表示するオールインワンのインジケーターで、他に類を見ない非常に正確です。 強力な AI に基づいて、RelicusRoad は不足している情報とツールを提供して、あなたを教育し、トレーディングのプロ、成功したトレーダーにします。 ほと
Triplet Cloud MTF is an indicator for trend-following strategy. It presents the trend in HTF from the LTF Chart that allows traders focus on looking for trade entry in the right direction and increase striking rate. It comes with simple input setup. You will only need to choose HTF you want to follow its trend and set the alert setup, then all is set. Here are the mostly selected HTF setup for each of entry timeframe: M1 Entry   : M15 Trend M5 Entry   : H1 Trend M15 Entry   : H4 Trend H1 Entry  
トレンドを見極め、パターンを読み、エントリーポイントを選択しましょう。 30秒で3ステップ!分析不要で取引が可能 — スマートアシスタントがあなたの作業を簡素化します。 複雑なチャートはもう必要ありません。 スマートなトレンド識別で自信を持って取引。 あらゆる通貨、暗号通貨、株式、金属、指数、タイムフレームに対応。 クリックして実行するだけ — 非常に簡単です。 迅速さと明確さを求める忙しいトレーダーに最適。 TPTSyncXは、MetaTrader 5用の強力なオールインワンインジケーターで、 トレンド、パターン 、 ローソク足シグナル をシームレスに同期し、クリーンでスマートなビジュアルシステムを提供します。明確さ、精度、スピードを求めるトレーダーのために設計されており、価格アクション、構造パターン、タイミングツールの組み合わせを使用して、高確率の取引セットアップを特定するのに役立ちます。 主な特徴: スマートなビジュアル表示: 価格の構造パターンを自動的に描画し、高値高値(HH)、高値安値(HL)、安値高値(LH)、安値安値(LL)を明確にマークします。これにより、市場構造の
The AT Forex Indicator MT5 is a sophisticated trading tool designed to provide traders with a comprehensive analysis of multiple currency pairs. This powerful indicator simplifies the complex nature of the forex market, making it accessible for both novice and experienced traders. AT Forex Indicator uses advanced algorithms to detect trends, patterns and is an essential tool for traders aiming to enhance their forex trading performance. With its robust features, ease of use, and reliable signal
Pro Thunder V10: バイナリーオプション取引の究極のインジケーター! Pro Thunder V10 で取引を次のレベルへ引き上げましょう!最先端の ニューラルネットワークAI技術 に基づいたこの革新的なインジケーターは、比類のない精度と信頼性を提供するよう設計されています。リアルタイムの非リペイント信号から、変動する市場条件でもシームレスなパフォーマンスまで、 Pro Thunder V10 はあなたの取引における究極のパートナーです。 主な特徴: 圧倒的な精度: 高精度の信号で市場を制覇。重要なニュースイベントを含むあらゆる市場状況で実証済み。 OTC対応: OlympTrade、Pocket Option、Quotex、Binomo、IQ Option などのプラットフォームで完璧に動作。 MT5専用: 最も先進的な取引プラットフォームである MetaTrader 5 のために特別に設計されています。 パフォーマンスダッシュボード: 勝敗や信号を直感的に追跡できる使いやすい画面。 永久アクセス: 一度の購入で、すべてのアップデートに生涯アク
CBT Quantum Maverick 高効率バイナリーオプション取引システム CBT Quantum Maverickは、高いパフォーマンスとシンプルさを追求するトレーダー向けに設計されたバイナリーオプション取引システムです。カスタマイズの必要がなく、最適化された状態で使用を開始できます。シグナルに従うだけで、少しの練習でマスターできます。 主な特徴: シグナルの精度: 現在のローソク足を基に次のローソク足の取引シグナルを生成し、頻繁な再描画がありません。 多様な市場対応: バイナリーオプション取引に特化し、さまざまなブローカーや資産クラスに対応しています。 対応可能: Deriv Synthetic Charts :すべてのタイムフレームで使用可能。 OTCチャート :Quotex、PocketOption、Binomo、Stockity、IQOption、Exnova、OlympTrade、Deriv、Binolla、Homebrokerなどのブローカーに対応。MT5へのインポートは最初の1週間無料、その後は有料サービス。 FX、仮想通貨、商品市場 :幅広い資産利用が可能
Elliott Wave Trend was designed for the scientific wave counting. This tool focuses to get rid of the vagueness of the classic Elliott Wave Counting using the guideline from the template and pattern approach. In doing so, firstly Elliott Wave Trend offers the template for your wave counting. Secondly, it offers Wave Structural Score to assist to identify accurate wave formation. It offers both impulse wave Structural Score and corrective wave Structure Score. Structural Score is the rating to sh
Berma Bands
Muhammad Elbermawi
5 (3)
Berma Bands (BBs) インジケーターは、市場のトレンドを特定して活用したいトレーダーにとって貴重なツールです。価格と BBs の関係を分析することで、トレーダーは市場がトレンド段階にあるか、レンジ段階にあるかを判断できます。 詳細については、[ Berma Home Blog ] をご覧ください。 バーマ バンドは、上部バーマ バンド、中部バーマ バンド、下部バーマ バンドの 3 つの異なる線で構成されています。これらの線は価格の周りにプロットされ、全体的な傾向に対する価格の動きを視覚的に表します。これらのバンド間の距離から、ボラティリティや潜在的な傾向の反転についての洞察を得ることができます。 バーマ バンドの線がそれぞれ離れると、市場が横ばいまたはレンジ相場の期間に入っていることを示すことがよくあります。これは、明確な方向性の偏りがないことを示しています。トレーダーは、これらの期間中にトレンドを特定するのが難しいと感じる可能性があり、より明確なトレンドが出現するまで待つ場合があります。 バーマ バンドの線が 1 本の線に収束すると、強いトレンド環境の兆候となること
IVISTscalp5
Vadym Zhukovskyi
5 (6)
iVISTscalp5インジケーターをご紹介します。このインジケーターは、トレーディングにおいて独自でありながら効果的です。時間データに基づくこのインジケーターは、多年にわたる経験と金融市場の深い分析の結果です。iVISTscalp5インジケーターは、手動トレーディングにとって優れたツールです。便利さ、簡単さ、可視化 - すべての複雑さが内部に隠されています。私たちは、iVISTscalp5インジケーターの設定と使用を最大限に簡素化しました。このインジケーターは、MT5ターミナルにあるすべての金融商品に適しています。 稼働時間は、4時から20時(UTC+3)です。 iVISTscalp5インジケーターメニュー(スクリーンショット1を参照): History - 引用を計算する週数 dT_min - 時間間隔の選択(分) TFline - 水平ボリュームの作成(時間枠) BARSline - 水平ボリュームの作成(バー数) TFtrend1 - デイリーチャンネルの作成(時間枠) BARStrend1 - デイリーチャンネルの作成(バー数) TFtrend2 - 週次チャンネルの作成(時
オンバランス・ボリューム(OBV)は、出来高と価格を関連付け、値動きを識別するテクニカル指標です。OBVの基本的な考え方は、出来高の変化は一般に価格の変化に先行するというものである。OBVは、価格が高値で引けた期間の出来高を累積し、安値で引けた期間の 出来高を減算する。こ の 結 果 、資 産 の ト レ ン ド の 方 向 を 示 す 数 値 が 得 ら れ る 。 OBVの解釈は簡単です。OBVの上昇は、買い手が市場に参入または留まろうとしていることを示唆し、上昇トレンドのシグナルとなります。一方、OBVが低下している場合は、売り手が優勢であることを示し、下降トレンドの可能性を示唆します。 現在、シグナルに最大3つの移動平均を使用することができ、取引判断プロセスを簡素化することができます。OBVがMAラインと交差していることと、その間の距離を観察するだけです。これがOBV-MAの目的です! OBV線がMA線と交差し、MA線とOBV線が大きく離れている場合、上昇トレンドまたは下降トレンドの強い兆候を示します。もう一つの良いトレンドシグナルは、すべての線(OBV線とMA線)が同
note: this indicator is for METATRADER4, if you want the version for METATRADER5 this is the link:  https://www.mql5.com/it/market/product/108106 TRENDMAESTRO ver 2.4 TRENDMAESTRO recognizes a new TREND in the bud, he never makes mistakes. The certainty of identifying a new TREND is priceless. DESCRIPTION TRENDMAESTRO identifies a new TREND in the bud, this indicator examines the volatility, volumes and momentum to identify the moment in which there is an explosion of one or more of these data a
Introduction to Fractal Pattern Scanner Fractal Indicator refers to the technical indicator that makes use of the fractal geometry found in the financial market. Fractal Pattern Scanner is the advanced Fractal Indicator that brings the latest trading technology after the extensive research and development work in the fractal geometry in the financial market. The most important feature in Fractal Pattern Scanner is the ability to measure the turning point probability as well as the trend probabil
IQ FX Gann Levels a precision trading indicator based on W.D. Gann’s square root methods. It plots real-time, non-repainting support and resistance levels to help traders confidently spot intraday and scalping opportunities with high accuracy. William Delbert Gann (W.D. Gann) was an exceptional market analyst, whose trading technique was based on a complex blend of mathematics, geometry, astrology, and ancient mathematics which proved to be extremely accurate. Download the Metatrader 4 Version M
MetaForecast M5
Vahidreza Heidar Gholami
5 (3)
MetaForecastは、価格データのハーモニクスに基づいて、どんな市場の未来を予測し視覚化します。市場が常に予測可能ではありませんが、価格にパターンがある場合、MetaForecastは可能な限り正確な未来を予測できます。他の類似製品と比較して、MetaForecastは市場のトレンドを分析することでより正確な結果を生成することができます。 入力パラメータ Past size (過去のサイズ) MetaForecastが将来の予測を生成するために使用するバーの数を指定します。モデルは選択したバー上に描かれた黄色の線で表されます。 Future size (将来のサイズ) 予測すべき将来のバーの数を指定します。予測された将来は、ピンクの線で表示され、その上に青い回帰線が描かれます。 Degree (程度) この入力は、MetaForecastが市場で行う分析のレベルを決定します。 Degree 説明  0 Degree 0の場合、価格の全てのピークや谷、そして詳細をカバーするために、「Past size」の入力に大きな値を使用することが推奨されています。  1 (推奨) Degre
The ChanLun or Chan theory is one of the most popular trading theories in China. But it seems like that it has little influence in western countries. Actually, the Chan Theory is based on a sophisticated mathematical model. The basic idea ChanLun is to simplify the bar chart by its model. With the help of ChanLun, a trader can analyze and predict the trend of future goods, stocks. In ChanLun, there are several basic elements called fractals, strokes, line segments and pivots . A trader should pa
IQ Gold Gann Levels a non-repainting, precision tool designed exclusively for XAUUSD/Gold intraday trading. It uses W.D. Gann’s square root method to plot real-time support and resistance levels, helping traders spot high-probability entries with confidence and clarity. William Delbert Gann (W.D. Gann) was an exceptional market analyst, whose trading technique was based on a complex blend of mathematics, geometry, astrology, and ancient mathematics which proved to be extremely accurate. Download
In the "Masters of Risk" trading system, one of the main concepts is related to places where markets change direction. In fact, this is a change in priority and a violation of the trend structure at the extremes of the market, where supposedly there are or would be stop-losses of "smart" participants who are outside the boundaries of the accumulation of volume. For this reason, we call them "Reversal Patterns" - places with a lot of weight for the start of a new and strong trend. Some of the imp
WHY IS OUR FXACCCURATE LS MT5 THE PROFITABLE ? PROTECT YOUR CAPITAL WITH RISK MANAGEMENT Gives entry, stop and target levels from time to time. It finds Trading opportunities by analyzing what the price is doing during established trends. POWERFUL INDICATOR FOR A RELIABLE STRATEGIES We have made these indicators with a lot of years of hard work. It is made at a very advanced level. Established trends provide dozens of trading opportunities, but most trend indicators completely ignore them! The
TPA True Price Action indicator reveals the true price action of the market makers through 100% non-repainting signals strictly at the close of a candle! TPA shows entries and re-entries, every time the bulls are definitely stronger than the bears and vice versa. Not to confuse with red/green candles. The shift of power gets confirmed at the earliest stage and is ONE exit strategy of several. There are available now two free parts of the TPA User Guide for our customers. The first "The Basics"
This indicator is based on the mathematics of the great trader W.D. Ganna. With its help, you can easily find strong levels by analyzing swings to find the optimal entry point. The indicator works on all instruments and all timeframes. The indicator is fully manual and has control buttons. All you need to do is press the NEW button, a segment will appear, which you can place on any movement, swing or even 1 candle that you want to analyze. By placing the segment, press the OK button. A grid (th
This indicator identifies and displays zones, as it were areas of strength, where the price will unfold. The indicator can work on any chart, any instrument, at any timeframe. The indicator has two modes. The indicator is equipped with a control panel with buttons for convenience and split into two modes. Manual mode: To work with manual mode, you need to press the NEW button, a segment will appear. This segment is stretched over the movement and the LVL button is pressed. The level is displayed
プレシジョン・インデックス・オシレーター(Pi-Osc)は、Precision Trading SystemsのRoger Medcalfによるものです。 バージョン2は、チャートにスーパーファストでロードされるように注意深く再コードされ、その他の技術的な改良も組み込まれて、エクスペリエンスを向上させています。 Pi-Oscは、市場が強制的に行かなければならない、すべての人のストップを取り除くためのポイントである、極限のエクソースト・ポイントを見つけるために設計された正確な取引タイミング信号を提供するために作成されました。 この製品は、極限のポイントがどこにあるかを知るという古代の問題を解決し、トレーダーの生活をはるかにシンプルにします。 これは、業界標準のオシレーターとは異なる強力な要素を持つ高度なコンセンサス・インジケーターです。 使用されている一部の機能には、需要指数、マネーフロー、RSI、スティリング、パターン認識、出来高分析、標準偏差の極値などがあり、異なる長さでこれらのバリエーションが多く含まれています。 初めて見ると、訓練されていない目には、他のオシレーター
Golden Spikes Detector
Batsirayi L Marango
3.25 (4)
Golden Spikes Detector This indicator is based on a strategy primarily for trading spikes on Boom and Crash Indices. It alerts on potential Buy and Sell entries. To trade spikes on the Deriv or Binary broker, only take Buy Boom and Sell Cash alerts. It was optimised to be loaded on 5-minute timeframe although multiple timeframe analysis is done in the background. Features ·             Desktop pop up and sound alerts on computer or laptop ·             Sends push notifications to mobile phone ·
The   Time_Price_SQ9_Degree   indicator is based on the 9 Gann square. Using this indicator, you can identify strong time and price zones. The indicator displays the levels as a degree value. The degrees can be set in the settings. After launching, the MENU button appears. If it is highlighted, it can be moved to any point on the graph, and after double-clicking on it, it stops being highlighted and menu buttons appear. To hide the menu, just double-click on the button, it will become highlight
TMA Channel is a price channel obtained through a special calculation method based on traditional TMA . The channel has upper, middle, and lower tracks . When the price approaches or exceeds the upper track, it is already in an overbought state, and attention should be paid to the situation of reversal and decline; When the price approaches or falls below the lower track, it is already in an oversold state, and attention should be paid to the situation of reversal and rise . The indicator will
Ultimate Forex Trading Indicator Elevate your trading with our multi-functional indicator packed with advanced features! Key Features: 1. Non-repainting indicator for accurate signals 2. Max activations for peace of mind 3. 7+ strategies integrated for diverse trading styles 4. 10 Indicators all in one for comprehensive analysis 5. Perfect for Day and Swing Trading strategies 6. Trend following, reversal, and scalping strategies built-in 7. Create your own Custom strategies 8. Prop firm ready t
作者のその他のプロダクト
Over 100,000 users on MT4 and MT5 Blahtech Candle Timer displays the remaining time before the current bar closes and a new bar forms. It can be used for time management Links [  Install  |  Update  |  Training  ] Feature Highlights The only candle timer on MT5 with no stutter and no lag S electable Location Tracks server time not local time Multiple colour Schemes Configurable Text Customisable alerts and messages Optimised to reduce CPU usage Input Parameters Text Location - Beside / Upper Le
FREE
Was: $299  Now: $149  Supply Demand uses previous price action to identify potential imbalances between buyers and sellers. The key is to identify the better odds zones, not just the untouched ones. Blahtech Supply Demand indicator delivers functionality previously unavailable on any trading platform. This 4-in-1 indicator not only highlights the higher probability zones using a multi-criteria strength engine, but also combines it with multi-timeframe trend analysis, previously confirmed swings
Over 100,000 users on MT4 and MT5 Blahtech Candle Timer displays the remaining time before the current bar closes and a new bar forms. It can be used for time management Links [  Install  |  Update  |  Training  ] Feature Highlights The only candle timer on MT4 with no stutter and no lag S electable Location Tracks server time not local time Multiple colour Schemes Configurable Text Customisable alerts and messages Optimised to reduce CPU usage Input Parameters Text Location   - Beside / Upper
FREE
Was: $299  Now: $149   Supply Demand uses previous price action to identify potential imbalances between buyers and sellers. The key is to identify the better odds zones, not just the untouched ones. Blahtech Supply Demand indicator delivers functionality previously unavailable on any trading platform. This 4-in-1 indicator not only highlights the higher probability zones using a multi-criteria strength engine, but also combines it with multi-timeframe trend analysis, previously confirmed swings
Was: $249  Now: $149   Market Profile defines a number of day types that can help the trader to determine market behaviour. A key feature is the Value Area, representing the range of price action where 70% of trading took place. Understanding the Value Area can give traders valuable insight into market direction and establish the higher odds trade. It is an excellent addition to any system you may be using. Blahtech Limited presents their Market Profile indicator for the MetaTrader community. In
Was: $69  Now: $49   Blahtech VWAP - Volume Weighted Average Price (VWAP) is the ratio of price to total volume. It provides an average price over a specified time interval.  Links [  Install  |  Update  |  Documentation   ] Feature Highlights Configurable VWAP Line Sessions, intervals, anchored or continuous Previous day settlement line Standard Deviation bands Alerts at bar close or real time Automatic Broker or Tick volumes Significantly reduced CPU usage Input Parameters Expert Advisor Mo
Blahtech VWAP
Blahtech Limited
5 (3)
Was: $69    Now: $49   Blahtech VWAP - Volume Weighted Average Price (VWAP) is the ratio of price to total volume. It provides an average price over a specified time interval.  Links [  Install  |  Update  |  Documentation   ] Feature Highlights Configurable VWAP Line Sessions, intervals, anchored or continuous Previous day settlement line Standard Deviation bands Alerts at bar close or real time Automatic Broker or Tick volumes Significantly reduced CPU usage Input Parameters Expert Advisor
Blahtech Fisher Transform indicator is an oscillator that displays overbought and oversold locations on the chart. The Fisher Transform algorithm transforms prices with any distribution shape into a normal distribution. The end result is a curve with sharp turning points that may help to identify bullish or bearish trends. Fisher Transform values exceeding 1.66 on the daily chart are considered to be good areas for reversal trades. Links [  Install  |  Update  |  Training   |  All Products  ] F
Was: $49    Now: $33   Blahtech Better Volume provides an enhanced version of the vertical volume bars. Each bar is compared to the previous 20 bars. Depending on its volume, range and volume density it will be assigned a state and colour. Low Volume – Minimum volume High Churn   – Significant volume with limited movement Climax Neutral –   High volume with unclear direction Climax Up   – High volume with bullish direction Climax Dn   – High volume with bearish direction Climax Churn – High vol
Blahtech Moving Average indicator is a multitimeframe version of the standard Moving Average indicator. It is also enhanced with customisable alerts, period breaks and other configuration options. The 50 day and 200 day moving averages are widely followed by investors and traders, with breaks above and below the MA lines considered to be signals of interest. Links [  Install  |  Update  |   Training   |   All Products  ] Feature Highlights Up to three timeframes Configurable calculation variabl
FREE
Was: $99  Now: $49  Blahtech Daily Range indicator displays the average daily range alongside the individual session ranges. Using the daily open price as a reference the indicator shows fixed range and dynamic range targets as lines on the charts. These lines clearly show when the average range has been exhausted. Daily and session ranges can be useful for confirming entries or setting targets and is an excellent odds enhancer for many trading systems. Links [  Documentation   |   Install  |  U
Was: $49    Now: $33   Blahtech Better Volume provides an enhanced version of the vertical volume bars. Each bar is compared to the previous 20 bars. Depending on its volume, range and volume density it will be assigned a state and colour. Low Volume – Minimum volume High Churn   – Significant volume with limited movement Climax Neutral –   High volume with unclear direction Climax Up   – High volume with bullish direction Climax Dn   – High volume with bearish direction Climax Churn – High vol
Was: $99    Now: $49   Blahtech Daily Range indicator displays the average daily range alongside the individual session ranges. Using the daily open price as a reference the indicator shows fixed range and dynamic range targets as lines on the charts. These lines clearly show when the average range has been exhausted. Daily and session ranges can be useful for confirming entries or setting targets and is an excellent odds enhancer for many trading systems. Links [  Documentation   |   Install  
Blahtech Fisher Transform indicator is an oscillator that displays overbought and oversold locations on the chart. The Fisher Transform algorithm transforms prices with any distribution shape into a normal distribution. The end result is a curve with sharp turning points that may help to identify bullish or bearish trends. Fisher Transform values exceeding 1.66 on the daily chart are considered to be good areas for reversal trades. Links [  Install  |  Update  |  Training   |  All Products  ] F
フィルタ:
Lamar Jackson
316
Lamar Jackson 2025.02.04 09:12 
 

N°1 Form the middle of trading, A+++++++++++++++++++

William Montero
67
William Montero 2024.09.14 18:01 
 

How should I format the computer, or if I change broker and I should install your MQL5 and not keep running out of activations?

CHARLES-ANTOINE LEVOY
75
CHARLES-ANTOINE LEVOY 2024.07.19 22:40 
 

ユーザーは評価に対して何もコメントを残しませんでした

Denis Sokolovsky
421
Denis Sokolovsky 2023.06.25 21:39 
 

thank you :)

RiaB
59
RiaB 2022.11.14 21:23 
 

This is a powerful tool for a serious intraday trader. It is highly customizable and full of unique features second to none on the market.

Sigurds Lallo
197
Sigurds Lallo 2022.09.19 18:09 
 

great tool. but is it possible to change inline profiles to the right side like inline Volumes? and is it possible to adjust Profile Text in a way that it always fits on the screen so you can always see the current price?

arruda.has
48
arruda.has 2022.02.15 11:21 
 

ユーザーは評価に対して何もコメントを残しませんでした

Jayme Galvao de Oliveira Junior
179
Jayme Galvao de Oliveira Junior 2021.03.25 20:12 
 

Great indicator, and reported performance issues were solved.

Matt Simpson
45
Matt Simpson 2020.09.04 04:48 
 

Solid indicator, solid programmer. I have been testing this alongside other platforms for MP (I use Reuters Xenith and considered the MP add-on and also trialled MotiveWave). But this is better for my needs as it includes user-configurable sessions, along with a lot of options to configure it further. It's much more friendly for FX trading than the others I have tested. And the visual backtesting mode is an excellent tool for educational purposes and (obviously) backtesting.

Hamid N
29
Hamid N 2019.04.09 05:33 
 

This is a great indicator for those who really want to trade professionally. Thanks to the developer of Blatech MP, recent updates from MP father, Jim Dalton, such as halfback lines are also included. Market profile is for serious people who want to become an expert trader. It sorts market data in a readable format so the seasoned trader can better decide which side of the market to take. I am sure the developer of the indicator has made a lot of hard work producing such a great all-in-one indicator which I believe worth much more than $135. Buy it and do hard work!

Trader X
354
Trader X 2018.11.10 01:10 
 

This is the best MP indicator for MT5..the money that I have made from this indicator easily makes up for the money invested to purchase! Must have for futures indicies traders!

pipie3
62
pipie3 2018.08.23 07:19 
 

best MP ever. backtest mode very helpful!

レビューに返信
バージョン 4.1 2024.07.02
- Keyboard - Fix Ctrl Click issue
バージョン 4.0 2024.04.09
- Keyboard - Fix Ctrl and Shift Click mappings on MT5
バージョン 3.9 2024.01.11
- Asian Session - Change default TK session to 01:30
- Add Initial Balance Size (IB Size) to Summary Panel
- Keyboard - Fix Ctrl and Shift Click mappings on MT5
バージョン 3.8 2022.02.07
- Highlight Open Above High and Open Above Low in the Summary panels
- Add option to display close price in the summary panels
- Fix Halfback colour parameter
- Add Preset file with colour scheme for dark backgrounds
バージョン 3.7 2021.05.18
Enhancements
- Add Overall Volume Show Value Areas parameter

Fixes
- Reduce number of calculations when snap to grid is enabled
- Improve auto TPO size for futures contracts with single digit quotes
バージョン 3.6 2021.05.10
Fixes:
- Hotkeys - Keep Hotkey panel hidden when switching timeframes
バージョン 3.5 2021.05.05
Enhancements
- Profiles - Add parameter "Clear Hotkeys On Terminal Close" to improve profile switching on MT5
- Offline Charts - Add support for offline charts and backtest tools with missing market data and unsynced current time

Fixes
- Mouse Events - Keep CHART_EVENT_MOUSE_MOVE enabled if other indicators are waiting on mouse events
バージョン 3.4 2021.04.20
Enhancements
- MT5 - Add support for extended timeframes

Performance
- Clear Hotkey - Improve performance of clear chart calls
- Recalc Triggers - TpoTolerance - Ensure consistency across snapped to grid and unsnapped profiles
バージョン 3.3 2021.04.08
Enhancements
- Snap To Grid - Add option to map TPO to a fixed price grid rather than TPO stacked from lowest price (Dalton)
- Snap to Grid - Add parameter to offset all the TPO prices (TPO Size factor)
- Snap to Grid - Add button to Hotkey Panel
- Line Extensions - Add button to Hotkey panel

Fixes
- Max TPO Rows - Change default from 300 => 150
- Demo Modes - Add Snap To Grid and Line Extensions to demo modes
- Demo Modes - Improve handling of user set parameters in the strategy tester

Performance
- Hotkeys - Reduce redraw time when hotkeys pressed (especially with large numbers of profiles)
- Real time - Reduce number of calculations when TPO Tolerance parameter is set
- Real time - Reduce number of calculations when Snap To Grid is enabled
バージョン 3.2 2021.03.04
Enhancements
- Summary Panel - Highlight increased Tpo Size when Max Tpo Rows limit is breached
- Parameters - Write simple list of changed parameters to experts log when Ctrl+Q keys are pressed
- Parameters - Create detailed report of changed parameters in Files/Blahtech directory to assist users and support

Fixes
- Tpo Size - Improve automatic calculation for assets with one digit prices
- Tpo Size - Improve recalulation of Tpo Size when Max Tpo Rows limit is breached
- Max Tpo Rows - Change default from 500 => 300
- Expert Advisor Mode - Change to a single option named "Reserved For iCustom Calls"
バージョン 3.1 2021.01.20
Enhancements
- Volume Text - Add parameters to set colour and size of chart volume text
- Inline Charts - Add "Volume Separate" and "Volume Opposing" graphics chart options
- Inline TPO Charts - Decouple "Inline Charts" from "Inline TPO" so both can be on the chart concurrently
- Profile Line Titles - Add parameter to allow user to set custom text for the chart profile titles
- Chart Zones - Add parameter "Ranges - Draw To End Time" to extend drawing of session zone boxes to the next candle (Default false)
- Profile text - Add parameter "Profile Text Show Previous" to control display of previous profile text on left of chart
- Prices - Add parameter "Profile Lines Prices Only Show Final" to clean up display by only showing prices for last profile
- Intervals - Add "Decades" to the intervals to enable creation of longer term profiles (also add five year preset file)

Fixes
- Summary Panel - Improve text scaling and layout of Summary Panels
- Summary Text Size - Change default text size from 7 to 8 for clarity on 27 inch 1440p monitors
- Expanded letter TPO - Draw Sunday letters correctly on Sunday candles (Mn Of Qu preset)
- Profile Text - Fix font scaling on right hand profile text
バージョン 2.9 2019.08.01
Enhancements
- Add option to display Interval + Session for profile titles
- Add IntervalMultipler to support more advanced schedules

Fixes
- Clear candles from the chart when Style is set to Letters
バージョン 2.8 2019.06.19
Enhancements
- Add parameter to configure Calculator Max Tpo Rows
- Add option to display Halfback profile lines on the chart
- Left clicking any description in the Hud Panel now resets the value back to its input parameter version

Fixes
- Fix custom schedules for Overall Volume
- Do not override user set TPO sizes when cycing through presets
- Change defaults to display more features on chart at startup
- Remove extended profile lines from Days Of weeks preset
- PocLine PocArea - Reformat and swap display values round so MaxTpoWidth comes before TotalTpo
バージョン 2.7 2018.05.23
Fixes
- Remember Chart Clear setting on terminal restart
- Use TPO Size as the default when Vol TPO Size is 0.0
- Set Chart Joins to Hidden for demo modes
バージョン 2.5 2017.08.29
Enhancements
- Add option to set number of bars for initial balance and/or rotation rule
- Add option to set hourly intervals for profiles on the lowest timeframes
- Add option to display the prices for the profile lines
- Add option to display Naked POC extension profile lines
- Add option to display volume text alongside the TPO rows
- Add option to configure the Open and Close letters within the profile text
- Remember hotkey states when restarting terminal
- Support iCustom calls with 64+ parameters by using a set file

Fixes/Changes
- Only highlight rotation rule when it closes within the configured bars
- Add tooltips to summary panel rows
- Add reserved keys parameter to prevent clashes with other products
バージョン 2.4 2017.07.21
- Rebuilt with MetaEditor 1629 compiler to support MetaTrader cloud
- Added tooltips to Hotkey display
バージョン 2.3 2017.04.06
Enhancements
- Support individual start letters for each schedule
- Support simple statistics in profile titles

Fixes
- Fixed the order that inline charts are displayed when shift-"n" key is used
- Clear Charts - Forced redraw rather than waiting for next tick
- Rebuilt with latest compiler for MetaTrader platform changes
バージョン 2.2 2017.03.09
New features
- Added inline charts with TPO letters and expanded TPO letters

Enhancements
- Added the option to clear candles from the chart
- Added the option to exclude weekend schedules
- Allows a user to choose schedules for multi session display
= Inline charts
- Added "Profile and Volume Separate" and "Profile and Volume Opposing"
- Added the option to display charts as bars
- Allows a user to adjust font sizes and spaces of inline letters
= Presets
- Added "TPOs" demo mode
- Added the "Futures Of Days" profile (AMP Futures setup)
= Summary Panel:
- Option to hide the panel
- Allows a user to configure row contents
= Hotkey panel:
- Added the button for auto/fixed price scale
- Added the button for broker/tick volumes
- Added the buttons for adjusting TPO letter font sizes/spaces
- Reverse order of hotkey changes when the Shift key is pressed
- Support multi region keyboard layouts

Fixes
- Improved default TPO tick sizes
- Changed HK session to start at midnight
- Improved scaling of panels when font sizes are changed
- Changed timeframe enums, so MT5 version can share set files with MT4 version
- Support 8-digit instruments in summary panel

Performance
- Backtest - only redraw older schedules when the day changes
- Optimized the code that gets executed each tick

New Hotkeys
- "`" - chart candles - show/clear
- "7" - inline TPOs - graphics/TPOs/expanded TPOs
- "e" - inline TPOs - adjust a font size

Parameters
- See the parameters documentation for details - http://www.blahtech.co.uk/marketprofile