Jonux Orderflow V MT5
- インディケータ
-
Dennis John
 Dennis John - Founder of JONUX Systems | Precision Engineering for the Modern Trader
Welcome to my official MQL5 profile. - バージョン: 1.30
- アップデート済み: 15 5月 2026
- アクティベーション: 10
JONUX Orderflow-V — Vector Pressure Analysis for MT5
Stop Trading Fake Volume. Start Tracking Institutional Vector Pressure.
The Problem in Decentralized Markets 95% of retail Forex traders fail because they rely on standard volume indicators. In the decentralized FX market, there is no central order book. Standard tools merely count useless price ticks (the frequency of price updates). They give you a false illusion of volume, causing you to buy into fake breakouts and structural traps because you are blind to the actual market force.
The JONUX Solution JONUX Orderflow-V discards tick-counting and utilizes an advanced quantitative model. Our Vector Pressure Engine mathematically reconstructs true market dynamics by analyzing the exact relationship between price displacement, candle geometry, and wick rejection. It reveals the actual institutional footprint and directional force behind every single candle.
Your Execution Edge (Core Benefits)
-
Identify Hidden Absorption: Our Wick Analysis algorithm detects when retail liquidity is being absorbed by larger players, preventing you from entering trades at the point of exhaustion.
-
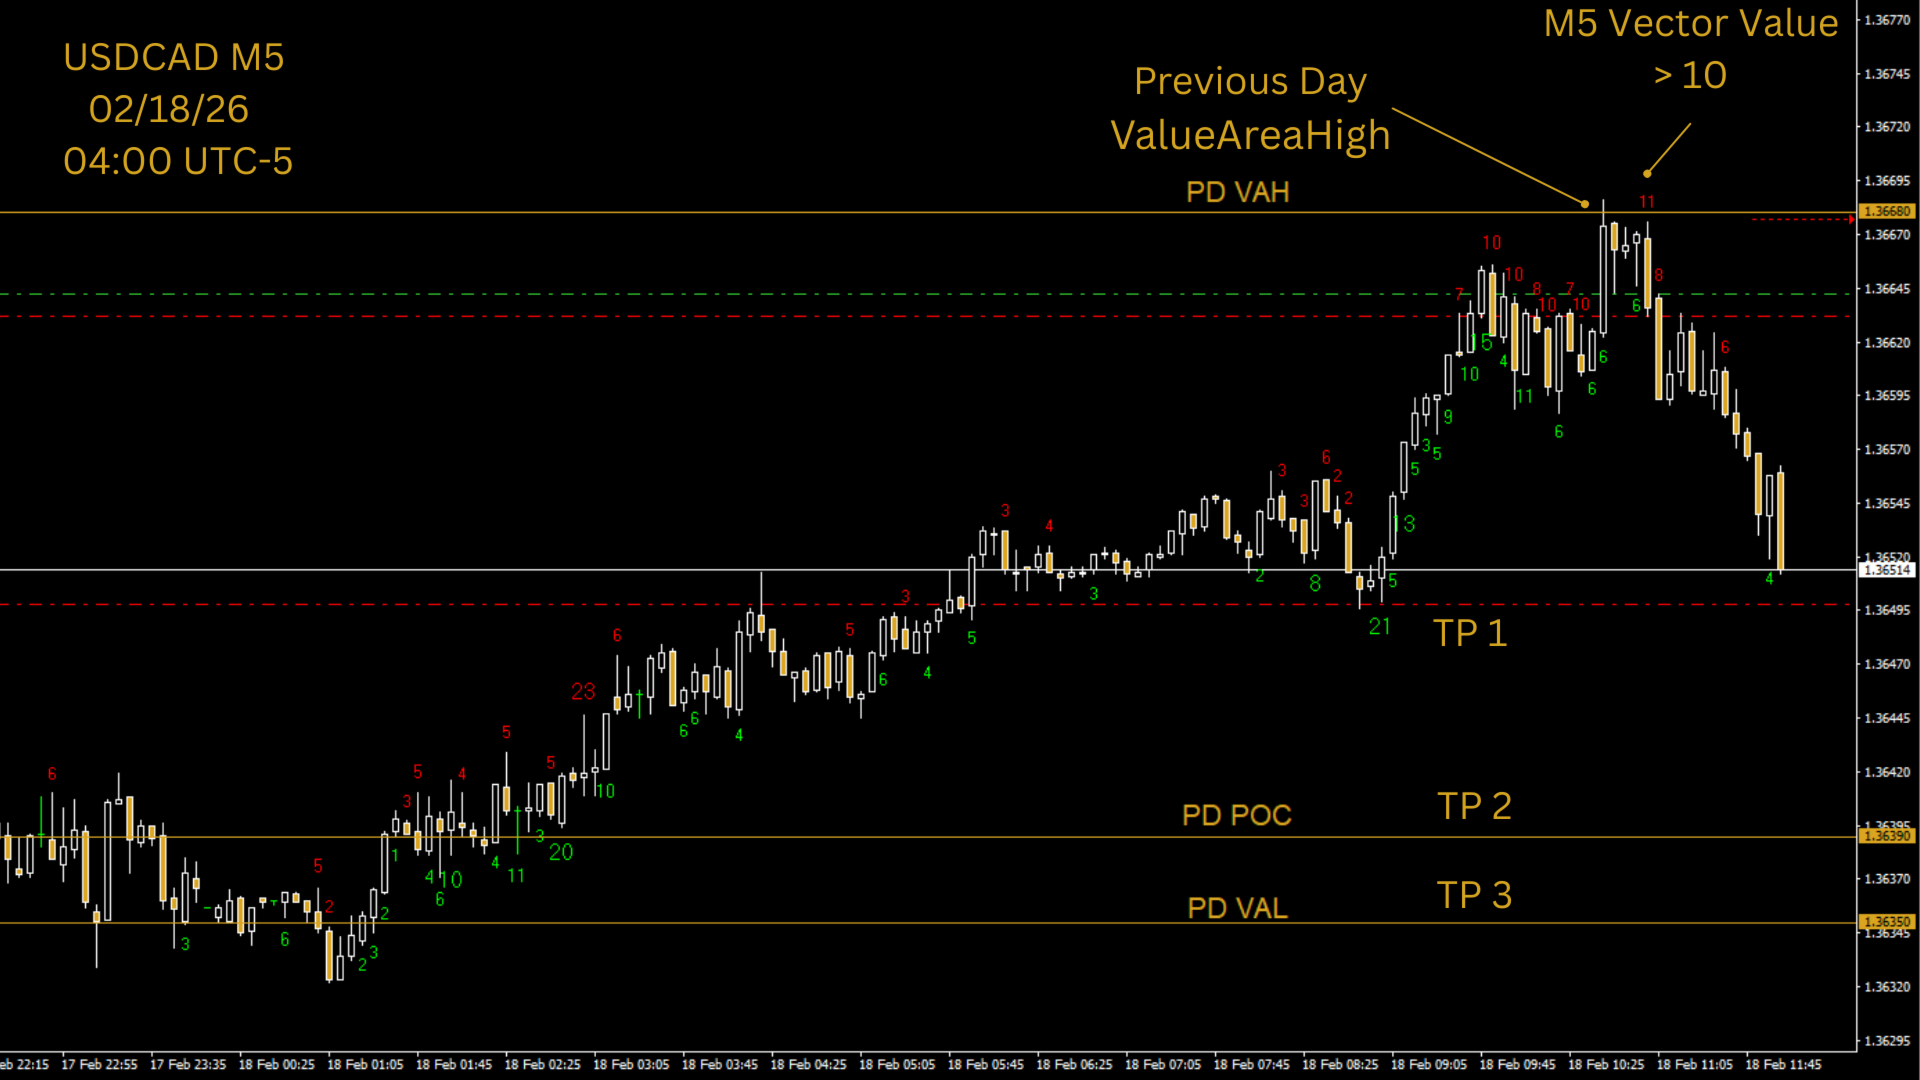
Filter Fake Breakouts: Stop guessing if a breakout is real. Orderflow-V assigns a definitive numeric "Vector Value" to each move. If a structural break lacks positive vector pressure, you fade it.
-
Time Your Entries: Use the indicator as the ultimate confirmation filter. Wait for price to reach your TPO, Supply/Demand, or Support/Resistance zones, and pull the trigger only when the Vector Engine confirms the shift in momentum.
Technical Features
-
Real-Time Data Panel: A clean, non-intrusive on-chart dashboard displaying the current momentum state (Neutral, Bullish, Bearish).
-
Dynamic Visual Sizing: Vector values scale automatically based on calculated intensity, giving you immediate visual clarity without chart clutter.
-
Non-Repainting Precision: Values are permanently fixed upon candle close. What you see is what you get.
-
Fully Customizable: Tailor colors, positioning, and sensitivity thresholds to match your personal "Dark Mode" trading environment.
Note on Strategy Tester The demo version is limited to the Strategy Tester. To evaluate the tool, use the MT5 Strategy Tester in "Visual Mode".
Disclaimer Trading Forex and CFDs involves a high level of risk. JONUX Orderflow-V is a technical tool for informational purposes and does not provide financial advice or guarantees of profit. The user is responsible for all trading risks.