Indicator Combine Merge MT5 by RunwiseFX
- インディケータ
- バージョン: 6.90
- アップデート済み: 23 5月 2024
- アクティベーション: 5

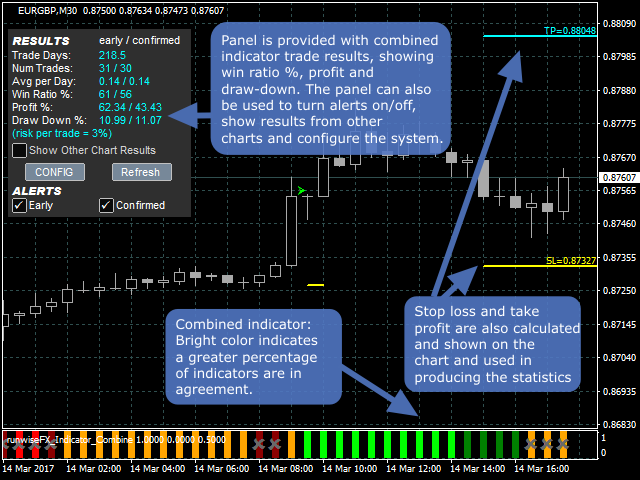
Allows multiple indicators to be combined into a single indicator, both visually and in terms of an alert. Indicators can include standard indicators, e.g. RSI, CCI, etc., and also Custom Indicators, even those purchased through Market, or where just have the ex4 file. An early alert is provided, say when 4 out 5 indicators have lined up, and a confirmed alert when all are in agreement.
Also features a statistics panel reporting the success of the combined indicator by examining the current chart. The win rate, profit and draw down are calculated, based on a selected stop loss and take profit/exit regime. Results from other charts can also be shown together and ordered with the best performing symbols shown first - allowing cherry picking of best symbols/timeframes.
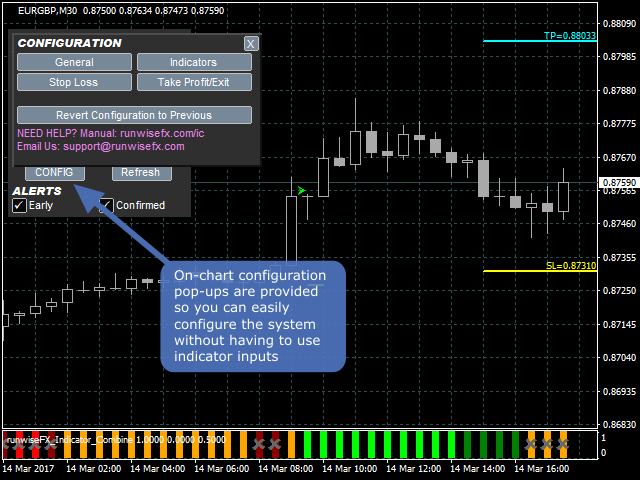
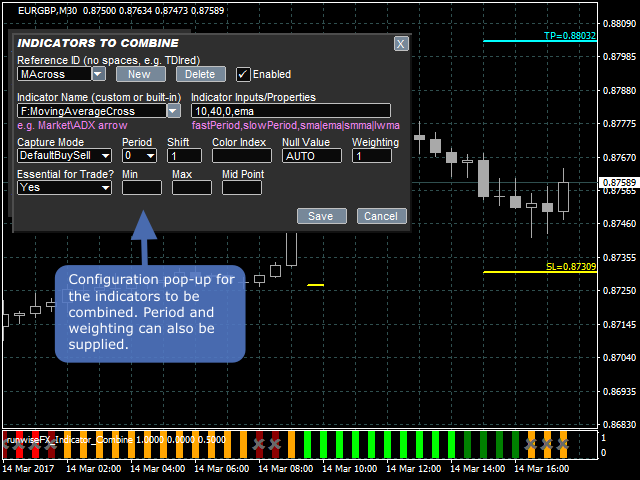
The product is easily configured using pop-up forms – see video. The product comes configured with example standard indicators.
Fully compatible with our range of EA panels, allowing easy conversion into an EA that can trade automatically.
Please see Comments tab (first entry) for link to the manual.
Features
- Combines multiple indicators both visually and in terms of an alert
- Works with standard indicators and Custom Indicators, even if just have ex4 file or those purchased from market
- Indicators are examined on candle close, by default, so no repainting
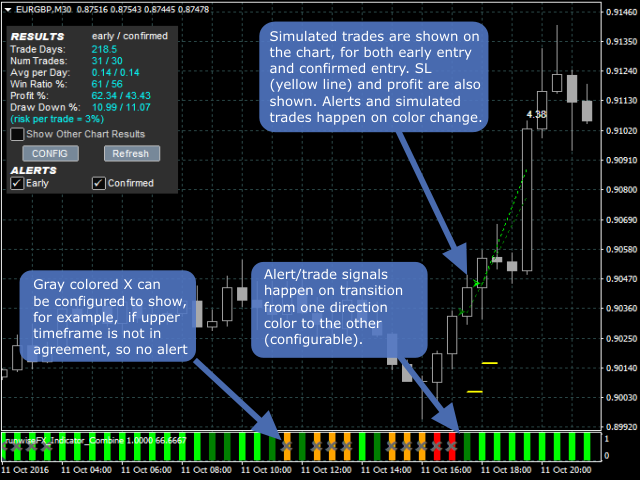
- Choice of two configurable alert levels - early (say when 75% of indicators lined-up) and confirmed (all lined-up)
- Shows trade result statistics of combined indicators with win ratio, profit and draw down - calculated in real-time by examining the current chart
- Option to show table of statistics from other charts/symbols that the indicator is loaded on to - ordered by profit
- Results show outcome of both early and confirmed alert, so can see which is performing best
- Option to automatically select early or confirmed alert, depending on which has the higher profit, or win ratio
- Realistic calculation of statistics by taking into consideration a selected stop loss, take profit/exit regime and spread
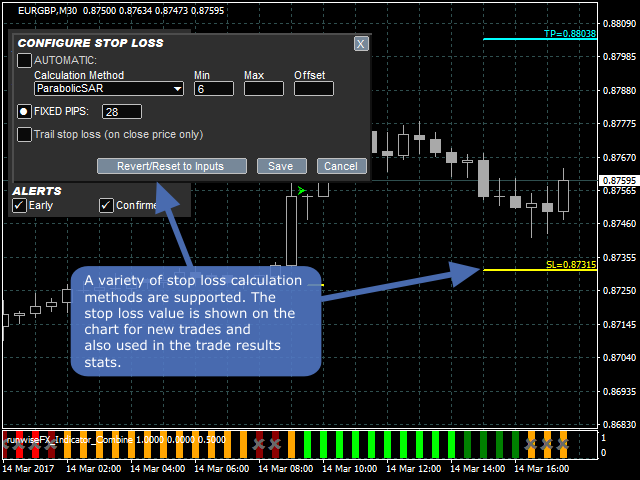
- Stop loss can be specified either as fixed pips or using a variety of automatic calculation methods, including from a custom indicator
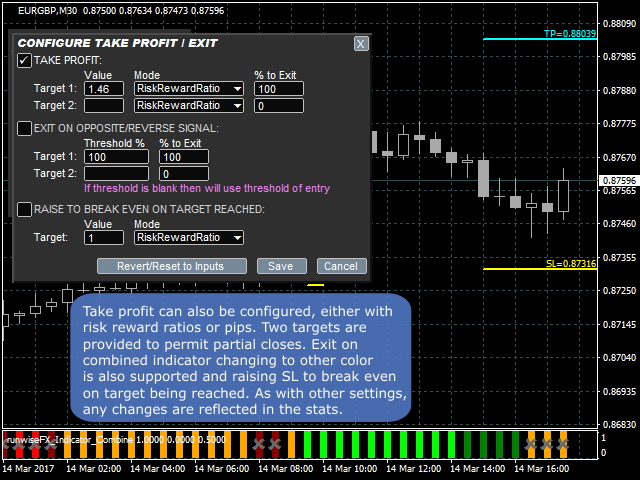
- Statistics can also include effect of trading hours, partial take profit/exit, trailing stop loss and auto break even when target reached
- Optional Binary Options mode where statistics are worked out with expiry rather than SL/TP
- Take profit and break even targets can be specified as either risk reward ratios or in pips
- Pips can be optionally specified as a percentage of the Average Daily True Range, allowing it to automatically scale depending on the symbol
- Shows simulated trades on the chart with open price, stop loss used, close price and profit
- Automatic recalculation of statistics upon configuration changes, showing the effect on win ratio, profit and draw-down
- One-click restore of previous configuration if change was not beneficial
- Configured stop loss, break even and take profit prices are shown on chart for use with new trades
- Easy to use configuration pop-ups
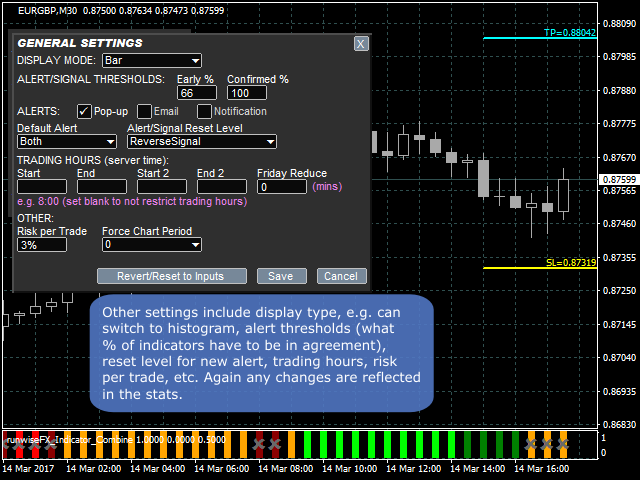
- Choice of display formats, i.e. bar or histogram
- Choice of alert methods, e.g. pop-up, email or mobile notification
- Easy integration with our EAs for automated trading
Indicator Inputs
Use the CONFIG button to configure the system. Inputs are provided as an alternative and are fully described in the manual - see Comments tab for link to manual. Key inputs are explained below:
- Main_alertConfirmedPercentage - Percentage of indicators that need to have lined-up for confirmed alert to happen
- Main_alertEarlyPercentage - Percentage of indicators that need to have lined-up for early alert to happen
- Main_alertResetLevel - How much indicator needs to go to other direction of alert reset to happen
- Main_binaryOptionModeBars - If > 0 then number of bars before trade closes to simulate Binary Options
Using the Strategy Tester / Demo Version
Make sure the test is running at least at market speed for the buttons on the panel to work. Alerts appear in the Journal tab. Note, edit boxes don't work in MT5 visual Tester.
Converting Into an EA
Can easily be converted into an EA that can trade automatically with our Ultimate Trade Manager product.

ユーザーは評価に対して何もコメントを残しませんでした