YouTubeにあるマーケットチュートリアルビデオをご覧ください
ロボットや指標を購入する
仮想ホスティングで
EAを実行
EAを実行
ロボットや指標を購入前にテストする
マーケットで収入を得る
販売のためにプロダクトをプレゼンテーションする方法
MetaTrader 4のための新しいテクニカル指標 - 9
Multi Timeframe Buy and Sell Power MT4
The Multi Timeframe Buy and Sell Power indicator for MetaTrader 4 is a versatile tool designed to provide traders with a clear visual representation of market pressure across nine standard timeframes, from M1 to MN1. By aggregating buy and sell strength percentages derived from recent price action and tick volume, it helps identify potential trends, reversals, and neutral conditions in real-time. The indicator displays this information in a compact dashbo
FREE

【Limited Time Heavyweight Offer】Buy BreakoutIgnition Pro, Get Smart Trend Pro for Free! The Ultimate Combination: Dual-Engine Trend Capture System Why is this combo unbeatable? When precise breakout point detection meets professional trend direction filtering , you don't get just an indicator—you get a complete professional trading system . BreakoutIgnition Pro + Smart Trend Pro = The Market's Best Partnership BIP (Breakout Ignition Detector) : Answers " When to enter "—captures the optimal t

Smart Trend Pro - Intelligent Trend Navigation System (Buy One Get One Free Limited Offer) Ultimate Trend Solution: Get Complete Trading System for $69 Purchase Smart Trend Pro, immediately receive BreakoutIgnition Pro (value $69) for FREE! Two professional indicators originally priced at $138, now only $69! Why Choose Smart Trend Pro? Three Core Advantages Visual Trend Navigation - See market direction at a glance Intelligent Signal Filtering - Trade only high-probability opportunities All T
This is a free helper indicator for MT4 that will help traders setup their constant volume charts depending on their trading style. It will calculate the number of ticks that your constant volume chart should have depending on the following trading styles: Scalper Active Day trader Day trader Swing trader Position trader Instruction video attached.
Enjoy!
FREE
This is MT4 version only. For MT5 visit: https://www.mql5.com/en/market/product/156005/
Detailed blog post with screenshots: https://www.mql5.com/en/blogs/post/765529
Features Overview Bull and Bear Power Visualization: Histograms or Lines or Bands Combined Bull/Bear Power (BBP) Mode: To see the net power balance Customize Colors: for instant pattern recognition Smoothing (Optional): reduces noise for cleaner signals Additional Filter Options: Price Divergence visualization to spot potential

Imbalance Volume Trend is a professional indicator for MetaTrader that combines Fair Value Gap (FVG) / Imbalance zones with volume imbalance analysis and a trend engine based on imbalances . The indicator automatically finds bullish and bearish Fair Value Gaps, paints them on the chart as colored rectangles and calculates the percentage of volume domination of buyers over sellers (or vice versa) inside the breakout candle that created the imbalance. On top of that, it builds a trend of imbalance
MTF Moving Averages Pro - Your Multi-Timeframe Market Hologram Core Value: See All Timeframes at a Glance Tired of switching between charts, trying to piece together the market's big picture? MTF Moving Averages Pro ends this struggle! It reveals the key moving averages from multiple timeframes on a single chart, instantly simplifying complex market structure into a clear visual decision-making map. Core Indicator Features One Chart, a Global View Simultaneous Display : Overlays moving averag

MTF SR Levels Pro – Your All-in-One Multi-Timeframe Support & Resistance Map Core Value: Instantly Identify Key Battlegrounds Across All Timeframes Tired of manually drawing horizontal lines across multiple charts, struggling to find valid support and resistance? MTF SR Levels Pro ends the guesswork! It automatically calculates and plots key support and resistance levels from multiple, user-defined timeframes directly onto your current chart . Transform fragmented market structure into a clear,

Trend Dot Indicator
– Clean & Powerful Reversal System A fast-reacting Trend Step Regression (TSR) line with color-coded dots instantly shows the current trend. High-probability BUY/SELL signals appear only when a real reversal occurs, confirmed by minimum trend length and ADX strength. Description here: https://www.mql5.com/en/blogs/post/765867 Feel free to join my Telegram Channel Features: Clear visual TSR line + dots (blue = up, red = down) Filtered reversal signals with text labels Re

Fixed Time AVWAP (Free) — Basic Fair Price Analysis The Fixed Time AVWAP indicator is a crucial tool for any trader, based on the Volume-Weighted Average Price (VWAP) concept. We provide you with an accurate and reliable AVWAP line, calculated from a user-fixed time, which is essential for determining the current fair value of an asset. Understanding VWAP: Why You Need This Indicator? VWAP is the average price at which an instrument has traded, adjusted by volume. It highlights wher
FREE

Super IA Channel Creator PRO Intelligent Adaptive Channels & Smart Trade Context Super IA Channel Creator PRO is an advanced market-structure and decision-support indicator for MetaTrader 4 , designed to help traders clearly identify high-probability trading zones , context strength , and price reaction behavior in real time. This is not a repainting tool and not a simple channel indicator.
It is a complete decision framework built around adaptive price channels, smart scoring, and visual confir
SUPER IA SNIPER – VOLUME PRO (MT4) Super IA Sniper – Volume PRO is an advanced volume and price-behavior analysis indicator , designed to identify high-probability short-term reversal conditions based on qualified volume events , using closed candles only (NO REPAINT) . It was built for traders who demand precision, transparency, and real statistical validation , eliminating random signals and purely subjective market interpretations. WHAT THE INDICATOR ANALYZES The indicator continuously

Liquidity Channels Pro MT5 VERSION HERE Liquidity Channels is a sophisticated Smart Money Concepts (SMC) tool designed to automate the identification of Buy Side Liquidity (BSL) and Sell Side Liquidity (SSL) . Unlike standard support and resistance indicators, this tool doesn't just draw lines; it projects dynamic expanding channels based on volatility (ATR) from key pivot points. Crucially, it follows the "Mitigation" logic used by institutional traders: once liquidity i

Projected Moving Average A clean and practical moving-average tool designed for traders who want a clearer view of short-term and medium-term trend direction. The Projected Moving Average shifts a standard SMA forward by half of its period, creating a smooth projection zone that updates dynamically with each new candle.
This makes it easier to visually anticipate where the moving average is heading without repainting past values. Key Features Forward-shifted SMA (Length/2) for clearer trend pro

**Zonar** is a professional-grade trading assistant designed to automate the **Opening Range Breakout (ORB)** strategy. Unlike standard indicators, Zonar uses a "Smart-Align" engine that automatically detects the true market open for **Any Instrument** (Gold, US30, NASDAQ, Forex, or Stocks) without manual timezone adjustments. It combines volatility analysis (ATR), Smart Money Concepts (FVG/OB), and Daily Sentiment levels to provide a complete, data-driven trading system on a clean chart. ### **

Gold Pattern Scanner Pro Gold Pattern Scanner Pro automatically detects trend channels and rising/falling wedges directly on your chart, using an Autochartist-style approach. It draws clean upper/lower trendlines, calculates the current price position inside the pattern , and sends smart alerts (including push notifications) when price touches the channel boundaries. Designed especially for GOLD (XAUUSD).
It can be applied to other symbols such as forex pairs, indices, or crypto. Main Features

このインジケーターを購入すると、プロ仕様のトレードマネージャーを無料で差し上げます。
まず第一に、このトレーディングシステムがノンリペイント、ノンリドロー、ノンラグのインジケーターであることを強調する価値がある。これにより、手動取引とロボット取引の両方に理想的なものになっています。 オンラインコース、マニュアル、プリセットのダウンロード。 「スマートトレンドトレーディングシステム MT5」は、新規および経験豊富なトレーダー向けにカスタマイズされた包括的なトレーディングソリューションです。10以上のプレミアムインジケーターを組み合わせ、7つ以上の堅実なトレーディング戦略を備えており、多様な市場状況に対応する多目的な選択肢となっています。 トレンドフォロー戦略:トレンドを効果的に乗り越えるための正確なエントリーとストップロス管理を提供します。 リバーサル戦略:潜在的なトレンドの反転を特定し、トレーダーがレンジ相場を活用できるようにします。 スキャルピング戦略:高速で正確なデイトレードおよび短期取引のために設計されています。 安定性:すべてのインジケーターはノンリペイント、ノンリドロー、ノ
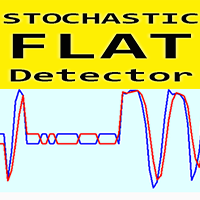
Crypto_Forexインジケーター STOCHASTIC FLAT Detector は、取引における効率的な補助ツールです!リペイント不要。 このMT4対応の優れたインジケーターで、あなたの取引手法をアップグレードしましょう。
- このインジケーターは、チャート上の価格がフラットな領域を表示します。「フラット感度」パラメータを搭載しており、フラットな領域を検出することができます。 - STOCHASTIC FLAT Detectorは、プライスアクションエントリーの確認、ダイバージェンス、売られ過ぎ/買われ過ぎのシグナルに使用できます。 - トレンドフォローシステムでフラットゾーンを検出し、そこでの取引を回避するために使用できます。 - リバーサルスキャルピングに使用でき、フラットな境界線からの反転を狙うことができます。 - 標準的なストキャスティクスの代わりに、STOCHASTIC FLAT Detectorを使用する機会は数多くあります。 - ストキャスティクス自体は市場で最も優れたオシレーターの一つであり、多くのトレーダーにとって最適なツールです。
高品質のトレー
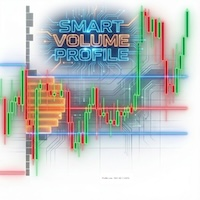
Japanese 「スマートマネー」のスキャン (Volume Markers): 異常な出来高(平均以上)を伴うローソク足を、緑と赤の矢印ではっきりと表示します。大口投資家の参入を見極め、ダマシのシグナルを排除するのに役立ちます。 重要なアラート機能 (Alerts): 画面に張り付く必要はありません。価格がPOC(出来高の中心点)をクロスした瞬間にシステムが通知します。ここはトレンドの継続か反転かの重要な判断ポイントとなります。 現在の市場構造を即座に把握 (Developing Profile): 現在形成中の価格サイクルのプロファイルを表示します。価格が保ち合い(アキュムレーション)ゾーンから抜け出そうとしているのか、それとも平均値に引き戻されているのかを確認できます。

Speed Trend Matrix Ultimate (バージョン 5.10) Speed Trend Matrix (STM) は、単一のインジケーターに組み込まれた包括的なトレーディングシステムです。買われすぎや売られすぎの状態を示すだけの標準的なオシレーターとは異なり、STM は市場のボラティリティ (ATR) に対する価格の「速度」を分析します。トレンドの方向性だけでなく、その動きの背後にある強さも特定し、トレーダーが騙しに遭いやすい勢いの低い「横ばい」期間をフィルタリングします。 このツールは、すべての取引に対して完全なロードマップを必要とするトレーダー向けに設計されています。単なるエントリーシグナルを提供するだけでなく、選択したトレーディングスタイルに基づいて推奨される ストップロス (Stop Loss) と テイクプロフィット (Take Profit) の水準を自動的に計算し、チャート上に直接表示します。 基本理念 インジケーターは、価格の速度に基づいて市場の行動を 3 つの異なるゾーンに分類します。 UpZone (緑): 強い上昇の勢いがある状態。 DownZo
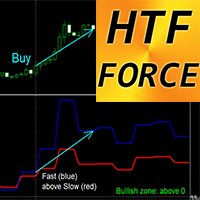
MT4用Crypto_Forexインジケーター HTF Forceオシレーター
- HTF Forceは、マルチタイムフレーム取引に強力なインジケーターです。HTFはHigher Time Frame(高時間枠)の略です。 - Forceインデックスは、価格と出来高データを単一の値に統合する主要なインジケーターの一つです。 - 高時間枠の値は、トレンドの方向を示します(下降トレンド:0未満、上昇トレンド:0以上)。 - Fast Forceインジケーター:青線、Slow Forceインジケーター:赤線。 - 買いシグナル:FastラインがSlowラインを上向きにクロスし、両方とも0以上(図参照)。 - 売りシグナル:FastラインがSlowラインを下向きにクロスし、両方とも0以下(図参照)。 - インジケーターにはモバイルとPCのアラートが組み込まれています。
高品質のトレーディングロボットとインジケーターをご覧になるにはここをクリックしてください! これは、このMQL5ウェブサイトでのみ提供されるオリジナル製品です。

Japanese (日本語) ICT_SuperTrend は、トレーダーが複数のウィンドウを開かずに市場の全体像を把握できるように設計された「オールインワン」ツールです。このインジケーターの主な利点は以下の通りです。 ハイブリッド・トレーディング・システム 最大の利点は、 トレンドフォロー と**スマートマネーコンセプト / ICT(価格構造)**を融合させている点です。 SuperTrend: 市場の主な方向性(買いか売りか)を示します。 ICTコンセプト: 重要なサポート・レジスタンスや大口投資家の痕跡など、構造的な重要ポイントを特定します。これらを組み合わせることで、構造的な根拠を持ちながら自信を持ってトレンドに乗ることができます。 明確なエントリーとエグジット 矢印シグナル がトレンド転換点を明確に示し、判断を容易にします。 SuperTrendライン は動的なサポート/レジスタンスとして機能し、利益を確保するための トレーリングストップ として非常に有効です。 自動化された流動性レベル (Liquidity Levels) ツールは重要な スイングハイ/ロー を自動的にスキ
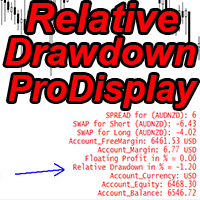
Crypto_Forex MT4用インジケーター「 Relative Drawdown Pro Display 」は、便利なトレーディングツールです。
グリッドトレードシステムを使用するトレーダーにとって、これは必須のインジケーターです!
- Relative Drawdown Pro Displayインジケーターは、口座の現在の相対DD(浮動利益)を%で表示します。 - PCとモバイルの両方でアラート機能を搭載し、トリガーレベルを調整できます。 - インジケーターが接続されている通貨ペアの現在のスプレッドとスワップを表示します。 - インジケーターは、口座残高、エクイティ、マージンも表示します。 - インジケーターの値はチャートの任意の場所に配置できます。 0 - 左上隅、1 - 右上隅、2 - 左下隅、3 - 右下隅。 - 色とフォントサイズも設定できます。 - Relative Drawdown Displayを使用すれば、トレーダーは電卓を使う必要がなくなります。
// 優れたトレーディングロボットとインジケーターは、こちらから入手できます: https://www
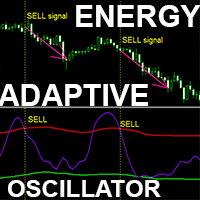
高度なカスタムCrypto_Forexインジケーター「アダプティブ・エネルギー・オシレーター」 - MT4用の効率的な補助取引ツール!
- このインジケーターは新世代のオシレーターです。 - 「アダプティブ・エネルギー・オシレーター」は、調整可能なアダプティブ売られ過ぎ/買われ過ぎゾーンを備えています。 - これは、トレンド市場で非常に有用なテクニカルモメンタムインジケーターです。 - オシレーターは、売られ過ぎ/買われ過ぎエリアから主要トレンド方向への正確なエントリーポイントを見つけるための補助ツールです。 - アダプティブ売られ過ぎゾーン:グリーンラインより下。 - アダプティブ買われ過ぎゾーン:レッドラインより上。 - 標準的なオシレーターよりも正確です。 - インジケーターは任意の時間足で使用できます。 - PCとモバイルの両方にアラート機能を搭載しています。
// 優れたトレーディングロボットとインジケーターは、こちらから入手できます: https://www.mql5.com/en/users/def1380/seller これは、このMQL5ウェブサイトでのみ提供さ
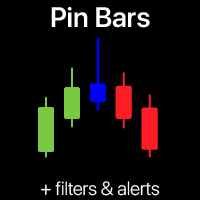
Pin Barパターンスキャナー | スマートアラートとトレンドフィルター 高確率なPin Bar反転を二度と見逃さない!この自動化されたPin Barパターンスキャナーが面倒な作業を代行します。
このトレーディングツールはチャートをリアルタイムでスキャンし、強力なPin Bar(ハンマー/流れ星)パターンを識別し、即座にシグナルを送信します。このトレーディングインジケーターは、推測なしで純粋なプライスアクションの力を利用したい初心者とエキスパートトレーダーの両方のために設計されています。 私の 多機能ユーティリティ : このインジケーターを含む66+機能 | お問い合わせ ご質問はこちら | MT5版
Pin Barパターンとは何か、そしてなぜトレーディングに重要なのか? Pin Bar(ピノキオバー)は、最も信頼性が高く人気のあるプライスアクションパターンの1つです。価格の強い拒否と市場での潜在的な反転を示します。その定義的な特徴は、バー全体の長さの少なくとも2/3を占める長いヒゲ(またはテール)と、反対側の端にある小さな実体です。 強気のPin Bar (
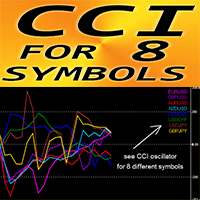
MT4用FXインジケーター「8シンボルCCI」(リペイント機能なし)
- CCIは、トレードで最も人気のあるオシレーターの一つです。 - Commodity_Channel_Index(CCI)は、現在の価格と過去の平均価格の差を測定します。 - 重要なレベル:+/-200 - +200以上のゾーンで売りエントリー、-200以下のゾーンで買いエントリーを取るのに最適です。 - 「8シンボルCCI」は、1つのチャート上で最大8つの異なるシンボルのCCI値を制御できます。 - このインジケーターは、プライスアクションエントリーと組み合わせるのにも最適です。
// 優れたトレードロボットとインジケーターは、こちらから入手できます: https://www.mql5.com/en/users/def1380/seller これは、このMQL5ウェブサイトでのみ提供されるオリジナル製品です。
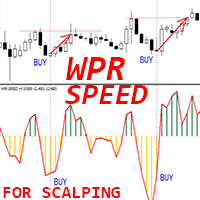
Crypto_Forex MT4用インジケーター「 WPR SPEED 」は、優れた予測ツールで、リペイント機能はありません。
- このインジケーターの計算は物理学の方程式に基づいています。WPR SPEEDは、WPRオシレーター自体の1次導関数です。 - WPR SPEEDは、横ばい相場やフラット相場でのスキャルピングエントリーに適しています。 - WPR SPEEDインジケーターは、WPR自体の方向転換の速さを示します。非常に敏感です。 - モメンタムスキャルピング戦略には、WPR SPEEDインジケーターの使用をお勧めします。インジケーターの大きなピークを見つけ、反対方向にスキャルピングトレードを開始します(図を参照)。 - インジケーターには、モバイルとPCの両方でアラートが組み込まれています。
// 優れたトレーディングロボットとインジケーターは、こちらから入手できます: https://www.mql5.com/en/users/def1380/seller これは、このMQL5ウェブサイトでのみ提供されるオリジナル製品です。
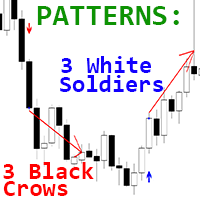
Crypto_Forex MT4用インジケーター「3つの白兵戦&3つの黒カラスパターン」。リペイント不要、遅延なし。
- インジケーター「3つの白兵戦&3つの黒カラス」は、プライスアクショントレードに非常に効果的です。 - インジケーターは、チャート上で3つの白兵戦と3つの黒カラスパターンを検出します。 - 強気の3つの白兵戦パターン - チャート上に青い矢印シグナルが表示されます(画像参照)。 - 弱気の3つの黒カラスパターン - チャート上に赤い矢印シグナルが表示されます(画像参照)。 - PC、モバイル、メールアラート機能搭載。 - インジケーター「3つの白兵戦&3つの黒カラス」は、サポート/レジスタンスレベルと組み合わせ、主要トレンド方向へのトレードに最適です。
// 優れたトレードロボットとインジケーターは、こちらから入手できます: https://www.mql5.com/en/users/def1380/seller これは、このMQL5ウェブサイトでのみ提供されるオリジナル製品です。
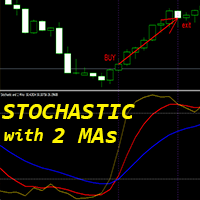
Crypto_Forex MT4用インジケーター「ストキャスティクスと2つの移動平均線」、リペイント不要。
- ストキャスティクスは市場で最も優れたインジケーターの一つで、多くのトレーダーにとって最適なツールです。 - 「ストキャスティクスと2つの移動平均線」インジケーターを使用すると、ストキャスティクスの高速移動平均線と低速移動平均線を確認できます。 - 買われすぎゾーン - 80以上、売られすぎゾーン - 20以下。 - 80以上のゾーンから売りエントリー、20以下のゾーンから買いエントリーを行うのが最適です。 - 買いと売りのエントリー条件は画像で確認できます。 - 買いシグナルの条件を検討してください。 (1) - 売られすぎゾーンで高速移動平均線が低速移動平均線を上向きにクロス:買いトレードを開始。 (2) - ストキャスティクスの値が買われすぎゾーンで高速移動平均線が下向きにクロス:買いトレードを終了。 (3) - 売りトレードの場合はその逆(画像を参照)。
高品質のトレーディングロボットとインジケーターをご覧になるにはここをクリックしてください! これは、このMQL

この指標は、線を使用して特定のろうそくの測定値を構築する一種の戦略であり、トレーダーの計算と取引に役立ちます。
インジケーター自体は通常の移動平均であり、明るい色と暗い色の2色で着色されているため、特定の時点での現在の状況での市場行動の性質をトレーダーに示し、色の表示に応じて、この段階でどの取引が最もよく開かれているかを示します。購入するか、販売するかのいずれかです。
しかし、インジケーターの垂直線と水平線は、トレーダーに彼の結論を詳しく見る権利を与え、トレーダーが特定の時間に取引している場合はさらにそうです。このインジケーターは、インジケーター設定でトレーダー自身が設定した特定の時間の水平線で、キャンドルの最大値と最小値の開閉を計算し、これを分割しますパラメーターは、トレーダー自身が設定した一定期間の最大値と最小値の平均値を示す3行目で分割されます。 そして、トレーダーの便宜のために、私は日の取引で今日の取引の終わりを示す3番目の垂直線を追加しました。
インジケーターはH1期間正しく機能しています。 私は他の期間にそれをチェックしませんでした。
その後、私は無料でExper
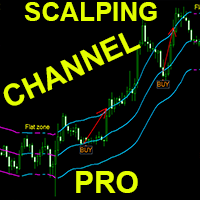
MT4用Crypto_Forexインジケーター「 Scalping Channel Pro 」
- Scalping Channel Proは、ATRベースのボラティリティボーダーを備えています。 - スキャルピング取引に最適です。 - ミドルラインで指値注文を保留してエントリーします。 - 青色の安定した上昇チャネルが形成され、少なくとも1本のローソク足が上限ボーダーを上回って終値した場合、強気エントリーを検討します(画像参照)。 - 赤色の安定した下降チャネルが形成され、少なくとも1本のローソク足が下限ボーダーを下回って終値した場合、弱気エントリーを検討します(画像参照)。 - インジケーターには情報ディスプレイがあり、インジケーターが接続されている通貨ペアの現在のスプレッドとスワップが表示されます。 - 画面には、口座残高、エクイティ、マージンも表示されます。 - 情報ディスプレイ(スプレッドとスワップ)はチャートの任意の場所に配置できます。 0 - 左上、1 - 右上、2 - 左下、3 - 右下。
高品質のトレーディングロボットとインジケーターをご覧になるにはここをクリッ
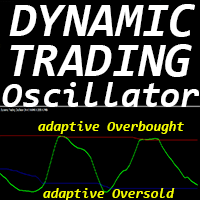
「ダイナミック・トレーディング・オシレーター」は、MT4向けの高度なカスタムCrypto_Forexインジケーターです。効率的なトレーディングツールです!
- 新世代のオシレーター - 使い方は画像をご覧ください。 - ダイナミック・トレーディング・オシレーターは、適応型の売られ過ぎ/買われ過ぎゾーンを備えています。 - オシレーターは、動的な売られ過ぎ/買われ過ぎエリアから正確なエントリーポイントを見つけるための補助ツールです。 - 売られ過ぎ値:青線より下、買われ過ぎ値:赤線より上。 - このインジケーターは、プライスアクションパターンと組み合わせるのに最適です。 - 標準的なオシレーターよりもはるかに正確です。対応時間足:M30、H1、H4、D1、W1。 - PCとモバイルアラート機能付き。
高品質のトレーディングロボットとインジケーターをご覧になるにはここをクリックしてください! これは、このMQL5ウェブサイトでのみ提供されるオリジナル製品です。

High Low Cloud Trendインジケーターは、適応型価格境界を通じてトレンド方向と平均回帰の機会を特定するチャネルベースのテクニカル分析ツールです。このシステムは、指定されたルックバック期間における最高値の高値と最低値の安値を計算することで動作し、全体的な価格範囲を定義する外部チャネル境界を作成します。二次的な内部チャネルは、より短い期間(メインルックバック期間の4分の1)を使用して、より広い範囲内のより即時的な価格変動を捕捉します。インジケーターの中核ロジックは、終値を参照値と比較することでトレンド方向を決定します。この参照値は、価格がこれらの極値に触れる場所に基づいて最高点と最低点の間で反転します - 価格が最低安値に達すると、参照は最高高値に切り替わり、その逆も同様です。これにより、インジケーターが塗りつぶしヒストグラムまたはラインとして下部チャネル(上昇トレンド)または上部チャネル(下降トレンド)のいずれかを表示するバイナリトレンド状態が作成されます。平均回帰検出メカニズムは、価格が外部境界に触れた後に内部チャネルに向かって戻る特定のクロスオーバーパターンを識別し、

The official release price is $65 only for the first 10 copies, ( only 2 copies left ). Next price: $125 Gold Scalper System is a multifunctional trading system that combines a breakout strategy for key liquidity levels with confirmation and a built-in Smart DOM Pro module for market depth analysis. The system identifies zones of limit order accumulat

Ultimate Daily SR Zones + Rejection Arrows Ultimate Daily SR Zones is a powerful price-action indicator that helps traders clearly identify the most important daily market levels — the previous day’s High , Low , Midline , and opening/closing reference points.
It also detects wick rejection signals and plots automatic Buy and Sell arrows when the market rejects these zones. This tool is perfect for intraday and swing traders who use daily levels for breakout, reversal, or retest strategies. Wh

Ultimate Market Master Trend Master the Market’s Direction with Precision The Ultimate Market Master Trend indicator is an all-in-one market sentiment analyser designed for traders who demand clarity, accuracy, and confidence in every move.
It combines smart trend detection, multi-timeframe stochastic momentum, and dynamic visual cues to help you identify high-probability entries and exits with ease. Key Features 1. Smart Trend System (Main Chart) Uses a 200-period LWMA baseline to determine

# CurrencyMeter Pro - Professional Multi-Market Strength Analyzer
## Overview
CurrencyMeter Pro is a powerful real-time momentum analyzer that tracks the strength of currencies, cryptocurrencies, indices, metals, and energy markets at a glance. Make smarter trading decisions by instantly identifying the strongest and weakest instruments across multiple asset classes.
Whether you're a forex trader looking to pair strong currencies against weak ones, or a multi-asset trader seeking momentum co

Ultimate Super Rejection Zones は、相場の重要ポイントである 当日の高値・安値ゾーン を自動的に検出し、価格が強く反応した瞬間に 高精度なリジェクション(反発)シグナル を表示する高度なインジケーターです。
プライスアクション、日足レベルの分析、そして 2つのストキャスティクス(H1 + M5) による強力なダブル確認システムを組み合わせ、明確で信頼性の高いエントリーシグナルを提供します。 スキャルパー、デイトレーダー、スイングトレーダーに最適です。 主なメリット 高精度のデイリーゾーンを自動検出 インジケーターは 当日の高値・安値・ミドルライン をリアルタイムで表示します。 リジェクション矢印で一目で判断 赤矢印(SELL) :デイリーハイでの反発 緑矢印(BUY) :デイリーローでの反発 矢印は 1日に1回のみ 出現するため、ノイズがありません。 ダブル・ストキャスティクスによる強力な確認 シグナルは次の2つでフィルタリングできます: H1 ストキャスティクス M5 ストキャスティクス 誤シグナルを大きく減らし、精度が向上します。 完全なアラー

www tradepositive .lat
ALGO Smart Flow Structure Indicator The institutional standard for market structure. Designed for serious SMC (Smart Money Concepts) and Price Action traders, this indicator eliminates the noise of conventional fractals. Forget about repainting signals and ambiguity; get a crystal-clear view of the real market structure , validated by strict algorithmic rules. The Bias Dashboard Make informed decisions by monitoring 3 critical variables across 8 simultaneous timefr
FREE

Instant Pitchfork is built for traders who rely on quick and precise pitchfork trend structures to plan entries, stops, and targets. Click an anchor on the chart and Instant Pitchfork automatically draws the best-fit Andrews’ Pitchfork for the current market structure.
Click the anchor again to instantly switch between Andrews’, Schiff, and Modified Schiff pitchfork modes to find the best structural fit in seconds. Works on any symbol and any timeframe.
Instant Pitchfork — Quick Manual 1. Atta
Verion PowerSignal es un indicador diseñado para proporcionar señales visuales de posibles cambios en la dirección del precio, basado en un análisis interno de las condiciones del mercado que combina la dinámica de las velas y el comportamiento estructural. El propósito del indicador es ayudar al usuario a identificar áreas donde el precio puede mostrar cambios de impulso, agotamiento o continuidad dentro de una tendencia existente. Las señales se muestran directamente en el gráfico como flechas
# Product Name: SamuraiFX Momentum Hunter **Current Version:** 4.0 (Smart Validation Update) **Category:** Trend / Oscillators / Fractals **Timeframes:** M15, H1, H4, D1 (Recommended)
### ️ Trade with Discipline. Eliminate the Noise.
**SamuraiFX Momentum Hunter** is not just another arrow indicator. It is a complete trading system that combines the momentum of the **Awesome Oscillator (AO)** and **Accelerator Oscillator (AC)** with the structural precision of **Fractals**. Most indicators flo

Read carefully, because I’m about to sell my strategy based on over 11 years of study: This indicator plots multiple levels: thick and dotted, taking the ATR into account. On 90% of trading days, it touches one thick level and one dotted level. Levels are updated daily. If the price touches a thick level and a dotted level in a single day, trading for that day is over—you wait for the next day to look for the same setup. If the price comes very close to a level but doesn’t reach it, it’s likely

Product Name: Combined KD Enhanced Multi-Signal Stochastic Indicator Core Benefits: - **Signals in 1 Glance**: Red (buy) / green (sell) arrows + dual curves; auto-marked 20/80 overbought/oversold zones – no complex math needed. - **All-Market Fit**: Default KD(9,3,3); customizable settings work for stocks/forex/futures (any MT5 timeframe: M1-MN1). - **Lag-Free Performance**: 20% faster than official MT5 Stochastic – smooth loading even on large historical datasets.
Key Features: -
Performance Analytics 1.4 is an advanced real-time performance-tracking and risk-management indicator designed for traders who work with multiple EAs or simultaneous setups and need accurate, persistent, instance-separated metrics.
It displays on-screen key statistics for both the entire account and the current EA, including profits, maximum losses, professional performance metrics, and smart alerts. The indicator visually divides the information into two independent blocks : 1. White Block – Ge

TouchGuard Alert – Advanced Price Alert & Notification Indicator for MetaTrader 4 (MT4) TouchGuard Alert is a fast, lightweight, and highly accurate price-touch Alert & Notification system designed for MetaTrader 4 (MT4) and MetaTrader 5 (MT5) . It automatically sends real-time Alerts, Pop-Up Alerts, Email Notifications, Push Notifications and early-warning notifications when price touches or approaches your chart objects. Key Features (High-Precision Alert & Notification System)

Trend tier-профессиональный индикатор визуализации каналов, разработанный для быстрого анализа дневной структуры цены и удобного мониторинга ключевых уровней. Индикатор автоматически определяет текущий максимум и минимум торгового дня по таймфрейму M5 и строит две отдельные проекции (High и Low), которые можно настраивать отдельно по процентному и фиксированному сдвигу. Каждая проекция формирует набор уровней (уровни вверх/вниз), опциональные P1-линии и рамки, а также «overlay» — чёрные
SuperTrend Pro (MT4 Version) - The Ultimate Trend Following System
Unlock the full potential of the SuperTrend indicator with the Pro version. Designed for serious traders who need more than just a simple line. SuperTrend Pro is not just an indicator; it is a complete trading system. It combines the proven reliability of the classic SuperTrend with advanced Multi-Timeframe (MTF) analysis and Smart Filtering to give you the highest probability setups. Why SuperTrend Pro? Trading with a sing
The Trend Duration Forecast MT4 indicator is designed to estimate the probable lifespan of a bullish or bearish trend. Using a Hull Moving Average (HMA) to detect directional shifts, it tracks the duration of each historical trend and calculates an average to forecast how long the current trend is statistically likely to continue. This allows traders to visualize both real-time trend strength and potential exhaustion zones with exceptional clarity. KEY FEATURES Dynamic Trend Detection: Uti

Power MACD indicator for MT4 with the features: 1. MACD Calculation: Fast EMA (default: 12) Slow EMA (default: 26) Signal line SMA (default: 9) Histogram with color-coded bars (green up, red down) 2. Multiple Signal Types (can be enabled/disabled): Zero Line Cross : Signals when MACD crosses above/below zero MACD/Signal Cross : Signals when MACD crosses Signal line Histogram Change : Signals when histogram changes direction, with a Sensitivity factor 3. Visual Indicators: Arrows on the main pric

Order Blocks SMT is not “just another indicator”.
It’s the tool that lets you read institutional order flow and make decisions with the same logic used by banks and funds – directly in MetaTrader 5 (MT5) . What this MT5 Order Blocks Indicator Does for You With Order Blocks SMT (an advanced Smart Money / ICT Order Blocks indicator for MT5), you can: Stop guessing supply & demand and start trading clear, objective, repeatable levels . See on one chart the Order Blocks from up

Commodity Channel Index. Не рисующий индикатор для отображения старшего таймфрейма (далее ТФ) на текущем графике. Возможно использовать на текущем ТФ. Несколько вариантов расчета по различным ценам и используемым мувингам. Параметры: TimeFrame - должен быть больше равен текущему. Period - должен быть больше 1. Price Type - варианты: Close, High, Low, Median, Typical, Weighted, Average, Body, Median, Trend Biased. MA Metod - метод вычисления на основе МА: SMA, EMA, SMMA, LWMA, LSMA, WEMA. Sm

Hello friends. I am very proud to introduce you to this new indicator that I have been working on for a while. Drag the indicator to the xauusd chart on the 1-minute time frame and enjoy. The indicator will tell you when a buy or sell signal occurs. You can place your stop loss order at the end of the buy or sell arrows. Please be careful, keep your account management and transaction amount at a level that will not make you sad about possible loss of money. Good trading.

Market Time Watch A clean, lightweight and essential time-tracking tool for every trader Market Time Watch is a professional on-chart time display designed for traders who need an accurate real-time clock and precise candle timing while analyzing the markets. This tool helps you instantly see current local time , server time , and candle countdown directly on your chart without any clutter or heavy UI components. Whether you scalp fast markets, swing-trade sessions, or simply need a clean time r
FREE

Smart Risk Manager Pro – ドラッグして自信を持ってトレード Smart Risk Manager Pro は、ドル建てリスクに基づいてポジションサイズを計算する プロフェッショナル向けオンチャート リスク管理ツールです。 チャート上で クリック&ドラッグ するだけで、インジケーターが即座に次を表示します: 方向 (Buy / Sell) 距離 (ポイント) 推奨ロットサイズ (あなたの RiskUSD に基づく) このツールは超軽量・超高速で、 クリーンなチャート と リスク優先のトレードフロー を求めるトレーダーのために設計されています。 機能 ️ チャート上でドラッグするだけでリスクを測定 ️ スマートな自動ロット計算 ️ Buy/Sell の方向を表示 ️ ポイント単位の距離を表示 ️ すべてのシンボルに対応(FX、ゴールド、指数、仮想通貨など) ️ 超高速 – ラグほぼゼロ ️ クリーンでミニマルなユーザーインターフェース ️ サブウィンドウなし・重いパネルなし ️ マウスを離したときだけ計算 → CPU 負荷を軽減 使い方

自動エリオット波動理論 (Automated Elliott Wave) 1. 自動波動カウントとバイアスの排除(客観性) 通常、エリオット波動のカウントには「主観」や個人の意見が入りがちです。このインジケーターは以下のように役立ちます: 推進波(インパルス 1-2-3-4-5)の検出: 厳格なルール(例:3波は最短であってはならない、4波は1波と重なってはならない)を使用し、理論的に正しい価格構造を表示します。 修正波(A-B-C)の検出: トレンド方向への再エントリー機会を見つけるために、価格の調整局面を捉えます。 2. マルチ・ディグリー分析 (Multi-Degree Analysis) 単一の時間枠だけでなく、3つの深度レベルを同時に分析し、市場を立体的(3D)に捉えます: マイナー (Minor): 短期的な素早い動き。 インターミディエイト (Intermediate): 主要なトレンド。 プライマリー (Primary): 市場の大きな全体像。 メリット: トレードスタイルに合わせて各レベルの表示/非表示を切り替え可能です。 3. ターゲット価格とエントリーポイント (
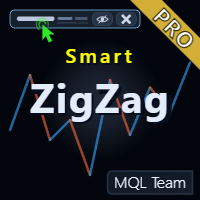
製品名 Smart ZigZag Pro (MT4) – SmartView シリーズ 短い説明 ZigZag インジケーターのプロフェッショナル版。チャート上の Smart コントロールパネル、高度な分析ツール、動的なサポート/レジスタンスレベル、自動取引シグナル、パターン認識、波動統計、すべての要素の包括的なカスタマイズ機能を備えています。無料版は Pro 版と SmartView パネル機能を共有しています。 概要 Smart ZigZag Pro は Smart ZigZag インジケーターのプロフェッショナル版で、より深い市場洞察を必要とする本格的なトレーダー向けに高度な分析ツールと強化された可視化機能を提供します。インジケーターにはチャートに埋め込まれた Smart コントロールパネルが含まれており、現在の値と主要な情報を表示し、20 のデータバッファが高度な分析と Expert Advisor 統合のための包括的なデータを提供します。 主な機能 チャート上の Smart コントロールパネル(無料版でも利用可能)。 高度なサポート/レジスタンスレベル – 確認済みレベルとブ
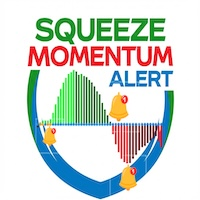
Squeeze Momentum Alert (スクイーズ・モメンタム・アラート) 1. 価格の「爆発」ポイントを特定 (The "Squeeze") このインジケーターの最大の利点は、大きな動きが起こる前の「保ち合い(レンジ)」や「エネルギーの蓄積」の期間を捉える能力です。 なぜ良いのか: 相場は静寂(保ち合い)と変動(爆発)を繰り返します。このツールは**「チャートが現在凝縮しており、次の急騰に備えよ」**と告げるため、大きなトレンドの初動を逃しません。 2. トレンドの「強さ」を色で詳細に判別 (Color Coded Momentum) ヒストグラムは単に価格の上下だけでなく、 4色のレベル でトレンドの健全性を示します: ライム色 (Lime): 非常に強い上昇(順張り)。 深緑色 (Dark Green): 上昇力の低下(警戒、利益確定の準備)。 赤色 (Red): 非常に強い下落(強い売り)。 マルーン色 (Maroon): 下落力の低下(売り圧力が弱まっている)。 なぜ良いのか: トレンドが強い時の**「エントリー」 と、色が変わり勢いが落ちた瞬間の 「逃げ(エグジット
Volume Profile Pro インジケーター このインジケーターは、 Volume Profile Pro ツールであり、「どの価格帯で最も取引が行われているか」を分析するのに役立ちます。以下の特別な機能が追加されています: 表示モード (Display Modes) Volume Profile (通常): 各価格帯の総取引量 (Total Volume) を表示し、重要なサポート・レジスタンスゾーンを可視化します。 Delta / Money Flow: 買い圧力と売り圧力 (Buy vs Sell) の「差(デルタ)」を表示し、その価格でどちらが市場を支配しているかを示します。ボリュームまたはマネーフロー (Money Flow) で表示可能です。 計算モード (Calculation Modes) Pro版の際立った特徴は、期間選択の柔軟性です: Fixed Mode (固定モード): 過去のローソク足の本数を固定で設定します(例:過去100本)。 Dynamic Mode (ダイナミックモード - 注目の機能): 垂直線が表示されます。マウスを使ってこの線をチャート上

製品名 Smart ZigZag (MT4) – SmartView シリーズ 短い説明 MetaTrader プラットフォームで独特なユーザー体験を提供する ZigZag インジケーター。以前は利用できなかった高度な機能を提供し、ダブルクリックで設定を開く、削除せずにインジケーターを非表示/表示する、インジケーターウィンドウをチャート全体のサイズで表示するなどの機能を備えています。SmartView Indicators シリーズの残りの部分とシームレスに連携するように設計されています。 概要 SmartView シリーズは、革新的な機能を通じて MetaTrader プラットフォーム上のインジケーターに独特で特徴的なユーザー体験を提供し、インジケーター管理をより速く、より簡単にします。各インジケーターには、チャート上のスマートコントロールパネルが装備されており、基本情報を表示し、すべての重要な機能への迅速なアクセスを提供します。 以前は利用できなかった独自の機能 SmartView シリーズは、インジケーターでの作業をより簡単で迅速にする高度な機能を提供します: ダブルクリックで設
FREE
これは無料製品ですので、ご自由にお使いください!
また、皆様からの肯定的なフィードバックにも大変感謝しております!ありがとうございます!
// 優れたトレーディングロボットとインジケーターは、こちらから入手できます: https://www.mql5.com/en/users/def1380/seller
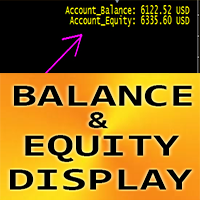
MT4用Crypto_Forexインジケーター「残高と資産表示」は、優れた補助取引ツールです。
- このインジケーターは、アカウントの現在の残高と資産を表示します。 - 表示値はチャートの任意の場所に配置できます。 0 - 左上、1 - 右上、2 - 左下、3 - 右下 - 色とフォントサイズも設定可能です。 これは、このMQL5ウェブサイトでのみ提供されるオリジナル製品です。
FREE

製品名 Smart Parabolic SAR (MT4) – SmartView シリーズ 短い説明 MetaTrader プラットフォームで独特なユーザー体験を提供する Parabolic SAR インジケーター。以前は利用できなかった高度な機能を提供し、ダブルクリックで設定を開く、削除せずにインジケーターを非表示/表示する、インジケーターウィンドウをチャート全体のサイズで表示するなどの機能を備えています。SmartView Indicators シリーズの残りの部分とシームレスに連携するように設計されています。 概要 SmartView シリーズは、革新的な機能を通じて MetaTrader プラットフォーム上のインジケーターに独特で特徴的なユーザー体験を提供し、インジケーター管理をより速く、より簡単にします。各インジケーターには、チャート上のスマートコントロールパネルが装備されており、基本情報を表示し、すべての重要な機能への迅速なアクセスを提供します。 以前は利用できなかった独自の機能 SmartView シリーズは、インジケーターでの作業をより簡単で迅速にする高度な機能を提供
FREE

製品名 Smart Bollinger Bands (MT4) – SmartView シリーズ 短い説明 MetaTrader プラットフォームで独特なユーザー体験を提供する Bollinger Bands インジケーター。以前は利用できなかった高度な機能を提供し、ダブルクリックで設定を開く、削除せずにインジケーターを非表示/表示する、インジケーターウィンドウをチャート全体のサイズで表示するなどの機能を備えています。SmartView Indicators シリーズの残りの部分とシームレスに連携するように設計されています。 概要 SmartView シリーズは、革新的な機能を通じて MetaTrader プラットフォーム上のインジケーターに独特で特徴的なユーザー体験を提供し、インジケーター管理をより速く、より簡単にします。各インジケーターには、チャート上のスマートコントロールパネルが装備されており、基本情報を表示し、すべての重要な機能への迅速なアクセスを提供します。 以前は利用できなかった独自の機能 SmartView シリーズは、インジケーターでの作業をより簡単で迅速にする高度な機
FREE
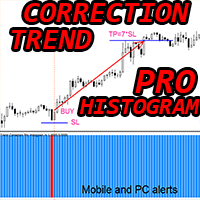
Crypto_Forex MT4用インジケーター「 Trend Correction Pro Histogram 」、リペイント不要!
- Trend Correction Pro Histogramは2色表示が可能。赤は弱気トレンド、青は強気トレンドを表します。 - ヒストグラムの7列が連続して同じ色の場合、新しいトレンドの始まりを意味します。 - Trend Correction Pro Histogramインジケーターは、損失を最小限に抑え、利益を最大化することを主な目的として設計されています。 - インジケーターの感度を制御するパラメーター「Period」を備えています。 - モバイルとPCの両方に対応したアラート機能を搭載しています。 - インジケーターには情報表示機能があり、接続されたFXペアの現在のスプレッドとスワップを表示します。 - 画面には口座残高、エクイティ、マージンも表示されます。 - 情報表示はチャートの任意の場所に配置できます。 - Trend Correction Pro Histogramは、シンプルながらも収益性の高い取引システムとして活用できます
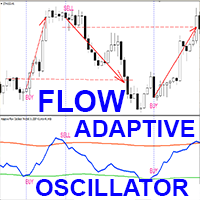
高度なカスタムCrypto_Forexインジケーター「アダプティブフローオシレーター」 - MT4用の効率的な補助取引ツール!
- このインジケーターは新世代のオシレーターです。 - 「アダプティブフローオシレーター」は、調整可能なアダプティブ売られ過ぎ/買われ過ぎゾーンを備えています。 - このインジケーターは、価格と出来高の両方のデータを使用して計算を行います。 - オシレーターは、売られ過ぎ/買われ過ぎエリアから正確なエントリーポイントを見つけるための補助ツールです。 - アダプティブ売られ過ぎゾーン:グリーンラインより下。 - アダプティブ買われ過ぎゾーン:レッドラインより上。 - このインジケーターは、トレンド戦略やサポート/レジスタンスレベルと組み合わせるのに最適です。 - 標準的なオシレーターよりも正確です。 - このインジケーターは、あらゆる時間枠で使用できます。 - PCとモバイルの両方にアラート機能を搭載しています。
// 優れたトレーディングロボットとインジケーターは、こちらから入手できます: https://www.mql5.com/en/users/de
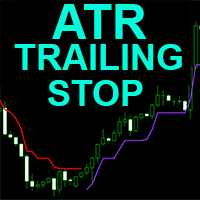
Crypto_Forex MT4用インジケーター「ATRトレーリングストップ」(リペイント不要)
- MT4用の優れた補助インジケーターATRトレーリングストップで、トレード手法をアップグレードしましょう。 - このインジケーターはトレーリングストップに最適です。 - ATRトレーリングストップは、市場のボラティリティに自動的に適応します。 - 遅延がなく、簡単に設定できます。 - このインジケーターは、主要トレンドの方向へのプライスアクションエントリーと組み合わせるのに最適です。
// 優れたトレードロボットとインジケーターは、こちらから入手できます: https://www.mql5.com/en/users/def1380/seller これは、このMQL5ウェブサイトでのみ提供されるオリジナル製品です。
製品名 Smart Moving Average PRO (MT4) – SmartView シリーズ 短い説明 12種類のカスタム移動平均タイプ、スマートアラートシステム、2色のトレンドライン、チャート上に統合されたSmartViewコントロールパネルを備えたSmart Moving Averageのプロフェッショナル高度版。プロフェッショナルなパワーと高性能を、使いやすさとスマートなインターフェースと組み合わせています。 概要 Smart Moving Average PROは無料版からの包括的なアップグレードで、4つの標準タイプに加えて、8つの追加の高度な移動平均タイプ(HMA、KAMA、DEMA、TEMA、VWMA、RMA、McGinley、JMA)を提供します。インスタント通知とクローズベースの通知をサポートするプロフェッショナルなアラートシステム、MAの傾きに基づいて自動的に変化する2色のライン、8つの価格ソースオプションを備えています。これらすべてが、チャート上で迅速な管理と直接的な値の表示を提供するSmartViewパネルと組み合わされています。 主な機能 12種類の
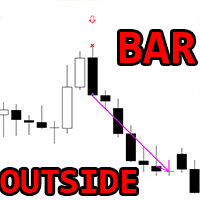
Crypto_Forex MT4用インジケーター アウトサイドバーパターン。リペイントなし、遅延なし。
- インジケーター「アウトサイドバー」は、プライスアクション取引に非常に強力なインジケーターです。 - インジケーターはチャート上のアウトサイドバーパターンを検出します。 - 強気のアウトサイドバー - チャート上に青い矢印シグナルを表示します(画像参照)。 - 弱気のアウトサイドバー - チャート上に赤い矢印シグナルを表示します(画像参照)。 - PC、モバイル、メールアラート機能付き。 - インジケーター「アウトサイドバーパターン」は、サポート/レジスタンスレベルと組み合わせるのに最適です。
// 優れたトレードロボットとインジケーターは、こちらから入手できます: https://www.mql5.com/en/users/def1380/seller これは、このMQL5ウェブサイトでのみ提供されるオリジナル製品です。
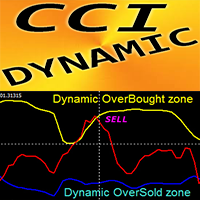
Crypto_Forex MT4用インジケーター「ダイナミック売られ過ぎ/買われ過ぎゾーン付きCCI」(リペイント機能なし)
- コモディティ・チャネル・インデックス(CCI)は、トレンド方向へのモメンタムトレードに最適です。 - ダイナミック買われ過ぎゾーンからの売りエントリー、およびダイナミック売られ過ぎゾーンからの買いエントリーを、主要トレンド方向へ行うのに最適です。 - このインジケーターは、プライスアクションエントリーと組み合わせるのも効果的です。 - ダイナミック買われ過ぎゾーン - 黄色線より上。 - ダイナミック売られ過ぎゾーン - 青線より下。 - CCIオシレーターは、現在価格と過去平均価格の差を測定します。 - PCおよびモバイルアラート機能付き。
// 優れたトレードロボットとインジケーターは、こちらから入手できます: https://www.mql5.com/en/users/def1380/seller これは、このMQL5ウェブサイトでのみ提供されるオリジナル製品です。
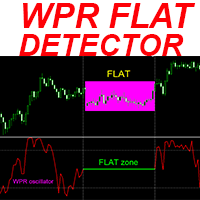
Crypto_Forexインジケーター「 WPR FLAT Detector 」は、取引における効率的な補助ツールです!リペイント不要。 このMT4対応の優れたインジケーターで、あなたの取引手法をアップグレードしましょう。
- このインジケーターは、チャート上の価格がフラットな領域を表示します。「フラット感度」パラメータを搭載しており、フラットな領域を検知します。 - 「WPR FLAT Detector」は、プライスアクションエントリーの確認や、他のインジケーターと組み合わせて使用できます。 - トレンドフォローシステムでフラットゾーンを検出し、そこでの取引を回避するために使用できます。 - リバーサルスキャルピングに使用でき、フラットな境界線からの反転を狙うことができます。 - 標準のWPRオシレーターの代わりに「WPR FLAT Detector」を使用する機会は数多くあります。 - WPR自体は、高速スキャルピングに最適なオシレーターの1つです。 - 買われ過ぎゾーン(-20以上)から売りエントリー、売られ過ぎゾーン(-80以下)から買いエントリーを取るのに最適です。
/
MetaTraderマーケットは自動売買ロボットとテクニカル指標を販売するための最もいい場所です。
魅力的なデザインと説明を備えたMetaTraderプラットフォーム用アプリを開発するだけでいいのです。マーケットでプロダクトをパブリッシュして何百万ものMetaTraderユーザーに提供する方法をご覧ください。
取引の機会を逃しています。
- 無料取引アプリ
- 8千を超えるシグナルをコピー
- 金融ニュースで金融マーケットを探索
新規登録
ログイン