YouTubeにあるマーケットチュートリアルビデオをご覧ください
ロボットや指標を購入する
仮想ホスティングで
EAを実行
EAを実行
ロボットや指標を購入前にテストする
マーケットで収入を得る
販売のためにプロダクトをプレゼンテーションする方法
MetaTrader 4のための新しいテクニカル指標 - 8

KATANA Scalper for MT4 製品概要 Click here for the simple version https://www.mql5.com/ja/market/product/161751 KATANA Scalper for MT4 は、MetaTrader 4プラットフォーム向けに最適化された高度なテクニカル分析インジケーターです。本製品は、短期取引(スキャルピング・デイトレード)において最も課題となる「価格ノイズ」と「反応の遅延」を同時に解決することを目的に設計されました。 独自の信号処理アルゴリズムにより、相場の表層的な乱高下を排除し、統計的に優位性の高い「モメンタムの芯」を抽出します。複雑な相場をシンプルに構造化し、トレーダーが客観的なデータに基づいて精密な判断を下すための視覚的インターフェースを提供します。 導入による5つの技術的メリット 1. 非線形アルゴリズムによるノイズ除去と低ラグの実現 従来の移動平均線やオシレーターは、平滑化を行うほど反応が遅れる(ラグが発生する)という数学的課題がありました。本ツールは独自の非線形ロジックを用
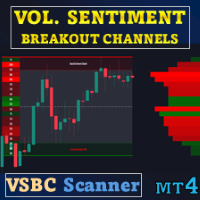
スペシャルオファー : ALL TOOLS 、1本あたりわずか $35 ! 新しいツール は、 最初の 1 週間 または 最初の 3 本の購入 まで $30 となります! Trading Tools Channel on MQL5 :最新情報を受け取るために、私の MQL5 チャンネルに参加してください Volume Sentiment Breakout Channels は、ダイナミックな価格チャネル内の出来高センチメントに基づいてブレイクアウトゾーンを可視化するインジケーターです。純粋なテクニカルなブレイクだけを見るのではなく、買い/売りの出来高がレンジ・コンソリデーション領域の中でどのように分布しているかに焦点を当て、価格がチャネルを離れるたびに、買い手と売り手の支配の移り変わりを表現します。 各圧縮ゾーンの内部で、インジケーターは影響度の高いエリアを特定し、買い方と売り方の優勢度合いを測定し、注文フローの強さをチャート上で継続的に更新します。出来高センチメントによって「重み付け」されたチャネルを価格が上抜けまたは下抜けしたとき、そのイベントは単な

特別オファー : ALL TOOLS 、各 $35 のみ! 新しいツール は $30 で、 最初の1週間 または 最初の3回の購入 に適用されます! Trading Tools Channel on MQL5 : 最新ニュースを受け取るために私の MQL5 チャンネルに参加してください Liquidation Reversal Signals は、 Z-score による出来高の極値 と Supertrend の状態変化 を組み合わせることで 方向性のある清算フェーズをマーキング し、 反転ポイントを確認 するために設計されたインジケーターです。トレンドが単に「色が変わる」たびに矢印を出すのではなく、このツールはワークフローを2つの明確なレイヤーに分離します: 清算イベント: 下位タイムフレームの方向性ボリューム(上昇/下降ボリューム)が、定義されたしきい値を超える統計的に有意なスパイクを生み出したときに記録されます。 反転シグナル: 記録された清算イベントが Timeout ウィンドウ内で有効なままの間に Sup
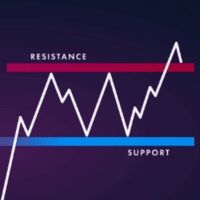
MT4 バージョン: https://www.mql5.com/ja/market/product/157679 MT5 バージョン: https://www.mql5.com/ja/market/product/157680
サポート・レジスタンス — スマートな市場構造レベル
プロのトレーダーと自動システム向けに開発された、シンプルでインテリジェント、かつ信頼性の高いサポート&レジスタンスインジケーターです。
サポート・レジスタンスは、フラクタル、ATRベースの価格セグメンテーション、マルチタイムフレーム分析を組み合わせた高度なクラスタリングアルゴリズムを用いて、真の市場レベルを検出するように設計されています。
このインジケーターは、ランダムなラインやノイズの多いラインを描くのではなく、価格が繰り返し反応した統計的に検証されたレベルを生成します。そのため、裁量取引、アルゴリズム取引、リスク管理、ブレイクアウト検証に最適です。
主な機能 高度なサポート・レジスタンス・エンジン ATRスケールのグリッドセグメンテーションを使用 上方フラクタルと下方フラクタルをクラスター化し
FREE
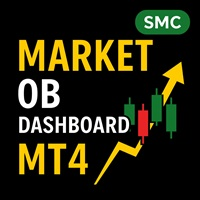
Market Structure Order Block Dashboard MT4 – MetaTrader 4 向け ICT / Smart Money Concepts インジケーター Market Structure Order Block Dashboard MT4 は、 Smart Money Concepts (SMC) と ICT の考え方にもとづいて設計された、MetaTrader 4 用の高度なインジケーターです。 マーケットストラクチャー(構造)、 Order Blocks(オーダーブロック) 、 BOS / ChoCH 、 Fair Value Gaps (FVG) 、 流動性ゾーン(Liquidity Zones) 、 Kill Zones 、 Volume Profile を 1 つのビジュアル・ダッシュボードに集約しています。 本ツールは自動売買 EA ではなく、ポジションを自動で開閉することはありません。 テクニカル分析専用インジケーター として、 FX 、 株価指数 、 貴金属(XAUUSD など) の 価格構造を素早く読み取り、トレードプランを組み立
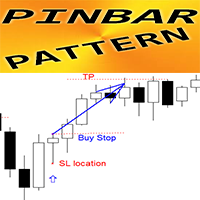
Crypto_Forex インジケーター PINBAR パターン MT4用。リペイントなし、遅延なし。
- インジケーター「PINBARパターン」は、プライスアクション取引に非常に強力なインジケーターです。 - インジケーターはチャート上のピンバーを検出します。 - 強気のピンバー - チャート上に青い矢印シグナルを表示します(画像参照)。 - 弱気のピンバー - チャート上に赤い矢印シグナルを表示します(画像参照)。 - PC、モバイル、メールアラート機能付き。 - インジケーター「PINBARパターン」は、サポート/レジスタンスレベルと組み合わせるのに最適です。
高品質のトレーディングロボットとインジケーターをご覧になるにはここをクリックしてください! これは、このMQL5ウェブサイトでのみ提供されるオリジナル製品です。

高度市場マイクロストラクチャー分析インジケーター 本インジケーターは、価格アクションを極めて細かいレベルで分析し、大きな値動きが起こる前に隠れた不均衡を検出します。従来の「価格だけ」を見るインジケーターとは異なり、 StructureFlow は以下の3つの重要な次元を分析します。 コア分析 ローソク足マイクロストラクチャー ヒゲ/実体の比率分析 実体のレンジ内での位置 拡張/収縮の検出 内部ボラティリティ異常 包み足パターン認識 マーケットテンポ 価格速度の測定 マイクロムーブの加速度 テンポ対比の検出(先行シグナル) 反転確率 パターンクラスタリングアルゴリズム 過去データとの類似度マッチング 加速/拒否の確率 カラーコードシステム ゾーン 色 意味 +50 ~ +100 ライム 強い強気の不均衡 +20 ~ +50 ミディアムシーグリーン 中程度の強気 +5 ~ +20 ダークシーグリーン 弱い強気 -5 ~ +5 グレー 中立 -20 ~ -5 インディアンレッド 弱い弱気 -50 ~ -20 オレンジレッド 中程度の弱気 -100 ~ -50 レッド 強い弱気の不均衡 背景ゾ
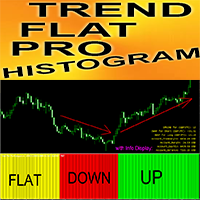
Crypto_Forex MT4用インジケーター「 Trend Flat Pro Histogram 」(リペイント不要)
- 「Trend Flat Pro Histogram」インジケーターは非常に高感度で、標準的な移動平均線よりもはるかに効率的です。 - 現在の市場状況(フラット、上昇トレンド、下降トレンド)を表示するように設計されています。 - インジケーターは3色で表示されます。フラット市場状況は黄色、下降トレンドは赤、上昇トレンドは緑です(色は設定で変更できます)。 - モバイルとPCの両方でアラート機能を搭載しています。 - このインジケーターは、プライスアクション、スキャルピング、モメンタムトレード、その他のインジケーターなど、他の取引手法と組み合わせるのに最適です。 - インジケーターには情報ディスプレイが搭載されており、接続された通貨ペアの現在のスプレッドとスワップが表示されます。 - 画面には、口座残高、エクイティ、マージンも表示されます。 - 情報ディスプレイはチャートの任意の場所に配置できます。
高品質のトレーディングロボットとインジケーターをご覧になる
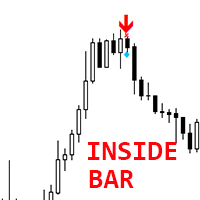
Crypto_Forex インジケーター INSIDE バー パターン (MT4 用)。
- インジケーター「INSIDE バー」は、プライス アクション トレーディングに非常に強力なインジケーターです。 - インジケーターはチャート上の INSIDE バー パターンを検出します: - 強気 INSIDE バー - チャート上の青い矢印シグナル (画像を参照)。 - 弱気 INSIDE バー - チャート上の赤い矢印シグナル (画像を参照)。 - 再描画なし、遅延なし、高い R/R 比率 (報酬/リスク)。 - PC、モバイル、および電子メール アラート付き。 - インジケーター「INSIDE バー パターン」は、サポート/レジスタンス レベルと組み合わせるのに最適です。
高品質のトレーディングロボットとインジケーターをご覧になるにはここをクリックしてください! これは、この MQL5 Web サイトでのみ提供されるオリジナル製品です。
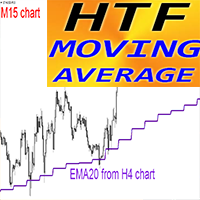
Crypto_Forex インジケーター HTF移動平均線 MT4用
- MT4対応のプロフェッショナルHTF MAインジケーターで、トレード手法をアップグレードしましょう。HTFとはHigher Time Frame(高時間枠)の略です。 - このインジケーターは、プライスアクションエントリーを行うトレンドトレーダーに最適です。 - HTF MAインジケーターを使用すると、高時間枠の移動平均線を現在のチャートに貼り付け、主要なトレンドの方向を追跡できます。 - このインジケーターは高時間枠のトレンドを表示します --> これは常に利益を生む方法です。 - HTF MAインジケーターは、低リスクで大きな利益を得る機会を提供します。
使用方法: - D1からH4またはH1チャートにMAを貼り付けます。 - H4からH1、M30、またはM15チャートにMAを貼り付けます。 - その他(画像を参照)。
高品質のトレーディングロボットとインジケーターをご覧になるにはここをクリックしてください! これは、このMQL5ウェブサイトでのみ提供されるオリジナル製品です。
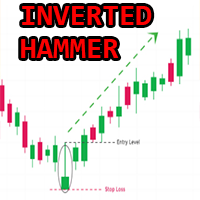
Crypto_Forex MT4用インジケーター「逆ハンマーパターン」。リペイントなし、遅延なし。
- インジケーター「逆ハンマーパターン」は、プライスアクショントレードにおいて非常に強力なインジケーターです。 - インジケーターはチャート上で強気の逆ハンマーを検出します:チャート上に青い矢印シグナルを表示します(画像参照)。 - PC、モバイル、メールでアラート通知が可能です。 - インジケーター「逆ハンマーパターン」は、サポート/レジスタンスレベルと組み合わせるのに最適です。
高品質のトレーディングロボットとインジケーターをご覧になるにはここをクリックしてください! これはMQL5ウェブサイトでのみ提供されるオリジナル製品です。
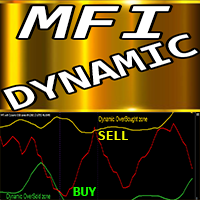
Crypto_Forexインジケーター「 MFI with Dynamic OverSold/OverBought zones 」MT4用、リペイント機能なし。
- Money_Flow_Index (MFI) は、価格と出来高データを用いて売られ過ぎと買われ過ぎのゾーンを特定するテクニカルオシレーターです。 - ダイナミックな買われ過ぎゾーンでは売りトレードを、売られ過ぎゾーンでは買いトレードを行うのに最適です。 - MFIはダイバージェンスの検出に非常に有効で、プライスアクションと組み合わせるのも効果的です。 - ダイナミックな買われ過ぎゾーン - 黄色の線より上。 - ダイナミックな売られ過ぎゾーン - 緑の線より下。 - MFIオシレーターは、強気と弱気の価格モメンタムに関する情報を提供します。 - PCとモバイルアラート機能付き。
高品質のトレーディングロボットとインジケーターをご覧になるにはここをクリックしてください! これは、このMQL5ウェブサイトでのみ提供されるオリジナル製品です。
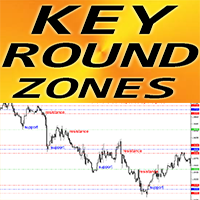
MT4向けFXインジケーター「キーラウンドゾーン」
- インジケーター「キーラウンドゾーン」は、サポート/レジスタンスを重視するトレーダーにとって必須の補助インジケーターです。 - 1000と500のラウンドレベルは価格に反映され、価格が頻繁に反発します。 - 主要な1000レベルには、強力なサポート/レジスタンスゾーン(両側に100ポイント)があります。 - また、1000と500のラウンドレベルは、テイクプロフィット(ラウンドレベルの前)とSL(ラウンドレベルの後)を設定するのに適しています。 - これらのレベルは、特に価格が横ばいまたはフラットなときに有効です。
高品質のトレーディングロボットとインジケーターをご覧になるにはここをクリックしてください! これは、このMQL5ウェブサイトでのみ提供されるオリジナル製品です。
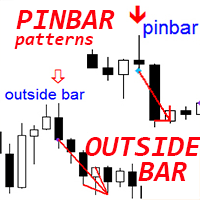
Crypto_Forex MT4用インジケーター「ピンバー&アウトサイドバーパターン」。リペイント不要、遅延なし。
- インジケーター「ピンバー&アウトサイドバーパターン」は、プライスアクション取引に非常に効果的です。 - インジケーターはチャート上のピンバーとアウトサイドバーパターンを検出します。 - 強気パターン - チャート上の青い矢印シグナル(画像参照)。 - 弱気パターン - チャート上の赤い矢印シグナル(画像参照)。 - PC、モバイル、メールアラート機能搭載。 - インジケーター「ピンバー&アウトサイドバーパターン」は、サポートレベル/レジスタンスレベルと組み合わせるのに最適です。
高品質のトレーディングロボットとインジケーターをご覧になるにはここをクリックしてください! これは、このMQL5ウェブサイトでのみ提供されるオリジナル製品です。

TPX Dash Supply Demand A を使用すると、市場全体を360度視野で捉え、需給の関連領域を見つけることができます。
様々なペアを1つの画面でリアルタイムにモニタリングでき、フィルター機能によってアラートの精度をさらに高めることができます。
該当領域への最初のタッチのみアラート 日次市場プロファイル(VAHとVAL)に対する価格ポジショニング 移動平均線の方向(ラリー・ウィリアムズ・システム - Average9) ATRのストップ値と方向 現在価格に最も近いVirgin POCの識別と値 ADXによる方向の強さ 選択したより長い時間枠における移動平均線上のペアの方向 選択したリスク/リワード比率(2:1、3:1、4:1、さらには5:1)のみのアラートを設定できます。
移動平均線フィルターを使用して、マクロトレンドの方向のみにアラートをフィルター処理することで、誤ったシグナルや逆トレンドのシグナルを回避できます。
取引スタイルに関わらず、Dash TPX需給分析は、市場ポジションを把握し、反転しそうな取引を回避するための基本的なツールです。
エントリー価格

After purchasing the Tpx Dash Supply Demand indicator, you must download this indicator which will link and feed market data to the Tpx Dash Supply Demand indicator and will provide all Supply Demand price signals, ATR Stop, VAH and VAL, trend values with the ADX, and POC prices and locations in the market. Just download it and Dash will locate the indicator to retrieve the information!
FREE

Delta Swing Pro - マルチタイムフレーム・トレンド同調システム 製品コンセプト:時間足の矛盾を解消し、真の同調を捉える トレードにおける最大の障壁の一つは、時間足ごとの「方向性の矛盾」です。短期足が上昇を示していても、長期足が下降トレンドにある場合、そのノイズは多くの不必要な損失を招きます。 Delta Swing Pro は、異なる時間足のベクトルを「シンクロ(同調)」させるために設計されました。複数の時間軸が同じ方向へ動き出す「確率的優位性の高い局面」のみを特定し、迷いのない環境認識とエントリー判断を提供します。 5つの核心的な導入メリット 1. トレンド・コンセンサス機能(マルチタイムフレーム分析の最適化) 独自開発のアルゴリズムが、監視している全ての時間足のトレンドベクトルを内部で照合します。 技術的利点: 「短期は買い、長期は売り」といった矛盾を自動的に整理し、大きな資金の流れ(スマートマネー)と一致した方向のみを抽出します。 結果: 複雑なMTF分析をシンプル化し、一貫性のある戦略的な意思決定が可能になります。 2. 視覚的ステータスによる「待つ規

ConfluencePro v2.0 – Ultimate Confluence Indicator for Binary Options & Forex Professional Multi-Filter Signal System with Dashboard, News Filter & Real-Time Statistics ConfluencePro v2.0 is the most advanced confluence-based indicator ever released on the MQL5 Market. It combines 17+ professional filters (Trend, Smart Money Concepts, Market Structure, Divergence, MTF Confirmation, News Events, Volume, Regime Detection and more) into a single, easy-to-read confluence score (0–100%). Only the hi

**Price Action Gold Trader** is a sophisticated, non-repainting multi-timeframe Price Action analysis indicator specifically designed for **XAUUSD (Gold)** trading on MetaTrader 4. This professional-grade tool automatically detects Price Action patterns, provides structured entry zones, precise stop-loss levels, dynamic take-profit targets, and comprehensive market state diagnostics.
Built with systematic trading in mind, this indicator transforms complex Price Action analysis into a fully aut
Shadow Bands Pro – MT4 说明(中英文) English Description (MT4) Shadow Bands Pro – Advanced Reversion System for MT4 Shadow Bands Pro is a non-repainting (on candle close) trend-reversal and mean-reversion indicator designed for traders who need clear, rule-based entries and exits.
By combining a dynamic volatility band, entity-break logic, and a built-in statistics panel, it helps you quickly see where price is stretched and where high-probability reversals may occur. Key Features Non-repainting on
FREE

Advanced Kernel Smoother - Professional Multi-Kernel Regression Indicator The Advanced Kernel Smoother represents a sophisticated approach to price action analysis, utilizing advanced mathematical kernel regression techniques to filter market noise and identify high-probability trading opportunities with exceptional clarity. Core Technology This indicator employs 17 different kernel functions - including Gaussian, Laplace, Epanechnikov, Silverman, and more - each offering unique characteristics
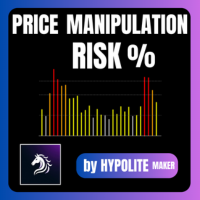
Price Manipulation Risk Indicator Advanced Tool for Market Risk Evaluation & Manipulation Detection Price Manipulation Risk Indicator is a professional tool designed to measure the current risk level in the market.
It evaluates price behavior, market activity, and candle dynamics to detect unstable or potentially manipulated environments. This indicator helps traders avoid traps , filter false signals , and improve timing in both entries and exits. Product Purpose Provide an immediate a
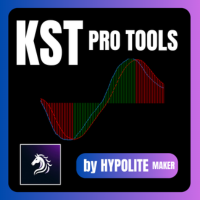
KST Pro Tools – Smart Momentum Indicator Overview KST Pro Tools is an advanced momentum indicator based on Martin Pring’s classic Know Sure Thing (KST) .
It has been redesigned to deliver a clean, instant, and unambiguous momentum reading , thanks to a smart and fully filtered histogram logic. This indicator shows only meaningful momentum , exactly when it matters. Indicator Components KST Line (blue) Measures the true strength of market momentum Built using 4 weighted and smoothed Rate
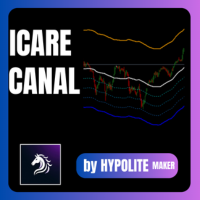
CANAL d'ICARE (Icarus Channel) Master the art of flight and prudence. The ICARUS CHANNEL is the ultimate tool for identifying "Discount" buy zones and "Premium" sell zones in the market. Inspired by the desire to reach new heights, this unique indicator dissects price action into strategic levels around its average. It empowers you to trade with professional discipline, clearly showing when the market is too expensive (Premium) or too cheap (Discount). Key Features and Benefits Base SMA (T

Multi-RSI – 4 RSIs in 1 for Complete Market Analysis Analyze market strength and momentum like a pro! Multi-RSI combines 4 distinct RSIs in a single window , giving you a clear and fast view of market momentum across multiple timeframes. Each RSI has its own configurable period , allowing you to adapt the indicator to your trading strategies and style. Key Features: 4 RSIs in one indicator – track multiple periods simultaneously. ️ Fully customizable periods – adjust each RSI individ

Long-Term Trend Top & Bottom Identification Indicator (Exclusive for Medium-to-Long-Term Trading) I. Core Orientation of the Indicator This indicator is a streamlined analysis tool focused on long-term market trends , designed to identify top and bottom inflection points for trading varieties such as forex and precious metals. By filtering out interfering signals from small-to-medium cycles, it provides clear guidance for medium-to-long-term trading decisions. II. Core Functions & Chart Pr

Band Levels Plus Bands 2.1 product description: Band Levels Plus Bands is a precision‑engineered Bands indicator designed for traders who demand both audit clarity and visual elegance. Unlike standard bands, it layers both horizontal Band price lines and multiple deviation bandwidth classes (±1.75, ±3.5, ±4.5) to give you a richer sense of volatility zones and potential breakout levels. Every band is drawn as a continuous curve across history, while horizontal reference lines mark the curre
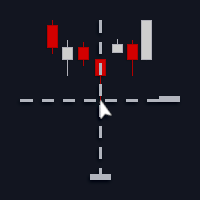
シンプルなクロスヘアインジケーターです。 【主な機能・特徴】 マウスカーソルに追従する価格・時間の十字ガイドラインを表示し、チャート上の情報を直感的に確認できるようになります。 計算処理を最小限に抑えた設計のため、動作が軽く、チャートの負荷をほとんど増やしません。 マウスカーソルがチャート外に出た場合は、自動的にクロスヘアが消えるため、不要な表示が残りません。
【こんな方におすすめ】 環境認識の効率を上げたいと感じている方 チャートをシンプルかつ実用的にカスタマイズしたい方 高値・安値・ネックラインなどを、直感的かつ正確に確認したい方
【使い方】 対象のチャートに「Ast Crosshair」を適用すれば、すぐに使用できます。 チャート上で、価格・時間に沿った十字のガイドラインがマウスカーソルに追従するようになります。 必要であれば、使用環境に応じて色やオフセット等のパラメーターを調整してください。
【パラメーター一覧】 Crosshair color
クロスヘア(縦線・横線)の色を指定します。 Horizontal offset
縦線の横方向オフセットをピクセル単位で調整し
FREE
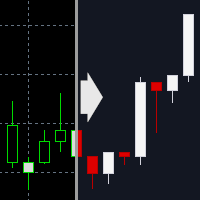
MetaTrader 4 のチャートをダークテーマに切り替えるインジケーターです。 視認性を重視しつつ、長時間のチャート監視でも目の負担を減らせるよう、落ち着いた配色を目指しました。 全チャートに一括適用する機能も選択でき、適用後は自動でインジケーターが削除されるため、余計な常駐インジケーターやオブジェクトは残りません。
【こんな方におすすめ】 MT4 の見た目を簡単に整えたい方 明るいチャートが眩しく感じる方 長時間のチャート監視で、目の負担を減らしたい方
【使い方】 対象のチャートを開き、「Ast ChartTheme Dark for MT4」を適用します。 必要に応じて [Settings] / [Colors] のパラメーターを変更します。 OK を押すと、チャートがダークテーマに切り替わります。
【パラメーター一覧】 Settings(設定) Apply to all open charts
現在のチャートのみ適用するか、開いている全チャートに同じテーマを適用するかを選びます。 Remove indicator after applying theme
テーマ適用
FREE
TCM Breakeven Calculator Pro is the ultimate utility for professional traders. It automatically calculates the Weighted Average Entry Price for all your open positions on the current symbol. It draws a clear line on the chart and displays a smart dashboard panel showing exactly where you need the price to go to exit with $0.00 loss . Key Features: Zero Lag: Built with high-speed event handling. Updates instantly on every tick and trade modification. Smart Dashboard: Displays the exact A
FREE

Price Action Dashboard Pro - ダウ理論とプライスアクションに基づく環境認識ユーティリティ 製品コンセプト:聖杯探しの旅を終え、価格の真実へ回帰する 多くのトレーダーが複雑なアルゴリズムの森で迷子になり、最も重要な真実を見失っています。それは**「価格こそが全て(Price is King)」**という事実です。 Price Action Dashboard Pro は、あなたを不確かなロジックの追求から連れ戻し、100年前から機能し続ける「ダウ理論」と「プライスアクション」という王道へ立ち返らせるための羅針盤です。一過性の流行に左右されず、相場の原理原則に基づいた規律あるトレード環境を提供します。 5つの核心的な導入メリット 1. [READY → GO] 2段階認証プロトコルによる感情の排除 独自の「準備と執行」プロセスを採用。セットアップが形成される「READY」段階と、シグナルが確定する「GO」段階を明確に分けることで、安全装置(セーフティ)の役割を果たします。 技術的利点: 動き出したローソク足に焦って飛び乗る「感情的なエントリー」を物理的

his indicator automatically identifies key support and resistance levels by analyzing volume patterns. Unlike traditional S/R tools that rely only on price, Volume S/R finds levels where the market truly reacted. DETECTION LOGIC: - High Volume Zones: Price levels where strong buying/selling occurred - Low Volume Zones: Areas of weak interest - potential breakout or reversal zones
SMART FILTERING: - Nearby levels are automatically merged to avoid chart clutter - Maximum levels limit keeps yo
FREE
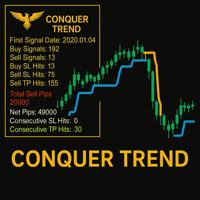
Conquer Trend – Master the Trend Like Never Before! Conquer Trend is your ultimate solution for dominating the markets with precision and simplicity. Built for traders who want to ride the strongest trends across any pair and any time frame, this powerful indicator brings together trend detection, retest confirmation, and performance tracking — all in one streamlined tool.
Multi-Timeframe Trend Analysis Get a clear view of the trend across multiple timeframes. Whether you're scalping, day tra

Quantum Frequency Indicator (QFI) The World’s First Universal Market Frequency Analyzer for MT4 Trade Forex, Crypto, and Stocks With Up To 98% Accuracy Discover the Indicator That Decodes the Hidden Frequency of the Market After 14 years of research into market vibration and frequency science, a revolutionary breakthrough has arrived. The Quantum Frequency Indicator (QFI) reads the internal frequency of any financial market and generates ultra-precise Buy & Sell signals—before major moves
TR CPR Pivots – Professional Daily Levels
TR CPR Pivots is a professional technical indicator that automatically calculates Central Pivot Range (CPR) and Daily Pivot Levels based on the previous day’s High, Low, and Close .
Designed for clean charts, precision trading, and EA compatibility, this indicator delivers accurate institutional-style levels widely used by professional traders across Forex, indices, metals, and crypto. Key Features Automatic Central Pivot Range (PV / TC / BC) D

Raymond Cloudy Day Indicator for MT4 – Pivot-Based Reversal and Trend Levels Raymond Cloudy Day Indicator is a pivot-based level indicator for MetaTrader 4 (MT4). It was developed by Ngo The Hung based on Raymond’s original idea and is designed to give a structured view of potential reversal zones, trend extensions and support/resistance levels directly on the chart. The default settings are optimised for XAUUSD on the H1 timeframe, but the indicator can be tested and adjusted for other symbols

The "One-Click" Breakout Monitor Never Miss a Breakout Again. Price Alert Line is designed for traders who need speed and simplicity. Instead of navigating complex menus to set price alerts, this tool places a button directly on your chart. With a single click, you can deploy a horizontal line that monitors price action and alerts you immediately when the price crosses it. New Feature (Smart UI): The control buttons now automatically adapt to match your line colors. If you set your resis

左右交易的其实都是情绪,把握情绪才是交易最终能够获得盈利的关键。
所以我这是一个「趋势氛围灯」指标,它能为您的交易图表做三件事: 1. 一眼识别市场状态 深蓝色背景 → 市场处于 强劲多头氛围 深红色背景 → 市场处于 强劲空头氛围 深灰色背景 → 市场处于 震荡平衡状态 2. 提供直观的视觉辅助 将复杂的多空力量对比 转化为最直观的背景色 让您 无需分析数据 就能感受市场情绪 在多个图表间切换时能 瞬间把握每个品种的当前强弱 3. 辅助交易决策 避免在强势多头时逆势做空 避免在强势空头时逆势做多 在震荡行情中提醒您保持观望或采用区间策略 本质上,它就像为您的交易图表安装了一个「情绪指示灯」,用颜色告诉您市场此刻的“性格”是强势上涨、强势下跌还是犹豫不决.

Accurate Signal ARC is a non-repainting trend & reversal signal indicator designed for MT4 .
It uses ATR-weighted volatility logic combined with adaptive price channels to detect high-probability BUY and SELL points directly on the chart. How It Works Calculates a dynamic volatility channel using weighted ATR Detects trend direction (river state) and switches only when price decisively breaks the channel Filters noise using spread-aware true range Draws clear arrows : Lime Arrow → BUY si
FREE

Overview
Alpha News Shield is an MT4 indicator designed to help you plan and reduce trading activity around scheduled economic events.
It displays upcoming events on the chart (panel, countdown, and optional vertical lines) and can control terminal-wide protection using global variables.
When the protection window is active, the indicator can set a “trading allowed” flag that other Expert Advisors can read before sending new orders.
Optional auto-close rules can close positions before selected e

Indicator Name: "The Range Master" Core Purpose The Range Master is an advanced, multi-timeframe technical indicator designed to identify market consolidation (sideways ranging) and subsequent high-momentum breakout opportunities. It helps traders visually confirm when price action transitions from low-volatility accumulation to high-volatility trend initiation. ️ Functional Description (What it Does) The Range Master performs three primary, interconnected functions: Range Mapping , Breakout
FREE

The MA ribbon is not a single indicator but rather an overlay of multiple moving averages (typically four to eight or more) of varying lengths plotted on the same price chart. Visual Appearance: The resulting lines create a flowing, ribbon-like pattern across the price chart. Components: Traders can use different types of moving averages, such as Simple Moving Averages (SMA) or Exponential Moving Averages (EMA), and adjust the time periods (e.g., 10, 20, 30, 40, 50, and 60 periods) to suit t
FREE
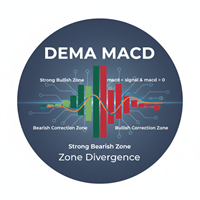
Indicator: The DEMA MACD Zone Divergence This is a powerful, multi-timeframe trend-following indicator based on the Moving Average Convergence Divergence (MACD) , but enhanced using Double Exponential Moving Averages (DEMA) for reduced lag. Its main function is to paint the background of the price chart with color-coded rectangular zones, clearly signaling the current momentum phase and potential shifts in market control (bullish or bearish). Core Purpose To visually map the strength and phas
FREE
Multi Signal Radar 2.0 – BUY SELL Signal Indicator MT4 MT5 (Non-Repaint) Clean, Confidence-Based BUY & SELL Signals Multi Signal Radar 2.0 is a clean and intelligent trading signal indicator designed to highlight high-probability BUY and SELL opportunities without cluttering your chart. All calculations are performed internally, while the chart remains minimal — only arrows, a real-time confidence dashboard, and a candle countdown timer are displayed.
This makes Multi Signal Radar ideal for tra

User Controls for BandLevels+Plus 1.0 This indicator extends standard band levels by plotting seven horizontal lines (three upper, one middle, three lower) based on multiple deviations. Buyers have full control over the following inputs: Band Calculation Settings • Period (BB_Period) → Define the moving average period used for band calculations • Shift (BB_Shift) → Shift bands forward/backward on the chart • Applied Price (BB_Applied_Price) → Choose the price type (Close, Open, High, Low,

Drop & Volatility Shield Monitor – Volatility/Spread Status Bar (MT4) Overview Drop & Volatility Shield Monitor is an MT4 chart visualization indicator that turns current market conditions into a simple color status bar at the top of the chart. It does not generate entries and it does not place, modify, or close any orders.
Instead, it highlights when conditions are: NORMAL (green) – regular conditions COOL (red) – high volatility, sharp drops, or abnormal spread (cool-down zone) RECOV (orange)
FREE

Grid Vision TP and NP (World Edition) Grid Vision TP and NP is a visual helper indicator for grid / averaging style trading.
This is a chart visualization tool only. It does not place, modify, or close any orders. It shows you, directly on the chart: where your basket average price is at which price your basket will reach a target profit in money at which price your basket will hit a maximum loss in money (optional) how many grid / averaging steps you still have until your risk limit It works w
FREE

Session Shade (MT4) – Non-Trading Hours Background Shading Overview Session Shade is a lightweight MT4 chart utility indicator that visually highlights non-trading hours by shading the chart background.
It is designed to help you confirm your daily time-filter window at a glance. This is a visualization tool only. It does not generate trading signals and it does not place, modify, or close any orders. Key features Shades non-trading hours (NG) on the chart background Keeps trading hours (OK) cl
FREE

Breakout Quality Score (BQS) (MT4) – Breakout Strength Scoring (0–100) Overview Breakout Quality Score (BQS) is an MT4 indicator that scores breakout quality from 0 to 100, helping you quickly evaluate breakout strength using a rule-based approach. This is a visualization/alert tool only. It does not place, modify, or close any orders. What BQS provides 0–100 scoring for breakout strength Strong-only focus via a configurable threshold (example default: 80+) On-chart numeric labels for quick visu

このインジケーターは、反転ポイントと価格戻りゾーンを正確に表示します。 主要プレーヤー 。新たなトレンドが形成される場所を把握し、最大限の精度で意思決定を行い、すべての取引をコントロールします。 TREND LINES PRO インジケーターと組み合わせることで、その潜在能力を最大限に発揮します。 VERSION MT5 インジケーターが示す内容:
新しいトレンドの始まりに活性化する反転構造と反転レベル。 リスクと報酬の比率を最小限に抑えた利益 確定 と 損失停止の レベルの表示 RR 1:2 。 インテリジェントな削減ロジックによるストップロス。 指定されたインジケーターから 2 つのトレンド タイプの反転パターンを表示します。 指標: トレンドを追う TREND LINES PRO (世界的なトレンドの変化) TREND PRO (クイックトレンド変更) シンプルで効果的 スキャナー リアルタイムトレンド(新機能)。 マルチタイムフレームのインストゥルメント フィルタリング。 画面 利益 LOGIC AI信号の後。 当日プラス方

トレンドラインプロ 市場の真の方向転換点を理解するのに役立ちます。この指標は、真のトレンド反転と主要プレーヤーが再び参入するポイントを示します。
分かりますか BOSライン 複雑な設定や不要なノイズなしに、より長い時間足でのトレンドの変化と重要なレベルを把握できます。シグナルは再描画されず、バーが閉じた後もチャート上に残ります。 VERSION MT 5 - RFI LEVELS PRO インジケーター と組み合わせることで、その潜在能力を最大限に発揮します。 インジケーターが示す内容:
本当の変化 トレンド(BOSライン) 一度シグナルが現れたら、それは有効です!これは、リペイント機能を持つインジケーターとの重要な違いです。リペイント機能を持つインジケーターは、シグナルを発した後、それを変更し、資金の損失につながる可能性があります。これにより、より高い確率と精度で市場に参入できます。また、矢印が現れた後、目標値(利益確定)に達するか、反転シグナルが現れるまで、ローソク足の色を変更する機能もあります。 繰り返しエントリ 主要プレーヤーの
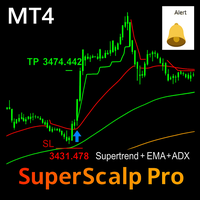
SuperScalp Pro – Supertrend-Based Multi-Filter Scalping Indicator (MT4)
SuperScalp Pro is a professional scalping indicator for MetaTrader 4, built around the Supertrend and enhanced with a multi-layer technical filtering system. It is designed to help traders identify high-quality BUY/SELL signals with clear visual guidance and reduced false entries, especially on lower timeframes.
MT5 Version Available : A dedicated SuperScalp Pro MT5 version is offered separately, with a structure and optim

Position Size Calculator PRO MT4 V2.0 – ロット計算 + SL/TP 可視化ゾーン(ドラッグ&ドロップ)で高速・正確なリスク管理 Position Size Calculator PRO MT4 V2.0 は MetaTrader 4 用の ポジションサイジング (資金管理 / Money Management)インジケーターです。 1回の取引リスク 、 Stop Loss までの距離、そして銘柄情報(tick value / tick size / 必要証拠金 / レバレッジ等)をもとに、 最適なロットサイズ を自動計算します。 V2.0 は大幅アップデートです。パネルを見るだけではなく、 チャート上で直接トレードを操作 できるようになりました。 SL/TP の可視化ゾーン 、 BUY/SELL 切替 、そして ワンクリック調整 (Risk % / R:R / ATR)により、より実践的なワークフローを実現します。 V2.0 の主な新機能 BUY & SELL を完全サポート (1クリックで方向切替)。 新しい チャート上のインタラクティブゾーン

このインジケーターは、余計なノイズのない「正確でクリーンなシグナル」を重視するトレーダーのために作られた、シンプルで非常に信頼性の高いトレンド方向予測ツールです。 主な特徴 トレンド予測矢印 – 明確な買い/売りシグナル。 低頻度だが高精度 – 1日1回程度の高品質シグナル。 Exitシグナル搭載 – 最適な決済ポイントを表示。 リペイントなし – 矢印は表示後に変化しません。 バッファ搭載 – EA開発やカスタムツールに最適。 アラート搭載 – ポップアップ、サウンド、プッシュ通知。 矢印サイズ調整可 – 視覚面を完全カスタマイズ。 EA向けに最適 – SL/TP不要。
Exit矢印だけで長期ドローダウンを防止。 11年以上のMQL経験で開発 – 非常に優れたリワードレシオ。
精度は 約70%勝ち / 30%負け 。 誇張なし・嘘なし – 試して自分で確認してください。 推奨通貨ペア AUDUSD, EURGBP, USDCHF, AUDJPY, EURUSD。 推奨タイムフレーム M5、M15。
MT5版やEAが必要な場合 ご連絡ください。
Interactive AVWAP Pro — TradingView-Style Analysis Interactive AVWAP Pro is the most convenient Anchored Volume-Weighted Average Price (AVWAP) indicator for MetaTrader 5/4. Forget standard, clumsy tools. We brought the intuitive drag-and-drop functionality of TradingView right into your MT5/4 terminal. The Advantage of a Professional Tool Stop cluttering charts with vertical lines and fiddling with awkward settings. Interactive AVWAP Pro gives you unparalleled speed and accuracy in anal

スイングトレードコンセプト
目的
スイングトレード向けに設計されたMT4インジケーターです。スーパートレンドロジックを用いてトレンド反転を捉え、自動フィボナッチレベルによるTPポイントを表示します。
仕組み
1. トレンド追跡
ATRベースのスーパートレンドアルゴリズムを採用。価格トレンドが転換した際にシグナルを発します。
2. シグナル生成
トレンドが上昇反転 → 緑のBUYボックス+矢印(ローソク足下)
トレンドが下降反転 → 赤のSELLボックス+矢印(ローソク足上)
3. フィボナッチ目標値
7つのレベルを自動描画:
SL: ストップロス
エントリー: エントリーポイント
TP 1-2-3-4: 利益確定目標値
CP: ポジション決済
全レベルは点線で表示され、価格が横に表示されます。
機能概要
自動シグナル: 買い/売りボックスと矢印
フィボナッチレベル: TP1-TP4の自動計算
ATRベース: 全通貨ペア(外国為替、金、暗号資産)で安定動作
クリーンな表示:グリッドは自動で閉じ、右側にスペースを確保
ズーム対応
スマートシンボルスイッチャー - 高度なチャートナビゲーションツール スマートシンボルスイッチャーでトレーディングワークフローを効率化しましょう。これは、効率的なマルチシンボルおよびマルチタイムフレーム管理のために設計された強力なMT4インジケーターです。カスタマイズ可能なキーボードショートカットで、銘柄とチャート期間をシームレスに切り替え、超高速実行を実現します。 機能には、カラフルまたはシンプルな列レイアウトによる柔軟な表示オプション、最適な表示のための調整可能なズーム機能、ワークスペースを整理するための便利な非表示機能が含まれます。シンボルを手動で追加するか、自動検出でウォッチリストを作成できます。直感的なドラッグアンドムーブインターフェースにより、お好みに応じて要素を整理および再配置できます。 複数のチャートを管理するアクティブトレーダーに最適なスマートシンボルスイッチャーは、繰り返しのクリックを排除し、プロフェッショナルグレードのチャートコントロールにより、トレーディング効率を向上させます。 主な機能: シンボルとタイムフレームの即座の切り替え カスタマイズ可能なキーボードシ

TrendBite v1.5 - プロフェッショナルトレンド追跡インジケーター 開発者: 8aLt4 バージョン: 1.5 プラットフォーム: MetaTrader 4
概要 TrendBite v1.5 は、市場のトレンドの変化を検知し、投資家に明確な売買シグナルを提供するために設計された、高度なテクニカル分析インジケーターです。ボリンジャーバンドのアルゴリズムに基づいて、トレンドの転換を正確に捉えるこのツールは、初心者にも経験豊富なトレーダーにも最適です。
主な機能 トレンドの検知 自動トレンド分析:市場の上昇トレンドと下降トレンドを瞬時に検出 ボリンジャーバンドベース:信頼性の高い数学的モデルに基づく計算システム 視覚的な明瞭さ:緑(上昇)と黄色(下降)のヒストグラムバーでトレンド状況を明確に表示 売買シグナル 緑色の矢印(↑):買い機会を示します 赤色の矢印(↓):売り機会を示します 明確な視覚化:トレンドラインにより、ポジションの方向を簡単に追跡できます ヒストグラム表示:トレンドの強さを視覚的に評価可能 警告システム 音声警告:新しいシグナルが発生すると自動
FREE

インジケーター: Currency Strength Meter Pro 市場の全体像を可視化 (Market Breadth Visualization) 長所: 複雑なチャートを見る代わりに、整理された「ダッシュボード」形式で表示します。トレーダーは一目で最強・最弱の通貨ペアを把握できます。 メリット: 個別のチャートを確認する時間を節約し、取引する通貨ペアの選定を迅速化します。 自動ランク付けと並べ替え (Auto-Ranking & Sorting) 長所: 「水平ランキング」モードを搭載し、通貨ペアを「最強」から「最弱」へと自動的に並べ替えます。 メリット: 日次/週次/月次の勝者 (Winners) と敗者 (Losers) を即座に特定でき、相対強度戦略の核心となります。 スマート通貨ロジック (Smart Currency Logic) 長所: 垂直モードでは、ベース通貨の位置が異なるペア(例:EURUSD 対 USDJPY)をスマートに処理します。メイン通貨(例:USD)の強弱に合わせて数値を自動的に「反転」させます。 メリット: 通貨ペアの並び順による分析の混乱を減
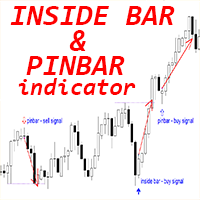
Crypto_Forex MT4用インジケーター「インサイドバー&ピンバーパターン」。リペイント不要、遅延なし。
- インサイドバー&ピンバーパターンは、プライスアクショントレードに非常に効果的です。 - インジケーターはチャート上のインサイドバーとピンバーパターンを検出します。 - 強気パターン - チャート上の青い矢印シグナル(画像参照)。 - 弱気パターン - チャート上の赤い矢印シグナル(画像参照)。 - インサイドバー自体のR/R比(リワード/リスク)が高い。 - PC、モバイル、メールアラート機能付き。 - インサイドバー&ピンバーパターンは、サポート/レジスタンスレベルと組み合わせるのに最適です。
高品質のトレーディングロボットとインジケーターをご覧になるにはここをクリックしてください! これは、このMQL5ウェブサイトでのみ提供されるオリジナル製品です。
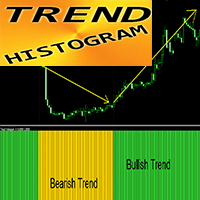
Crypto_Forex MT4用インジケーター「 TREND Histogram 」(リペイント不要)
- TREND Histogramインジケーターは、標準的な移動平均線クロスよりもはるかに高感度で効率的です。 - インジケーターの色は2色から選択可能:弱気トレンドは黄色(金色)、強気トレンドは緑(色は設定で変更できます)。 - TREND Histogramには、モバイルとPC向けのアラート機能が組み込まれています。 - このインジケーターは、プライスアクション、VSA、その他のインジケーターなど、他の取引手法と組み合わせるのに最適です。
高品質のトレーディングロボットとインジケーターをご覧になるにはここをクリックしてください! これは、このMQL5ウェブサイトでのみ提供されるオリジナル製品です。
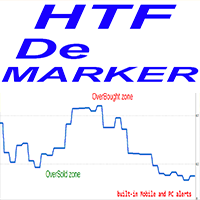
Crypto_Forex インジケーター HTF DeMarker for MT4。
- このインジケーターは、テクニカル トレーダーがエントリー ポイントとエグジット ポイントを見つけるために使用する便利なツールです。HTF は、Higher Time Frame を意味します。 - DeMarker オシレーター ラインは、以前の高値と安値に対する現在の価格位置を示します。 - DeMarker は、他のオシレーターの中で最も効率的な定期的なダイバージェンス シグナルを提供します。 - OverBought ゾーンは、DeMarker が 0.7 を超える場合、OverSold ゾーンは、0.3 を下回る場合です。 - インジケーターには、モバイルおよび PC アラートが組み込まれています。 - このインジケーターは、プライス アクション エントリーを使用するマルチタイム フレーム トレーディング システム、または他のインジケーターとの組み合わせに最適です。 - HTF DeMarker インジケーターを使用すると、Higher Time Frame の DeMarker を現
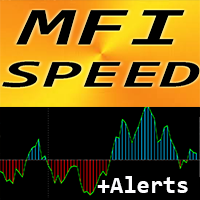
Crypto_Forex MT4用インジケーター「 MFI Speed 」(リペイント機能なし)
- このインジケーターの計算は物理学の方程式に基づいています。MFI SpeedはMFI自体の1階微分です。 - Money_Flow_Index (MFI)は、価格と出来高データを用いて売られ過ぎと買われ過ぎのゾーンを特定するテクニカルオシレーターです。 - MFI Speedは、主要トレンドの方向へのモメンタムエントリーをスキャルピングするのに適しています。 - 適切なトレンドインジケーター(例えば、標準EMA(画像参照)など)と組み合わせて使用してください。 - MFI Speedインジケーターは、MFI自体がどれだけ速く方向転換するかを示します。非常に敏感です。 - MFI Speedインジケーターの値が0未満の場合、速度は負です。値が0より大きい場合、速度は正です。 - インジケーターにはモバイルとPCのアラートが組み込まれています。
高品質のトレーディングロボットとインジケーターをご覧になるにはここをクリックしてください! これは、このMQL5ウェブサイトでのみ提供さ
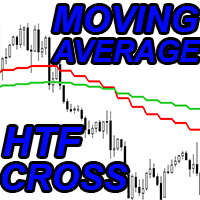
Crypto_Forex MT4用インジケーター「HTF移動平均線クロス」
- 強力なMT4用HTF移動平均線クロスインジケーターで、トレード手法をアップグレードしましょう。HTFとは、より長い時間枠での取引を意味します。 - このインジケーターは、プライスアクションエントリーを行うトレンドトレーダーに最適です。 - より長い時間枠の高速移動平均線と低速移動平均線を現在のチャートに貼り付けることができます。これはプロフェッショナルな手法です。 - HTF移動平均線クロスには、モバイルとPCの両方に対応したアラート機能が組み込まれています。 - このインジケーターは、低リスクで十分な利益を得る機会を提供します。
高品質のトレーディングロボットとインジケーターをご覧になるにはここをクリックしてください! これは、このMQL5ウェブサイトでのみ提供されるオリジナル製品です。
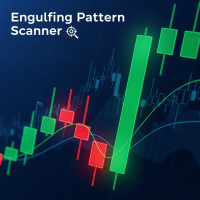
バージョン 4.4 柔軟な確認システムを備え、短期の時間枠でエングルフィングパターンを検出するためのプロフェッショナルなインジケーターです。
主な機能:
柔軟な時間枠設定
確認のための下限時間枠を完全にカスタマイズ可能
M1-M5-M15、M5-M15-H1、M15-H1-H4など、任意の組み合わせで使用可能
あらゆる取引スタイルと戦略に対応
3段階のシグナル確認
弱確認(時間枠をカスタマイズ可能)— 黄色の矢印
中確認(時間枠をカスタマイズ可能)— 青色の矢印
強確認(時間枠をカスタマイズ可能)— 緑/赤色の矢印
再描画なしの安定した運用
矢印は一度描画され、消えることはありません
確認にはクローズドローソク足のみを使用
偽トリガーに対する保護
あらゆる取引スタイルに対応
スキャルパー向け:M1-M2-M5
デイトレーダー向け:M5-M15-H1
スイングトレーダー向け:M15-H1-H4
長期投資家向け: H1-H4-D1
スマート通知システム
アラートは、現在のバーで関連するシグナルに対してのみ送信されます。
インジケーター追加時に古い
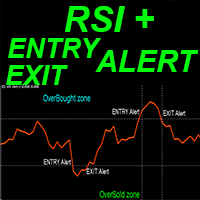
Crypto_Forex MT4用インジケーター「 RSI with Alerts 」(リペイント機能なし)
- RSIは、取引で最も人気のあるオシレーターの一つです。 - PCとモバイルの両方に、売られ過ぎ/買われ過ぎゾーンへのエントリーと、売られ過ぎ/買われ過ぎゾーンからの決済の両方に対応したアラート機能を搭載しています。 - アラート発動のトリガーレベルを調整できます。 - このインジケーターは、モメンタムトレードシステムに最適です。 - 強い買われ過ぎゾーン(70以上)からの売りエントリー、強い売られ過ぎゾーン(30以下)からの買いエントリーに最適です。 - RSI自体は、ダイバージェンスの検出に非常に役立ちます。 - このインジケーターは、あらゆる時間枠で使用できます。 - このインジケーターは、プライスアクションテクニックと組み合わせるのにも最適です。
高品質のトレーディングロボットとインジケーターをご覧になるにはここをクリックしてください! これは、このMQL5ウェブサイトでのみ提供されるオリジナル製品です。
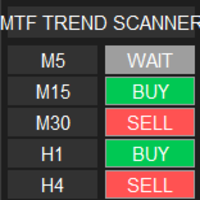
MTF Trend Scanner(マルチタイムフレーム・トレンドスキャナー) は、複数の時間足におけるトレンドの一致を一目で確認できるプロ仕様の分析ツールです。 インジケーターは M5、M15、M30、H1、H4 のトレンド状況をリアルタイムで表示するコンパクトなダッシュボードを提供します。チャートを切り替える必要はありません — 必要な情報はすべて一つのパネルに集約されています。 仕組み このインジケーターは次の2つの実績あるテクニカル手法を組み合わせています: 移動平均線のクロス(高速 EMA vs 低速 EMA) RSI フィルター(50ラインより上/下) シグナルロジック: 買い :高速 MA > 低速 MA かつ RSI > 50 売り :高速 MA < 低速 MA かつ RSI < 50 待ち :条件が混在(明確なトレンドなし) 主な特徴 リアルタイム更新(500ms 更新 + ティックごと) モダンで見やすいダークテーマ 色分けセルで瞬時に状況把握 パラメーター完全カスタマイズ可能 軽量で CPU 負荷が少ない すべての銘柄・時間足で使用可能 リペイントなし — シグナ
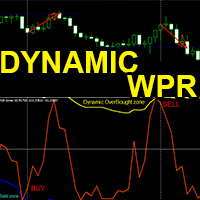
Crypto_Forex MT4用インジケーター「 WPR with Dynamic OverSold/OverBought zones 」(リペイント機能なし)
- WPRはスキャルピングに最適なオシレーターの一つです。 - ダイナミックな買われすぎゾーンから売りエントリー、ダイナミックな売られすぎゾーンから買いエントリーを取るのに最適です。 - このインジケーターはプライスアクションエントリーと組み合わせるのも効果的です。 - ダイナミックな買われすぎゾーン - 黄色の線より上。 - ダイナミックな売られすぎゾーン - 青い線より下。 - このインジケーターは価格調整を早期に把握する機会を提供します。 - PCとモバイルの両方でアラート機能付き。
高品質のトレーディングロボットとインジケーターをご覧になるにはここをクリックしてください! これは、このMQL5ウェブサイトでのみ提供されるオリジナル製品です。
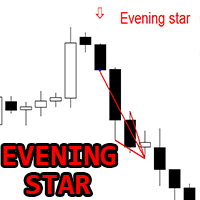
Crypto_Forex MT4用インジケーター「 Evening Star パターン」。リペイント不要、遅延なし。
- インジケーター「Evening Starパターン」は、プライスアクショントレードに非常に強力なインジケーターです。 - このインジケーターは、チャート上で弱気なEvening Starパターンを検出します。チャート上に赤い矢印シグナルが表示されます(画像参照)。 - PC、モバイル、メールアラート機能付き。 - 兄弟機種である強気な「Morning Starパターン」インジケーターもご利用いただけます(下記リンクをご覧ください)。 - インジケーター「Evening Starパターン」は、サポート/レジスタンスレベルと組み合わせるのに最適です。
高品質のトレーディングロボットとインジケーターをご覧になるにはここをクリックしてください! これは、このMQL5ウェブサイトでのみ提供されるオリジナル製品です。
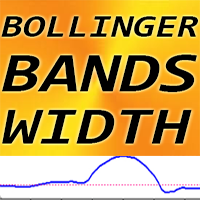
Crypto_Forex MT4 用インジケーター「ボリンジャーバンド幅」、リペイント機能なし。
- ボリンジャーバンド幅インジケーターは、標準のボリンジャーバンドインジケーターと併用するように設計されています。 - この取引ツールは、ボリンジャーバンドインジケーターを使用するすべてのトレーダーにとって必須です。これらの組み合わせは、ブレイクアウトトレードにおいて非常に効果的です。 - ボリンジャーバンド幅インジケーターは、ボリンジャーバンド間の距離(スパン)を表示します。
ボリンジャーバンド幅の使い方(画像の例を参照): 1) 過去6ヶ月間のボリンジャーバンド幅の最低値を探し、その値に25%を加算してブレイクアウトレベルを求めます。 2) ボリンジャーバンド幅インジケーターにブレイクアウトレベルを設定します。また、ボリンジャーバンドインジケーターをチャートに設定します。 3) 価格がボリンジャーバンドインジケーターの境界線の間で横ばいになり、ボリンジャーバンド幅の値がブレイクアウトレベルを下回るまで待ちます。 4) ボリンジャーバンドインジケーターの境界線をブレイクアウトするの
MetaTraderマーケットは、履歴データを使ったテストと最適化のための無料のデモ自動売買ロボットをダウンロードできる唯一のストアです。
アプリ概要と他のカスタマーからのレビューをご覧になり、ターミナルにダウンロードし、購入する前に自動売買ロボットをテストしてください。完全に無料でアプリをテストできるのはMetaTraderマーケットだけです。
取引の機会を逃しています。
- 無料取引アプリ
- 8千を超えるシグナルをコピー
- 金融ニュースで金融マーケットを探索
新規登録
ログイン