Vortex oscillator mt4
- インディケータ
- バージョン: 1.0
- アクティベーション: 20

VORTEX OSCILLATOR: The Power of Volume Flow
VORTEX OSCILLATOR is an advanced trading tool that transforms the classic Vortex indicator into a highly responsive precision oscillator. Designed for traders who demand absolute clarity, it merges price action and volume to reveal the true strength behind every market movement.
What Makes VORTEX OSCILLATOR Unique
Most indicators simply follow price, often resulting in late entries. VORTEX OSCILLATOR utilizes a mathematical approach centered on Volume-Weighted Flow. It does not just show you where the price is going; it tells you if the market has the necessary energy to sustain the trend.
Technical & Visual Structure
-
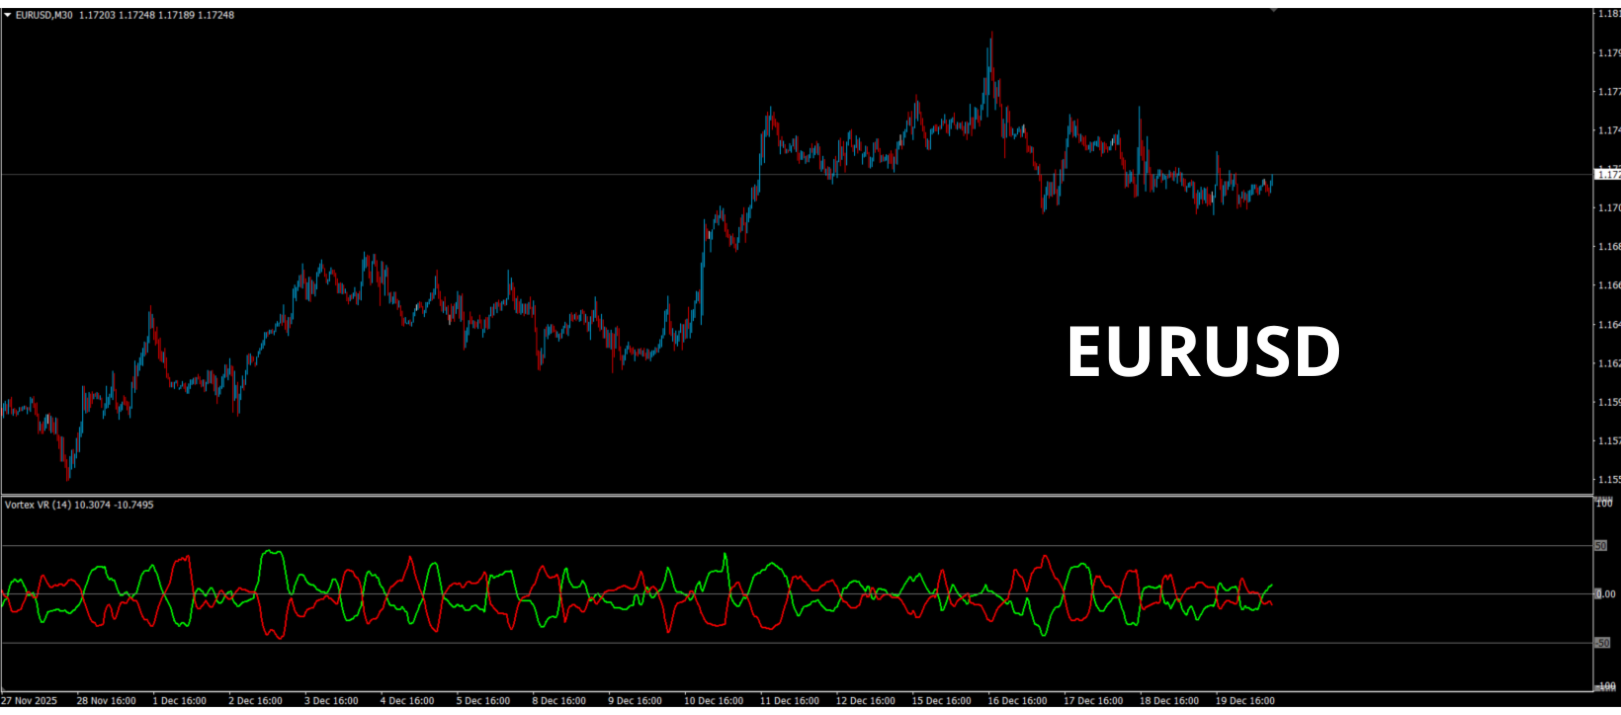
Normalized Scale (-100 to +100): A standardized reading for all assets. No need to adjust your benchmarks based on volatility.
-
Zero Pivot Line: The clear boundary between buyers and sellers. Simple, sharp, and efficient.
-
Momentum Zones (+50 / -50): Instantly identify acceleration phases to capture the start of a trend.
-
Dual Dynamic Curves:
-
Green Line: Buying power (Bullish pressure).
-
Red Line: Selling power (Bearish pressure).
-
How to Trade with VORTEX OSCILLATOR
The design is intuitive for both scalpers and swing traders:
-
Confirmation Crossover: Enter a long position when the green line crosses above the red line.
-
Zero Line Filter: For maximum security, wait for the dominant line to cross the 0 level. This confirms the trend is backed by volume.
-
Exit Strategy: Exit your position as the lines converge toward the 0 level, indicating a loss of momentum.
Product Features
-
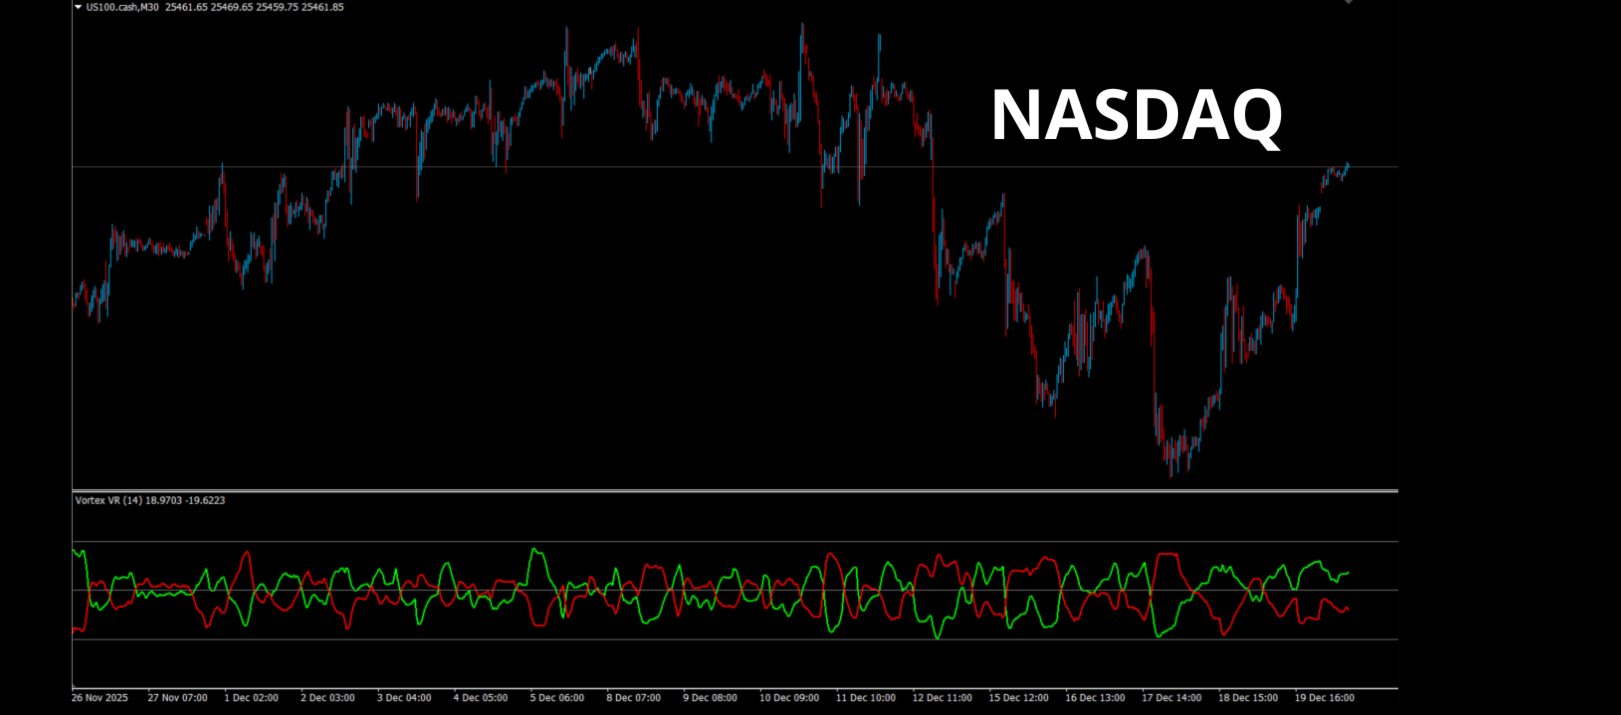
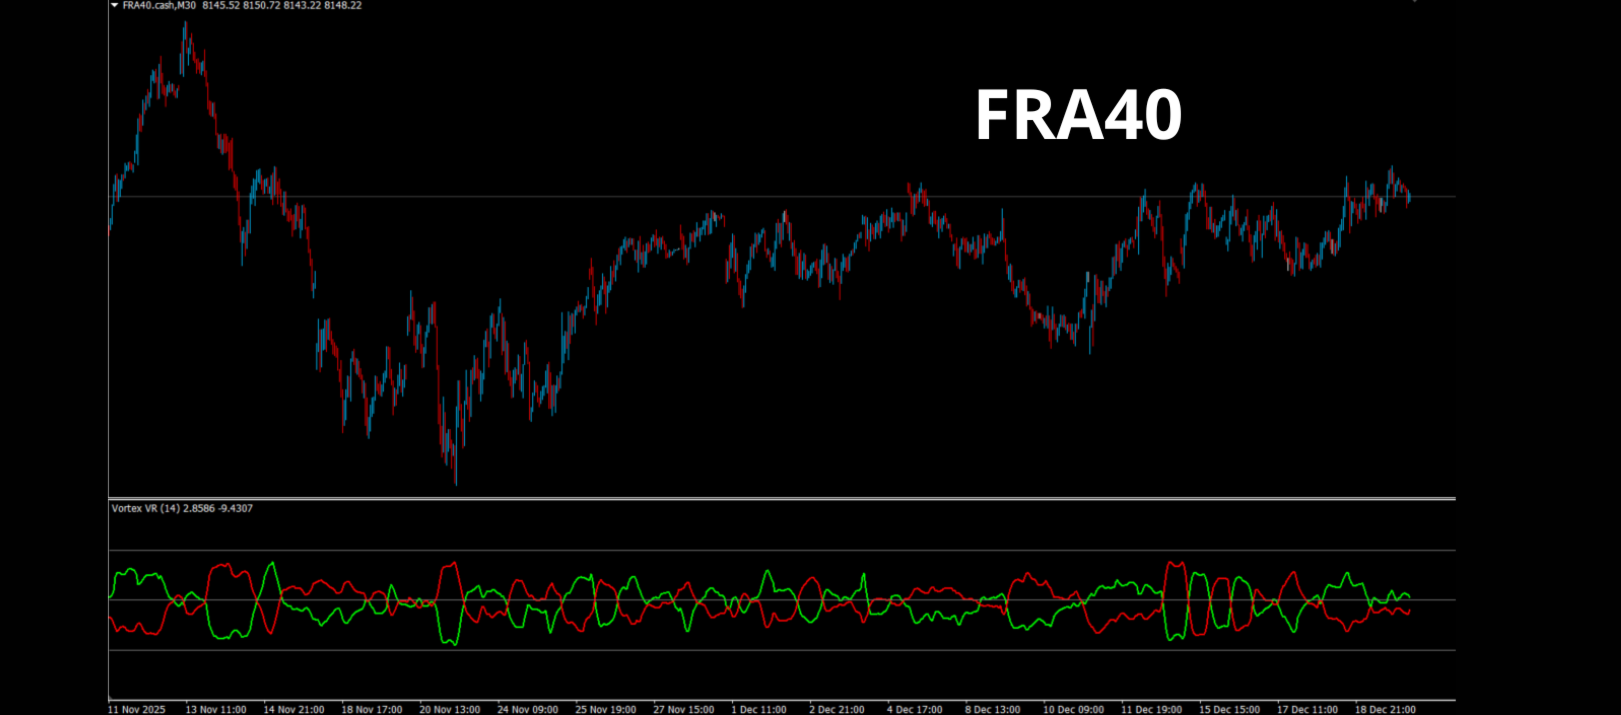
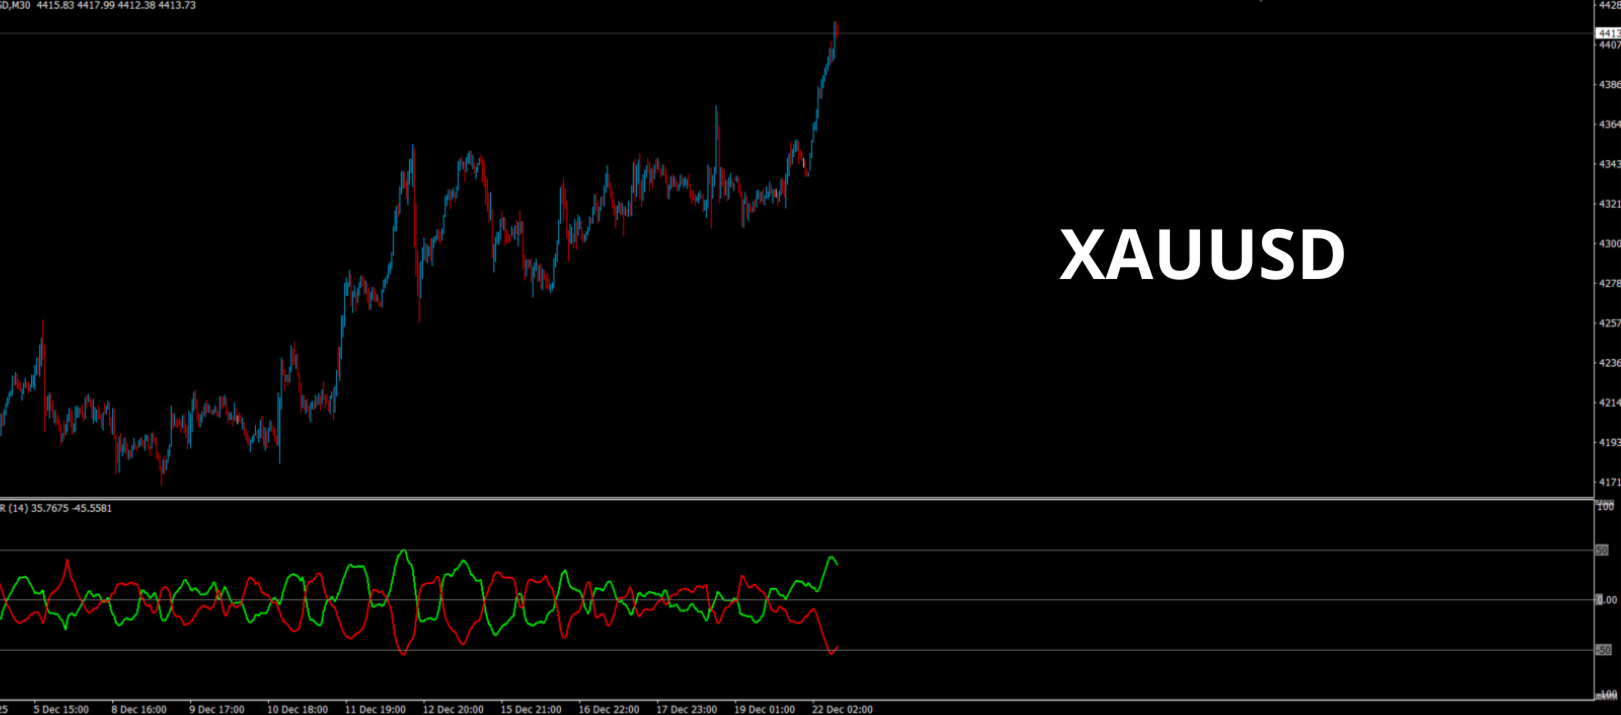
Multi-Pair & Multi-Timeframe: Works across Forex, Gold (XAUUSD), Indices (DAX, NASDAQ), and Cryptocurrencies.
-
Low-Lag Algorithm: An optimized calculation designed to minimize lag while providing smooth, actionable curves.
-
Automation Ready: Buffers are clearly defined for easy integration into your Expert Advisors (EA).