Multi TF Trend Dashboard
- Indicatori
- Versione: 3.3

Multi-TF Trend Dashboard
Product Description: Multi-TF Trend Dashboard is a technical indicator designed to provide a comprehensive view of market trends across multiple timeframes within a single interface. The utility analyzes the market structure from the 1-Minute (M1) timeframe up to the Monthly (MN1) timeframe, allowing traders to monitor momentum without switching between charts.
Core Logic: The indicator determines the trend direction based on the slope of a Moving Average (MA) on each specific timeframe:
-
Upward Trend: Identified when the Moving Average value of the current bar is higher than the previous bar.
-
Downward Trend: Identified when the Moving Average value of the current bar is lower than the previous bar.
-
Flat Trend: Identified when the Moving Average value remains unchanged.
Key Technical Features:
-
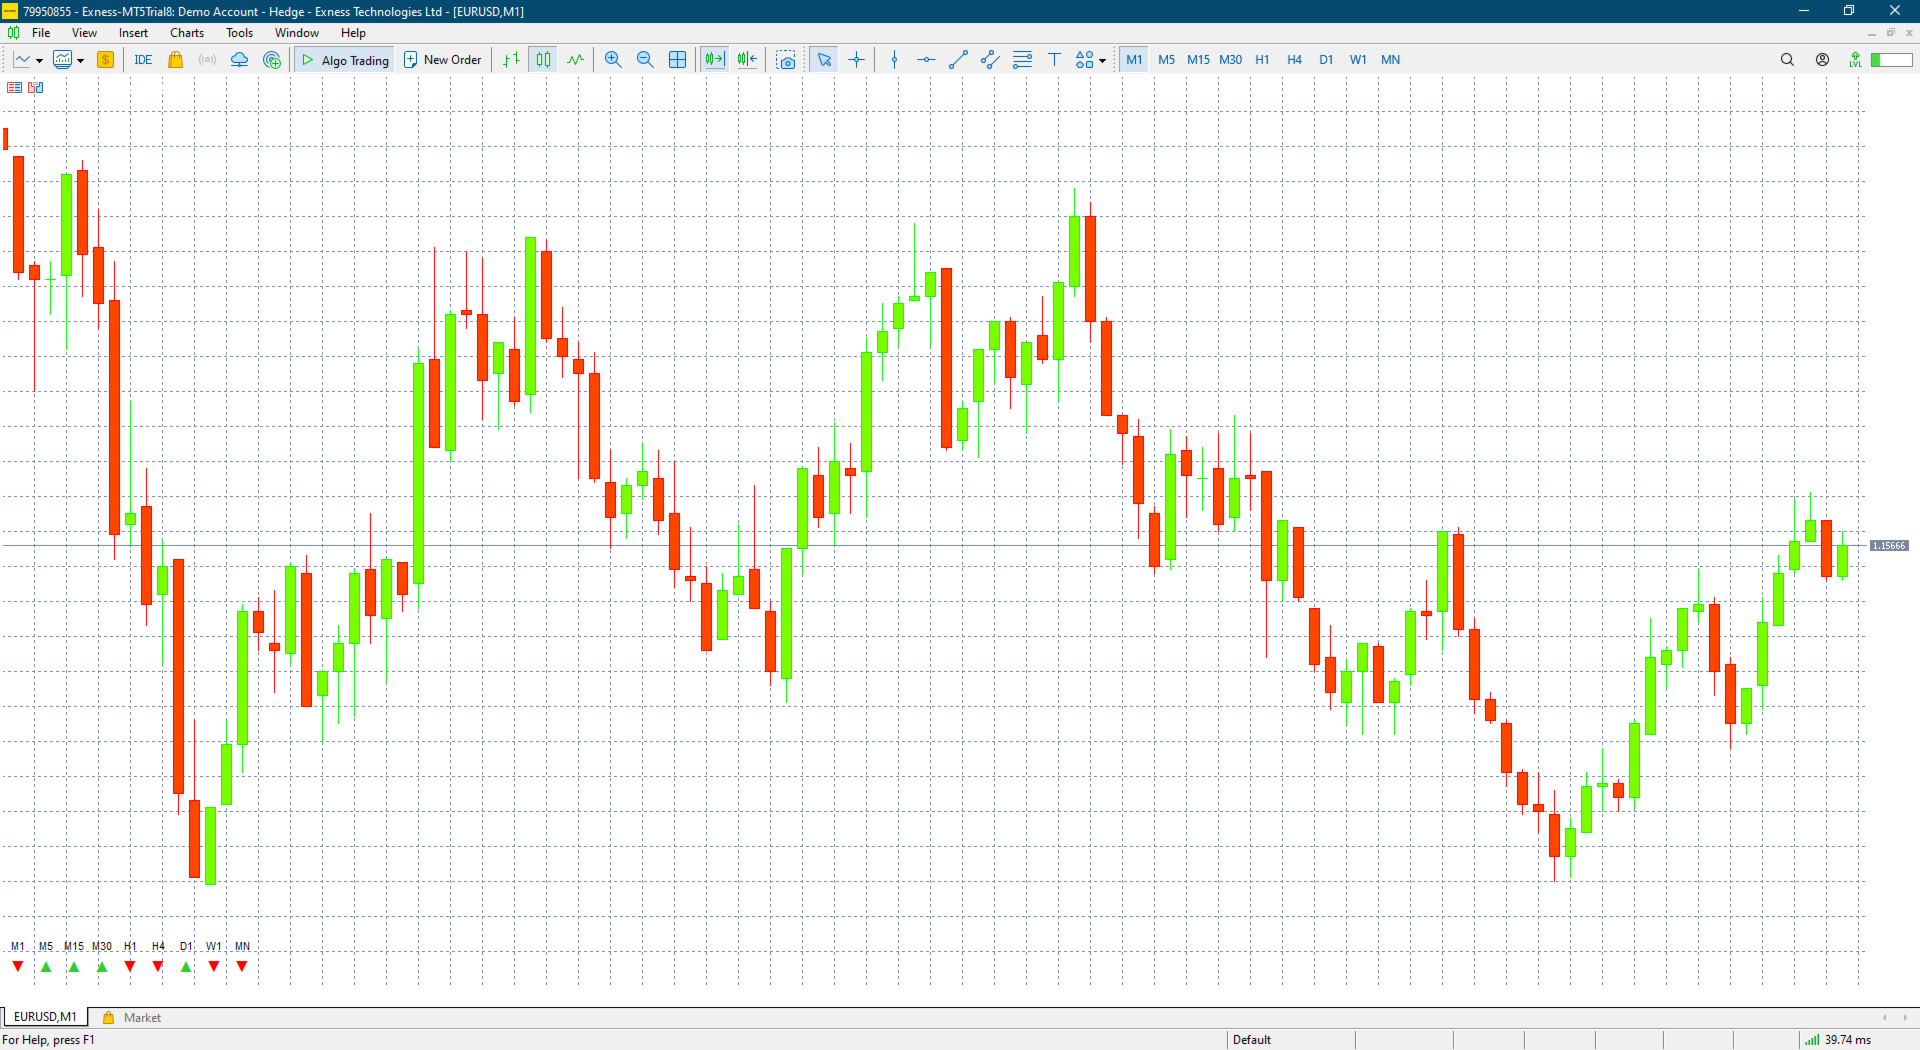
Comprehensive Monitoring: Simultaneously tracks 9 essential timeframes: M1, M5, M15, M30, H1, H4, D1, W1, and MN1.
-
Visual Feedback: Displays trend direction using clear visual markers (Up, Down, and Flat indicators).
-
Resource Efficient: Optimized code to ensure minimal impact on terminal performance and system resources.
-
Customizable Interface: Users can adjust calculation parameters and display colors to suit their trading environment.
Indicator Inputs:
-
MA Period: Sets the lookback period for the Moving Average calculation.
-
MA Method: Selects the calculation method (e.g., Simple, Exponential).
-
Text Color Settings: Customizes the visual labels of the dashboard.
Technical Note (Display Troubleshooting): If the dashboard panel is not visible on your chart, it may be obstructed by price bars. Please adjust the following terminal settings:
-
Right-click on the chart and select "Properties" (or press F8).
-
Navigate to the "Common" tab.
-
Ensure the "Chart on foreground" option is Unchecked.
-
Click OK to refresh the display.