ZigZag with no repaining
- Indicatori
- Versione: 1.0

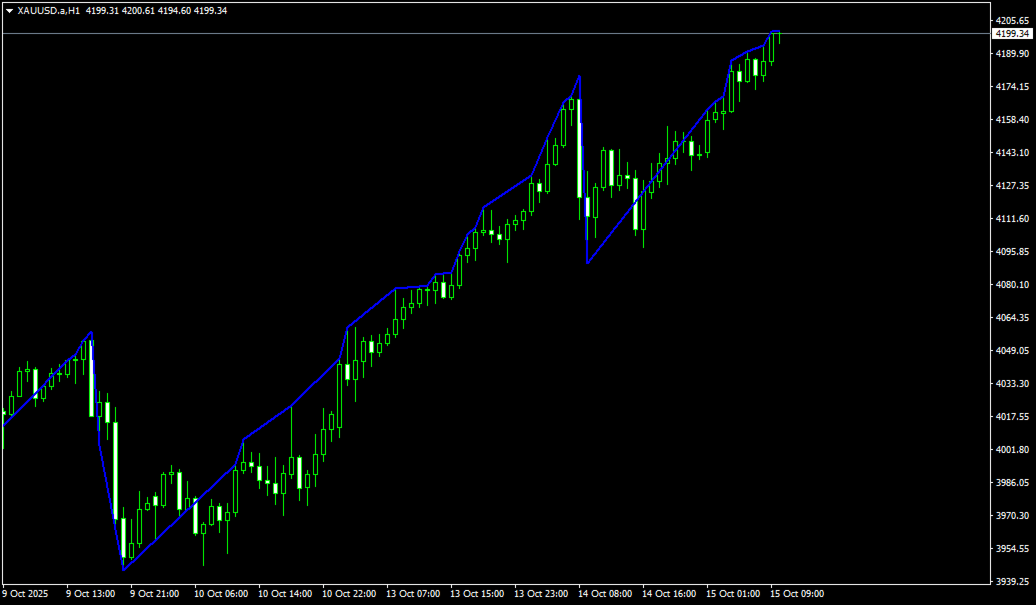
Classic ZigZag formula. But no lags and repaints. You can see on screenshots that it shows values between peaks and it is useful to test strategies based on indicator. Because sometimes people find a good idea about it but don't understand that repainting indicators have some things to keep in mind. The parameters are the same as original ZigZag indicator: Depth, Deviation and Backstep.