Neue technische Indikatoren für den MetaTrader 4 - 13
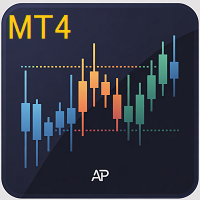
AP Tag-Woche-Monat Hoch-Tief MT4
Leichtes Overlay, das die Höchst-/Tiefstwerte des Vortags, der Woche und des Monats auf einem beliebigen Chart anzeigt. Hervorragend geeignet für die Planung von Sitzungen, Zusammenflüsse und Warnungen, wenn der Kurs zu wichtigen Swing-Levels zurückkehrt.
Was es kann Zeichnet 6 Linien: Höchst-/Tiefstkurs des Tages, Höchst-/Tiefstkurs der Woche, Höchst-/Tiefstkurs des Monats (aus den letzten abgeschlossenen Sitzungen).
Berührungs- und Annäherungswarnungen, wen
FREE

Fangen Sie die Wende: Das 5-Faktoren-Confluence-Handelssystem Haben Sie genug von widersprüchlichen Indikatoren und verpassten Einstiegen? Das Confluence Trading System ist Ihr kompletter Entscheidungsmotor, der das Marktrauschen durchbricht und Ihnen mit hoher Sicherheit Einstiegssignale liefert, wenn eine größere Marktbewegung beginnt. Die Kraft von 5-in-1 Confluence Hören Sie auf, im Zweifel zu handeln. Unsere proprietäre Engine eliminiert falsche Signale, indem sie nur dann ein Handelssigna
FREE

Super Signal Serie - V13 PRO Range-Bound & Reversal-Strategien Dashboard (MT4 ) Exclusive Bonus When you purchase this indicator, you receive 2 professional Gold EAs: MT4 Gold EA
XAU Trend Matrix EA - Wert $150 : Siehe den EA https://www.mql5.com/en/market/product/162870 MT5 Gold EA
XAU Steady Gain Pro - Im Wert von $150 : Siehe den EA https://www.mql5.com/en/market/product/162861 Gesamter Bonuswert: $300
Saubere Umkehrung Scanner Dashboard (MT4) Handeln Sie mit hoher Wahrscheinlichkeit Range

Super Signal Serie - V12 PRO Chart-Muster-Strategien Signale Indikator Exklusiver Bonus Wenn Sie diesen Indikator kaufen, erhalten Sie 2 professionelle Gold EAs: MT4 Gold EA
XAU Trend Matrix EA - Im Wert von $150 : Siehe den EA https://www.mql5.com/en/market/product/162870 MT5 Gold EA
XAU Steady Gain Pro - Im Wert von $150 : Siehe den EA https://www.mql5.com/en/market/product/162861 Gesamter Bonuswert: $300 Überblick Der Chart Pattern Strategies Signals Indicator ist ein umfassendes Dashboard fü
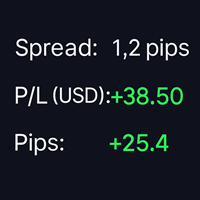
SpreadPipsProfit - Echtzeit Spread, P/L & Pip Tracker SpreadPipsProfit ist ein leichtgewichtiger, nicht aufdringlicher MT4-Indikator, der Ihre wichtigsten Handelskennzahlen in Echtzeit anzeigt - direkt in Ihrem Chart. Er wurde für Trader entwickelt, die Wert auf Klarheit, Präzision und eine saubere Optik legen. Hauptmerkmale Rechtsbündiges Anzeigefeld - Perfekt positioniert in der oberen rechten Ecke mit adaptivem Abstand und sicheren Rändern. Live-Spread-Monitor - Zeigt den aktuellen Spread
FREE

Erschließen Sie Ihr Handelspotenzial mit Momentum Master , dem intelligenten Indikator, der Ihnen hilft, die Märkte mit Zuversicht zu steuern. Dieses leistungsstarke Tool liefert klare, umsetzbare Signale, indem es die Stärken mehrerer bewährter Indikatoren kombiniert. Verabschieden Sie sich vom Rätselraten und begrüßen Sie den Präzisionshandel. Momentum Master ist mehr als nur ein Signalanbieter; es ist Ihr persönlicher Marktanalyst. Er nutzt eine einzigartige Kombination aus gleitenden Durchsc
FREE

Sind Sie bereit, Ihr Trading mit klaren Signalen mit hohem Vertrauen zu verbessern? Erschließen Sie die Macht des Triple-Confirmation Trading! Hören Sie auf, schwachen Signalen hinterherzujagen und handeln Sie mit Überzeugung. Der Triple-Power-Indikator ist Ihr ultimatives Werkzeug zur Identifizierung von Trendbewegungen mit hoher Wahrscheinlichkeit. Wir haben drei der leistungsstärksten und zuverlässigsten technischen Indikatoren - den parabolischen SAR, den MACD und den exponentiellen gleiten
FREE
Hören Sie auf zu raten, beginnen Sie zu handeln: Wir stellen den Premium MA Signal Indikator vor! Haben Sie genug von verwirrenden Charts und gemischten Signalen, die Sie Geld kosten? Der Premium MA Signal-Indikator ist Ihre Lösung. Er wurde entwickelt, um das Marktrauschen zu durchbrechen und klare, zuverlässige Handelssignale direkt auf Ihrem Chart zu liefern. Es handelt sich nicht nur um einen einfachen gleitenden Durchschnitt, sondern um ein komplettes, professionelles Trendanalysesystem, mi
FREE
Ultimativer Signalgenerator: Ihr Vorteil auf dem Markt Sind Sie es leid, Ihren nächsten Schritt auf dem Markt zu erraten? Der Ultimative Signalgenerator ist hier, um das zu ändern. Dieser leistungsstarke MQL4-Indikator wurde entwickelt, um Ihnen einen klaren Handelsvorteil zu verschaffen, indem er zuverlässige Kauf- und Verkaufssignale liefert. Es ist ein intelligentes, effektives Werkzeug, das Ihnen hilft, sichere Entscheidungen zu treffen, damit Sie sich auf Ihre Strategie konzentrieren könne
FREE
Präzisionseinstiegspfeile: Verpassen Sie nie wieder einen hochwahrscheinlichen Handel! Hören Sie auf zu raten und beginnen Sie, mit Zuversicht zu handeln. Der Precision Entry Arrows-Indikator ist ein ausgeklügeltes All-in-One-Tool, das hochwertige, nicht nachmalende Kauf- und Verkaufssignale direkt auf Ihrem Chart liefert. Er kombiniert gekonnt die Leistung von MACD , Stochastik und einem einzigartigen EMA 5 Cross , um exakte Einstiegszeitpunkte zu ermitteln, und filtert dann alles durch einen
FREE

Precision Pulse: Trendfolgender Indikator mit hoher Überzeugungskraft Produktübersicht Precision Pulse ist ein fortschrittlicher, multifaktorieller Trendfolgeindikator, der entwickelt wurde, um Handelssignale mit hoher Wahrscheinlichkeit zu liefern, indem er den langfristigen Trend, das kurzfristige Momentum und die überkauften/überverkauften Bedingungen rigoros aufeinander abstimmt. Er minimiert Marktgeräusche und "Whipsaws", indem er verlangt, dass alle grundlegenden Komponenten konvergieren,
FREE
Der Quad-Filter Pro: Erschließen Sie den Präzisionshandel und filtern Sie das Rauschen heraus Haben Sie genug von komplexen Charts und dem Verpassen profitabler Gelegenheiten? In den volatilen Märkten von heute ist es riskant, sich auf einen einzigen Indikator zu verlassen. Sie brauchen eine felsenfeste Bestätigung , um hochwahrscheinliche Trades vom Marktrauschen zu trennen. Wir stellen Ihnen den Quad-Filter Pro vor - Ihren ultimativen MetaTrader 4-Indikator, der für unvergleichliche Handelspr
FREE

Candle Time At Price - Präziser Countdown direkt neben der Kerze Candle Time At Price ist ein leichtgewichtiger, intelligenter und visuell eleganter Indikator, der die verbleibende Zeit der aktuellen Kerze direkt neben dem Preis anzeigt - genau dort, wo Ihr Blick hingeht. Er wurde für Händler entwickelt, die Wert auf saubere Charts, Präzision und keinerlei Ablenkung legen. Hauptmerkmale: Echtzeit-Countdown - Zeigt die genaue verbleibende Zeit bis zum Schließen der aktuellen Kerze an.
FREE
Die vier Säulen: Ihr All-in-One Handelskraftwerk! Sind Sie es leid, mit mehreren Indikatoren zu jonglieren und perfekte Einstiegsmöglichkeiten zu verpassen? The Four Pillars ist die ultimative Lösung, die vier bewährte Marktanalyseinstrumente in einem einzigen leistungsstarken, benutzerfreundlichen Indikator zusammenfasst. Erhalten Sie kristallklare, überzeugende Kauf- und Verkaufssignale direkt auf Ihrem Chart, gefiltert für maximale Genauigkeit. Hören Sie auf zu raten und beginnen Sie, mit Zu
FREE

Super Signal Serie - V9 PRO Price Action Strategies Dashboard - Multi-Pair Signal Scanner (Buy/Sell mit Entry, SL & TP)
Exklusiver Bonus Wenn Sie diesen Indikator kaufen, erhalten Sie 2 professionelle Gold EAs: MT4 Gold EA
XAU Trend Matrix EA - Im Wert von $150 : Siehe den EA https://www.mql5.com/en/market/product/162870 MT5 Gold EA
XAU Steady Gain Pro - Im Wert von $150 : Siehe den EA https://www.mql5.com/en/market/product/162861 Gesamter Bonuswert: $300
Das Price Action Strategies Dashboard

Super Signal Serie - V18 PRO Erweiterte Angebots- und Nachfragezone Dashboard
Exklusiver Bonus Wenn Sie diesen Indikator kaufen, erhalten Sie 2 professionelle Gold EAs: MT4 Gold EA
XAU Trend Matrix EA - Im Wert von $150 : Siehe den EA https://www.mql5.com/en/market/product/162870 MT5 Gold EA
XAU Steady Gain Pro - Im Wert von $150 : Siehe den EA https://www.mql5.com/en/market/product/162861 Gesamter Bonuswert: $300
Der ultimative Multi-Symbol, Multi-Strategie Scanner für Price Action Trader Be

TR CPR Full Lines Pivot - Full Pivot Range Indikator
Ein professioneller Indikator, der automatisch CPR-Niveaus (Central Pivot Range) auf dem täglichen (D1) oder H4-Zeitrahmen mit sauberen Linien und strukturierten Zielen (TP1 - TP3 ) sowohl nach oben als auch nach unten einzeichnet. Er hilft Ihnen, klare KAUF-/VERKAUFSZONEN zu identifizieren, mit intelligenten Warnungen, wenn der Preis die Schlüsselniveaus berührt oder durchbricht.
Merkmale: Automatische CPR-Berechnung aus der vorherigen Tage
H4 Supersignal
Willkommen auf meiner Seite.
- Der H4 Supersignal Indikator ist für den H4 Zeitrahmen erstellt.
- Der Indikator wird nicht neu gezeichnet.
- Er kann auf anderen Zeitrahmen ausprobiert werden.
- Er funktioniert mit allen Währungspaaren.
- Bollinger Bänder (60, 2) oder gleitende Durchschnitte (60 geglättet) können als visuelle Hilfe in den Chart eingefügt werden.
- Handelssignale werden durch weiße und gelbe Pfeile in Übereinstimmung mit den blauen und roten Trendlinien ange
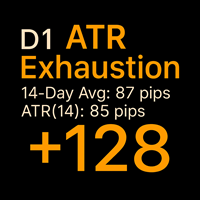
Beschreibung: Dieser leichtgewichtige MT4-Indikator berechnet und zeigt an , wie weit der Kurs heute (in Pips) von der Tageseröffnung bis zu seinem äußersten Extremwert (Hoch oder Tief) gereist ist - so erhalten Sie ein klares Bild von der tatsächlichen Erschöpfung der Tagesspanne , nicht nur von der aktuellen Position. Im Gegensatz zu traditionellen ATR-basierten Tools, die sich auf die Bewegung von Close-to-Close konzentrieren, misst diese Version die maximale Intraday-Auslenkung und eignet

Betreten Sie die Welt des Devisenhandels mit Zuversicht, Klarheit und Präzision mit Gold Indicator , einem Tool der nächsten Generation, das Ihre Handelsleistung auf die nächste Stufe hebt. Ganz gleich, ob Sie ein erfahrener Profi sind oder gerade erst Ihre Reise auf den Devisenmärkten beginnen, Gold Indicator liefert Ihnen leistungsstarke Erkenntnisse und hilft Ihnen, intelligenter zu handeln, nicht härter. Der Gold Indicator basiert auf der bewährten Synergie dreier fortschrittlicher Indikato
Handelssignale & Session Bias in einem Tool. Erkennt Trends in Asien, London und New York, zeigt die Stärke des Bias, warnt vor Bias-Flips und stellt Einstiegs-/SL/TP-Levels mit R:R dar. Einfaches Dashboard für schnelle Entscheidungen. Einfacher, aber leistungsstarker Handelsassistent. Dieser Indikator erkennt automatisch die Markttendenz während der Asien-, London- und New York-Sitzungen .
Er hilft Händlern, auf der richtigen Seite des Trends zu bleiben, neutrale Zonen zu vermeiden und Bias-Fl
Delta Fusion Pro – Erweiterte Order-Flow-Analyse für den Intraday-Handel
Delta Fusion Pro ist ein professioneller Indikator für MetaTrader 4, der den aggressiven Orderfluss aufdeckt und die Intensität sowie die Richtung des institutionellen Drucks in Echtzeit anzeigt. Im Gegensatz zu herkömmlichen Volumenindikatoren analysiert er die Delta-Differenz zwischen Ask- und Bid-Volumen, um Umkehrungen vorherzusagen, Trends zu bestätigen und professionelle Interessenzonen zu identifizieren. Hauptmerkm
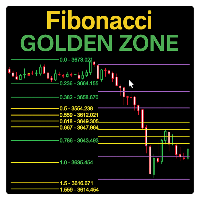
Der Fibonacci Sessions Indikator ist ein leistungsstarkes Trading-Tool, das für präzises Scalping und Intraday-Strategien entwickelt wurde. Er zeichnet automatisch die wichtigsten Fibonacci-Niveaus für die Sitzungen in New York, London und Asien ein und bietet Tradern einen klaren Überblick über die Kursdynamik während der wichtigsten Handelszeiten. Einzigartige „Goldene Zonen“ werden in jeder Sitzung hervorgehoben, in denen der Preis am häufigsten reagiert. Dies schafft hochzuverlässige Bere
FREE

Balance Levels ist ein einfach zu bedienender Trading-Indikator, der klare Kauf- und Verkaufssignale zusammen mit dynamischen Preisniveaus liefert und Tradern hilft, ihre Einstiege und Ausstiege mit mehr Sicherheit zu planen. Das Tool ist sehr flexibel – es kann als eigenständige Strategie verwendet oder in jedes bestehende Handelssystem integriert werden. Es funktioniert auf allen Zeitrahmen und in allen Märkten : Forex, Gold, Indizes, Kryptowährungen oder Aktien. Balance Levels passt zu jedem
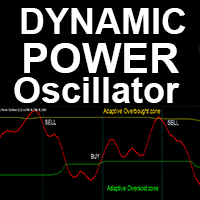
„Dynamic Power Oscillator“ – ein fortschrittlicher, benutzerdefinierter Crypto_Forex-Indikator – ein effizientes Trading-Tool für MT4!
– Neue Oszillatoren-Generation – siehe Bilder zur Anwendung. – Ein sehr nützlicher technischer Momentum-Indikator. – Der Dynamic Power Oscillator verfügt über adaptive Überverkauft-/Überkauft-Zonen. – Der Oszillator ist ein Hilfsmittel, um genaue Einstiegspunkte in dynamischen Überverkauft-/Überkauft-Bereichen zu finden. – Überverkauft: unterhalb der grünen Lin
Crypto_Forex Indikator „HTF Momentum“ für MT4.
– HTF Momentum ist einer der führenden Indikatoren zur Messung der Kursänderungsrate. HTF steht für „höherer Zeitrahmen“. – Dieser Indikator zeigt die Trendrichtung an und misst die Geschwindigkeit der Kursänderung durch den Vergleich aktueller und vergangener Werte. – Der HTF Momentum Indikator eignet sich hervorragend für Multi-Time-Frame-Handelssysteme mit Scalping-Einträgen oder in Kombination mit anderen Indikatoren. – Mit diesem Indikator kö

TrendCatcher FVG ist ein Indikator für Trader, die mit Smart Money Concepts (SMC) arbeiten.
Er erkennt Fair Value Gaps (FVG, ICT-Drei-Kerzen-Muster), zeichnet die Gap-Zone und die Mittellinie (CE, 50 %) und zeigt auf dem Chart Referenzniveaus für Entry, Stop Loss (SL), Take Profit 1 (TP1) und Take Profit 2 (TP2). Das Tool dient ausschließlich der visuellen Analyse und eröffnet oder verwaltet keine Orders. Funktionsweise Der Indikator analysiert jede Kerze und identifiziert bullische oder bärisch

【Limitierter Verkauf】Regulär $59,99 → Jetzt nur $30,00 (50% Rabatt) AAA MA PRO EX ist ein Indikator, der mehrere gleitende Durchschnitte in MT4 integriert und verwaltet. Steuern Sie 5 MAs in Echtzeit über das Control Panel auf dem Chart. Führen Sie MA-Typ-Wechsel, Periodenänderungen und Zeitrahmenänderungen mit einem Klick aus, ohne das Parameterfenster zu öffnen. Ausgestattet mit 7 Arten von gleitenden Durchschnitten (SMA, EMA, SMMA, LWMA, DEMA, TEMA, HMA), sind individuelle Zeitrahmeneinstellu
【Zeitlich begrenztes Angebot 50% Rabatt】Normalpreis $79.99, Jetzt $39.99 AAA ZigZagFibo PRO EX ist ein revolutionärer MT4-Indikator, der vergangene Swing-Hochs und -Tiefs speichert und Fibonacci-Retracement/-Extension auf jedem ausgewählten Segment zeichnet. Steuern Sie 42 Fibonacci-Segmente in Echtzeit über das Chart-Bedienfeld. Wechseln Sie Fibonacci-Modi, wählen Sie Segmente und ändern Sie Zeitrahmen mit einem Klick—ohne das Parameterfenster zu öffnen.
Trend Signal PRO – Professional Trend Detection System Introduction
The Trend Signal PRO is an advanced MetaTrader indicator that brings precision, transparency, and professionalism to your technical analysis.
With permanent arrows, intelligent confirmations, and automated risk management, it is designed for traders who demand accuracy and consistency. Core Features High-Precision Signals Permanent colored arrows that never repaint Intelligent multi-layer confirmation system Customizable trend

KAUFEN SIE DEN INDIKATOR UND ERHALTEN SIE EIN NEUES EXKLUSIVES EA ALS BONUS! Der ITALO ARROWS INDICATOR ist der beste Umkehrindikator, der je entwickelt wurde, und warum? Mit extremen Umkehrzonen auf dem Markt, um die Pfeile und Fibonacci-Zahlen für die Take Profit, auch mit einem Panel zeigt alle Informationen über die Signale auf dem Chart, der Indikator funktioniert auf allen Zeitrahmen und Vermögenswerte, Indikator nach 8 Jahren Erfahrung auf Forex und viele andere Märkte gebaut. Sie wissen
Produktbeschreibung: BBMA Dashboard Guide BBMA Dashboard Guide ist ein auf BBMA basierender Indikator, der Tradern hilft, die Marktstruktur über alle Zeitrahmen hinweg – von MN1 bis M1 – in einem einzigen, klaren und interaktiven Dashboard zu überwachen. Mit diesem Tool müssen Sie nicht mehr ständig zwischen mehreren Charts wechseln. Alle wichtigen Informationen sind in einem übersichtlichen Dashboard sofort verfügbar. Hauptfunktionen: Multi-Timeframe-Struktur
Sofortige BBMA-Analyse vom

Market Vortex.mq4 ist ein leistungsstarker Pfeilindikator, der entwickelt wurde, um Umkehrpunkte und Trendfortsetzungen genau zu identifizieren. Er basiert auf einem geglätteten Oszillator und adaptiven gleitenden Durchschnitten und hilft Händlern, schnell und ohne komplexe Berechnungen Marktein- und -ausstiegspunkte zu finden.
Hauptmerkmale:
Klare Pfeilsignale: Der Indikator zeigt Kauf-/Verkaufspfeile direkt auf dem Chart an.
Echtzeitbetrieb: Die Signale werden ohne Verzögerung und o
Der AX Forex Indicator MT4 ist ein hochentwickeltes Handelsinstrument, das Händlern eine umfassende Analyse mehrerer Währungspaare bietet. Dieser leistungsstarke Indikator vereinfacht die komplexe Natur des Forex-Marktes und macht ihn sowohl für Anfänger als auch für erfahrene Trader zugänglich. AX Forex Indicator verwendet fortschrittliche Algorithmen zur Erkennung von Trends und Mustern und ist ein unverzichtbares Werkzeug für Händler, die ihre Leistung im Devisenhandel verbessern möchten. Mi

Der ultimative Trading-Begleiter: Smart Trend Tracer Haben Sie es satt, sich im Marktrauschen zu verlieren? Sind Sie bereit, die klarsten Trends mit höchster Genauigkeit zu finden? Wir stellen Ihnen den Smart Trend Tracer vor, das ultimative Tool, das das Durcheinander durchbricht und die profitabelsten Marktschwankungen aufzeigt. Er ist nicht einfach nur ein weiterer Indikator, sondern Ihr persönlicher Leitfaden zum Erkennen von Trends, sobald sie sich bilden, und gibt Ihnen die Sicherheit, int
FREE

Entfesseln Sie Ihr Handelspotenzial mit dem ultimativen Trend Sniper Sind Sie es leid, große Marktbewegungen zu verpassen? Möchten Sie Trends mit laserartiger Präzision erkennen? Der Ultimate Trend Sniper ist ein leistungsstarker und dennoch einfach zu bedienender Indikator, der Ihnen genau dabei helfen soll. Er ist nicht einfach nur ein weiterer gleitender Durchschnitt - er ist ein intelligentes Werkzeug, das Ihnen einen klaren Vorteil auf dem Markt verschafft. Hauptmerkmale & Vorteile: Präzise
FREE

TUMA MT4 Light Indikator Ein einfacher und bequemer Indikator zur Verfolgung der Kreuzung von zwei gleitenden Durchschnitten (EMA).
Eine leichtgewichtige Schnittstelle direkt auf dem Chart ermöglicht es Ihnen, die Perioden der beiden MAs schnell zu ändern, ohne das Einstellungsfenster zu öffnen. Hauptmerkmale: Anzeige von zwei EMAs auf dem Chart. Einfache Bearbeitung der Parameter direkt im Chart. Signalpfeile, wenn sich die MAs kreuzen: KAUFEN (grüner Pfeil nach oben) VERKAUFEN (rote
FREE

Zig Zag Roboter: Ein umfassendes Reversal Trading System Der Zig Zag Robot ist ein leistungsfähiges Tool, das entwickelt wurde, um wichtige Marktumkehrungen genau zu erkennen und das Marktrauschen" herauszufiltern. Er geht über einen einfachen Zig Zag-Indikator hinaus, indem er mehrere Tools und eine eingebaute Logik kombiniert, um Ihnen einsatzbereite Handelssignale zu liefern und Ihnen zu helfen, fundiertere Entscheidungen zu treffen. Wie er funktioniert Der Indikator verwendet einen mehrstufi

TOP DOWN PREMIUM INDICATOR (mt4 Version) Einleitung Der TOP DOWN PREMIUM INDICATOR ist der König der Top-Down-Analyse-Tools für MT4-Händler. Er gibt Ihnen die Möglichkeit, den Markt über alle wichtigen Zeitrahmen hinweg zu analysieren - von stündlichen Daten bis hin zu Jahresprognosen - mit unvergleichlicher Genauigkeit und Klarheit. Mit diesem Indikator können Händler die Marktstruktur von kurzfristigen Intraday-Bewegungen bis hin zu langfristigen Jahreszyklen prognostizieren, kennzeichnen u
Laden Sie die kostenlose USDJPY-Version hier herunter .
MACD-Indikator Der MACD (Moving Average Convergence and Divergence) ist ein Trendfolgemomentum-Indikator, der die Beziehung zwischen zwei gleitenden Durchschnitten anzeigt, die wir auswählen und für den Indikator konfigurieren. Der MACD wird durch Subtraktion des exponentiellen gleitenden Durchschnitts mit einer Dauer von 26 Perioden und des gleitenden Durchschnitts mit einer Dauer von 12 Perioden berechnet. Dies sind die Standardparameter

Fortgeschrittener Renko & Point & Figure-Indikator mit Gewinn/Verlust-Musteranalyse Dieser leistungsstarke Indikator kombiniert zwei bewährte Strategien - Renko und Point & Figure (P&F) - zu einem umfassenden Tool für Trendidentifikation, Mustererkennung und Risikomanagement. Mit der dynamischen Box-Size-Berechnung (fest oder ATR-basiert), gleitenden Durchschnittsfiltern und der Erkennung von Gewinn-/Verlustmustern können Händler intelligentere, datengestützte Entscheidungen treffen.
Hauptmerk
Signal King: Ihr oberster Trendindikator Fühlten Sie sich jemals verloren im Lärm des Marktes? Der "Signal King"-Indikator durchbricht das Chaos und liefert Ihnen klare Kauf- und Verkaufssignale mit hoher Wahrscheinlichkeit direkt auf Ihrem Chart. Dies ist nicht einfach nur ein weiterer Trendindikator, sondern ein leistungsstarkes Tool, das Ihnen einen Vorteil verschafft, indem es den robusten Supertrend mit einem zuverlässigen EMA-Filter kombiniert. Der Supertrend zeichnet sich dadurch aus, das
FREE

AlphaTrend Pro - Erweiterter visueller Trend-Erkennungs-Indikator Produkttitel AlphaTrend Pro - Erweiterte Trend-Erkennung mit kristallklaren visuellen Signalen Kurzbeschreibung AlphaTrend Pro ist ein hochentwickelter Trendfolge-Indikator, der die Volatilitätsanalyse (ATR) mit Momentum-Oszillatoren (RSI/MFI) kombiniert, um dynamische Unterstützungs- und Widerstandsniveaus zu schaffen. Mit großen Richtungspfeilen und einer intelligenten visuellen Positionierung liefert dieser professionelle MT4-I
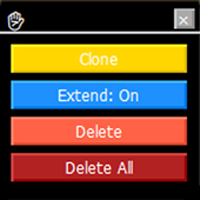
Trendlinien-Werkzeugkasten (MT4) Trendline Toolbox ist ein Hilfsindikator für MetaTrader 4, der bei der Verwaltung von Trendlinien und allgemeinen Chart-Objekten hilft. Er liefert keine Handelssignale und garantiert keine Gewinne. Wichtigste Funktionen Klonen der ausgewählten Trendlinie (Stil, Winkel und Kursniveau bleiben erhalten). Schalten Sie die Eigenschaft "Erweitern" für die ausgewählte Trendlinie ein. Löschen Sie die ausgewählte Trendlinie. Alle Objekte im aktuellen Diagramm löschen. Do
FREE

Trend Zig Zag: Ein Trendumkehr-Indikator Der Trend Zig Zag ist ein fortschrittlicher Indikator, der entwickelt wurde, um wichtige Marktumkehrungen präzise zu identifizieren und das Marktrauschen" herauszufiltern. Er baut auf dem klassischen Zig Zag-Indikator auf und bietet Händlern eine klarere Sicht auf die Trendstruktur, was ihnen hilft, optimale Einstiegs- und Ausstiegspunkte zu finden. Die wichtigsten Vorteile: Fokus auf den Trend : Dieser Indikator verwendet Daten aus einem höheren Zeitr

Entdecken Sie Ihren Vorteil mit Golden Trend Finder Sind Sie es leid, Ihre Trades immer wieder neu zu bewerten? Golden Trend Finder ist der All-in-One-Indikator, der Ihnen einen entscheidenden Vorteil auf dem Markt verschafft. Er ist nicht nur ein weiteres Tool, sondern ein leistungsstarker Signalgenerator, der mehrere fortschrittliche Indikatoren kombiniert, um Ihnen klare, bestätigte Handelsmöglichkeiten zu bieten. Stellen Sie sich vor, Sie hätten ein intelligentes System, das Ihnen genau sagt
FREE

Entdecken Sie Ihren Vorteil mit Trend Hunter Ultimate Sind Sie es leid, Ihre Trades immer wieder zu hinterfragen? Trend Hunter Ultimate ist ein leistungsstarker MT4-Indikator, der das Marktrauschen durchbricht und Ihnen klare, präzise Handelssignale liefert. Dieses Tool basiert auf einer bewährten Strategie, die mehrere gleitende Durchschnitte und den Stochastik-Oszillator kombiniert, und ist Ihr Schlüssel zur Identifizierung von Trend- und Umkehrchancen mit hoher Wahrscheinlichkeit. Hauptmerkma
FREE

Entdecken Sie die Kraft von Trend Strength Pro Erschließen Sie mit Trend Strength Pro , dem ultimativen Tool zur Visualisierung der Marktdynamik, eine neue Ebene der Klarheit für Ihren Handel. Hören Sie auf zu raten und erkennen Sie die wahre Stärke eines Trends mit einem einzigen Blick. Unser eleganter und intuitiver Indikator hilft Ihnen, klügere und sicherere Handelsentscheidungen zu treffen. Hauptvorteile und Funktionen Sofortige Erkennung der Trendstärke : Unser farbkodiertes Histogramm zei
FREE
BreakBack21 Indicator Premium - Identifizieren Sie starke EMA21-Ausbrüche mit intelligenter Bestätigung, Echtzeit-Statistiken und einem einzigartigen Empfehlungssystem. Ein professioneller Indikator, der Händlern hilft, EMA21-Ausbrüche mit Klarheit, Präzision und Konsistenz zu bewerten. Ideal für Binäre Optionen und Forex Scalping auf M1. Hauptmerkmale EMA21-Ausbruchserkennung mit Bestätigungskerzenfilter Echtzeit-Empfehlungssystem - Verfolgt die Performance Kerze für Kerze und beginnt jede Sitz

Super Signal Serie - V11 PRO Ultimativer Trendfolgescanner
Exklusiver Bonus Wenn Sie diesen Indikator kaufen, erhalten Sie 2 professionelle Gold EAs: MT4 Gold EA
XAU Trend Matrix EA - Im Wert von $150 : Siehe den EA https://www.mql5.com/en/market/product/162870 MT5 Gold EA
XAU Steady Gain Pro - Im Wert von $150 : Siehe den EA https://www.mql5.com/en/market/product/162861 Gesamter Bonuswert: $300 Sind Sie es leid, manuell durch Dutzende von Charts zu blättern und verzweifelt nach dem nächsten gro
Finden Sie Ihre Trading-Richtung mit Signal Compass Pro ! Sind Sie es leid, Ihren nächsten Schritt zu erraten? Signal Compass Pro ist Ihre Antwort. Dieser Indikator ist nicht nur ein Werkzeug, sondern Ihr persönlicher Kompass auf den Finanzmärkten. Durch die Kombination von drei leistungsstarken Momentum-Indikatoren - CCI, WPR und Force Index - liefern wir bestätigte Handelssignale, die klarer, zuverlässiger und weniger anfällig für "Rauschen" sind. Hauptmerkmale & Vorteile Bestätigte Signale: K
FREE

TurnPoint Indicator - Werkzeug für Marktumkehr und Trendsignale Der TurnPoint Indicator wurde entwickelt, um Händlern zu helfen, potenzielle Wendepunkte und Schlüsselniveaus auf dem Markt zu erkennen. Durch die Analyse des Kursgeschehens werden Bereiche hervorgehoben, in denen Umkehrungen oder Fortsetzungen wahrscheinlich sind, so dass Händler Trendänderungen effektiver vorhersehen können. Dieses Tool enthält eine fortschrittliche Logik zum Filtern von Signalen, um Rauschen und Fehlalarme zu re
FREE

Der "Dragon_Structure_Filter" ist nicht nur ein Indikator. Es ist Ihre persönliche analytische Abteilung, die in MetaTrader 4 eingebaut ist. Er findet das stärkste Umkehrmuster "Dragon" und durchläuft 7 Stufen des Schutzes vor Verlustgeschäften. Unsere Filtertechnologie: Wie wir 95% der "Junk"-Signale herausfiltern Jeder Filter ist Ihr persönlicher Beschützer, der Ihr Depot verteidigt. Und so funktionieren sie: F ilter #1: Ausrichtung am globalen Trend (Marktstrukturfilter) Wie er funktionie
FREE
Erschließen Sie klügere Trades mit Candle Sync Pro! Haben Sie genug von widersprüchlichen Signalen in verschiedenen Zeitrahmen? Hätten Sie gerne einen klareren Überblick über die wahre Richtung des Marktes? "Candle Sync Pro" ist Ihr unverzichtbares Werkzeug, um sichere und fundierte Handelsentscheidungen zu treffen! Dieser leistungsstarke Indikator durchbricht das Rauschen und ermöglicht es Ihnen, das Gesamtbild zu sehen , indem er Kerzen mit höherem Zeitrahmen direkt auf Ihrem aktuellen Chart v
FREE
Entfesseln Sie intelligentes Handeln mit dem Smart Signal Generator Haben Sie genug vom Rätselraten bei Ihrem Handel? Der Smart Signal Generator ist Ihr neues, unverzichtbares Werkzeug, das Ihre Strategie vereinfacht und Ihnen einen entscheidenden Vorteil verschafft. Es handelt sich nicht um einen weiteren Indikator, sondern um ein System, das Ihnen mit hoher Wahrscheinlichkeit Einstiegssignale liefert, die Ihnen Zeit sparen und Ihr Vertrauen stärken. Hauptvorteile und Merkmale Intelligente Sign
FREE

Der Wave Rider-Indikator: Ihr Schlüssel zu sicherem Handel Sind Sie es leid, Marktbewegungen zu erraten? Der Wave Rider Indikator ist Ihre Lösung. Er ist ein intelligentes Werkzeug, das Ihnen hilft, mit Leichtigkeit und Zuversicht profitable Trends zu erkennen. Was macht ihn so leistungsstark? Sehen Sie Trends klar und deutlich : Wave Rider vereinfacht komplexe Marktdaten, so dass Sie die Richtung des Trends leicht erkennen und intelligentere Entscheidungen treffen können. Rechtzeitige Signale
FREE
Erhöhen Sie Ihr Trading mit WilliamsTrend Pro Sind Sie bereit, Ihr Trading auf die nächste Stufe zu heben? WilliamsTrend Pro ist das ultimative Tool, das Ihnen hilft, mit Präzision und Zuversicht hochwahrscheinliche Handels-Setups zu erkennen. Durch die Kombination der Leistungsfähigkeit des Williams %R-Oszillators mit einem 200-Perioden-EMA-Trendfilter hilft Ihnen dieser Indikator, intelligenter und nicht härter zu handeln . Hören Sie auf, Ihre Ein- und Ausstiege in Frage zu stellen. WilliamsTr
FREE

Transformieren Sie Ihr Trading mit dem Visual Trend Ribbon Sind Sie es leid, die großen Bewegungen zu verpassen? Fällt es Ihnen schwer, die wahre Richtung des Marktes zu erkennen? Das Visual Trend Ribbon ist Ihre Lösung. Dieser leistungsstarke Indikator durchbricht das Marktrauschen und gibt Ihnen ein klares, visuelles Verständnis des Trends, damit Sie mit Zuversicht handeln können. Anstelle einer einzelnen, nachlaufenden Linie verwendet das Visual Trend Ribbon ein dynamisches Band aus mehreren
FREE

Meistern Sie Ihre Markteintritte und -austritte! Haben Sie genug von verwirrenden, verrauschten Indikatoren, die Ihnen falsche Signale liefern? Der Stochastic Market Master wurde entwickelt, um das Rauschen zu durchbrechen und Ihnen kristallklare Handelsmöglichkeiten direkt zu liefern. Dieses leistungsstarke Tool verwendet ein einzigartiges Verfahren zur doppelten Glättung, um genauere Kauf- und Verkaufssignale zu liefern, die Ihnen helfen, Trendumkehrungen mit Zuversicht und Präzision zu erkenn
FREE
Der ultimative Trading-Begleiter: Jenseits der Bänder Sind Sie es leid, wichtige Marktbewegungen zu verpassen? Unser Indikator, Beyond the Bands , ist die Lösung, auf die Sie gewartet haben. Dieses leistungsstarke Tool nutzt die klassische Bollinger-Band-Strategie und erweitert sie um einen intelligenten EMA-Filter, der Ihnen genauere und zuverlässigere Signale als je zuvor liefert. Es wurde entwickelt, um Ihnen zu helfen, Einstiegspunkte mit hoher Wahrscheinlichkeit zu finden und falsche Signal
FREE

Precision Entry Master: Ihr Schlüssel zu sicherem Handel Haben Sie es satt, Ihre Trades immer wieder neu zu bewerten? Der Precision Entry Master-Indikator wurde entwickelt, um Ihnen zu helfen, hochwertige Einstiegspunkte mit Zuversicht zu finden. Er kombiniert zwei leistungsstarke Marktanalysen, um Ihnen ein klares Signal zu geben, das Rauschen und falsche Signale herausfiltert, damit Sie sich auf die besten Gelegenheiten konzentrieren können. Unser einzigartiges System funktioniert, indem es de
FREE

MA Cross Histogram Oscillator (MT4) Der MA Cross Histogram Oscillator ist ein benutzerdefinierter Indikator, der die Beziehung zwischen zwei gleitenden Durchschnitten in Form eines farbkodierten Histogramms visualisiert. Anstatt Standard-MA-Linien auf dem Chart zu zeichnen, hebt er die Stärke und Richtung des Trends hervor, indem er die Differenz zwischen einem schnellen und einem langsamen gleitenden Durchschnitt vergleicht. Grüne Balken - bullisches Momentum (der schnelle MA liegt über dem lan
FREE
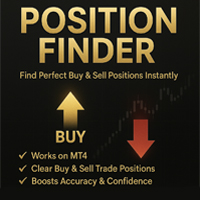
Der "POSITION FINDER"-Indikator kombiniert visuell benutzerdefinierte Fibonacci-Retracement-Levels mit einem Relative Strength Index (RSI) Overlay, um wichtige Preiszonen und Momentum-Signale auf dem Chart hervorzuheben. Er markiert wichtige Unterstützungs- und Widerstandsbereiche, die sich aus den jüngsten Höchst- und Tiefstständen ableiten, und zeigt RSI-Werte an, um mögliche überkaufte und überverkaufte Bedingungen sowie Kauf- und Verkaufssignale für eine einfachere Marktanalyse zu erkennen.
Der BLACK ZONE PREMIUM INDICATOR ist ein leistungsstarker All-in-One-Handelsassistent, der Klarheit, Präzision und Konsistenz in den Devisenhandel bringt. Er kombiniert Multi-Timeframe-Marktstruktur, Handelsprognosen, Risikomanagement und Live-Überwachung in einem einzigen professionellen Tool. Von der Planung von Trades bis hin zu deren diszipliniertem Management gibt dieser Indikator Händlern alles an die Hand, was sie brauchen, um fundierte und sichere Entscheidungen zu treffen. Wenn Sie auf
SuperSignalsX ist ein moderner Indikator, der entwickelt wurde, um die Marktanalyse zu vereinfachen und sie visueller und effektiver zu gestalten.
Seine Hauptfunktion ist die automatische Erkennung lokaler Hochs und Tiefs auf der Grundlage der Average True Range (ATR). An diesen Punkten platziert der Indikator klare Markierungen in Form von Kreisen mit Pfeilen, die es dem Händler ermöglichen, sich auch unter sehr volatilen Marktbedingungen schnell zu orientieren. Der Einsatz von SuperSignalsX st

Super Signal Serie - V19 PRO Golden Trend Matrix Signals- Multi-Filter Trend & Momentum Indikator (H1/H4)
Exklusiver Bonus Wenn Sie diesen Indikator kaufen, erhalten Sie 2 professionelle Gold EAs: MT4 Gold EA
XAU Trend Matrix EA - Im Wert von $150 : Siehe den EA https://www.mql5.com/en/market/product/162870 MT5 Gold EA
XAU Steady Gain Pro - Im Wert von $150 : Siehe den EA https://www.mql5.com/en/market/product/162861 Gesamter Bonuswert: $300
Verwandeln Sie verrauschte Charts in saubere, handelb

Super Signal Serie - V20 PRO Momentum Matrix Pro - Multi-Strategy Signal Dashboard
Exklusiver Bonus Wenn Sie diesen Indikator kaufen, erhalten Sie 2 professionelle Gold EAs: MT4 Gold EA
XAU Trend Matrix EA - Im Wert von $150 : Siehe den EA https://www.mql5.com/en/market/product/162870 MT5 Gold EA
XAU Steady Gain Pro - Im Wert von $150 : Siehe den EA https://www.mql5.com/en/market/product/162861 Gesamter Bonuswert: $300
Momentum Matrix Pro ist ein leistungsstarker Multi-Symbol- und Multi-Strateg

EMA Volume Confluence Indicator - Überblick Was er tut: Es handelt sich um einen Multi-Timeframe-Momentum-Indikator , der Trendfolge, Volumenanalyse und Volatilitätsbänder kombiniert, um hochwahrscheinliche Handels-Setups zu identifizieren. Hauptbestandteile: EMA 7 (Blau) - Schnelle Trendlinie EMA 21 (Orange) - Langsame Trendlinie VWAP (Violett) - Volumengewichteter Durchschnittspreis (institutionelle Ebene) ATR-Bänder (Rot/Grün) - Volatilitätskanal um EMA 21 Info-Panel - Echtzeit-Metriken (RSI,
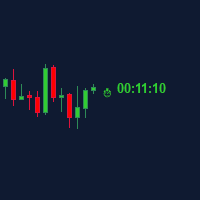
Kerzenzeit (MT4) Der Indikator Candle Time zeigt die verbleibende Zeit für die aktuelle Kerze im aktiven Chart-Zeitrahmen an. Er passt sich automatisch an die Chartperiode an und wird bei jedem Tick aktualisiert. Es handelt sich um ein Charting-Hilfsprogramm; es liefert keine Handelssignale und garantiert keine Gewinne. Wichtigste Funktionen Anzeige der verbleibenden Zeit für die aktuelle Kerze auf jedem Zeitrahmen (M1 bis MN). Farbkodierter Status: grün, wenn der Kurs über der Eröffnung liegt
FREE
NPerdana - N-Muster-Detektor Der NPerdana-Indikator ist ein automatischer Indikator, der es dem Händler ermöglicht, den Bereich des N-Musters im Chart zu erkennen, wenn er den Bereich des N-Musters nicht kennt ( ), und wenn er im Chart nicht auf den Punkt kommt. Dengan ini, trader bisa cepat melihat area ranging atau yang biasa disebut dengan pola N sebelum kemungkinan terjadi breakout. Rasio Lebar Area Ranging - menentukan seberapa besar lebar area ranging yang ditampilkan. Jumlah Candle Rangi
Der MetaTrader Market ist die beste Plattform für den Verkauf von Handelsroboter und technischen Indikatoren.
Sie brauchen nur ein gefragtes Programm für die MetaTrader Plattform schreiben und schön gestalten sowie eine Beschreibung hinzufügen. Wir helfen Ihnen, das Produkt im Market Service zu veröffentlichen, wo Millionen von MetaTrader Benutzern es kaufen können. Konzentrieren Sie sich auf dem Wesentlichen - schreiben Sie Programme für Autotrading.
Sie verpassen Handelsmöglichkeiten:
- Freie Handelsapplikationen
- Über 8.000 Signale zum Kopieren
- Wirtschaftsnachrichten für die Lage an den Finanzmärkte
Registrierung
Einloggen
Wenn Sie kein Benutzerkonto haben, registrieren Sie sich
Erlauben Sie die Verwendung von Cookies, um sich auf der Website MQL5.com anzumelden.
Bitte aktivieren Sie die notwendige Einstellung in Ihrem Browser, da Sie sich sonst nicht einloggen können.