Institutional Liquidity Map Pro
- 지표
- 버전: 2.6
- 활성화: 5

Institutional Liquidity Map Pro is a professional MetaTrader 5 indicator designed to map institutional liquidity zones using monthly highs and lows.
It automatically detects stop-hunt areas, potential reversal zones, and institutional accumulation/distribution levels.
The indicator dynamically tracks up to three liquidity levels on both buy and sell sides, updated in real time.
Key Features:
- Automatic detection of monthly high/low levels
- Real-time institutional liquidity zones (buy/sell)
- Dynamic tracking of 3 liquidity sweep levels
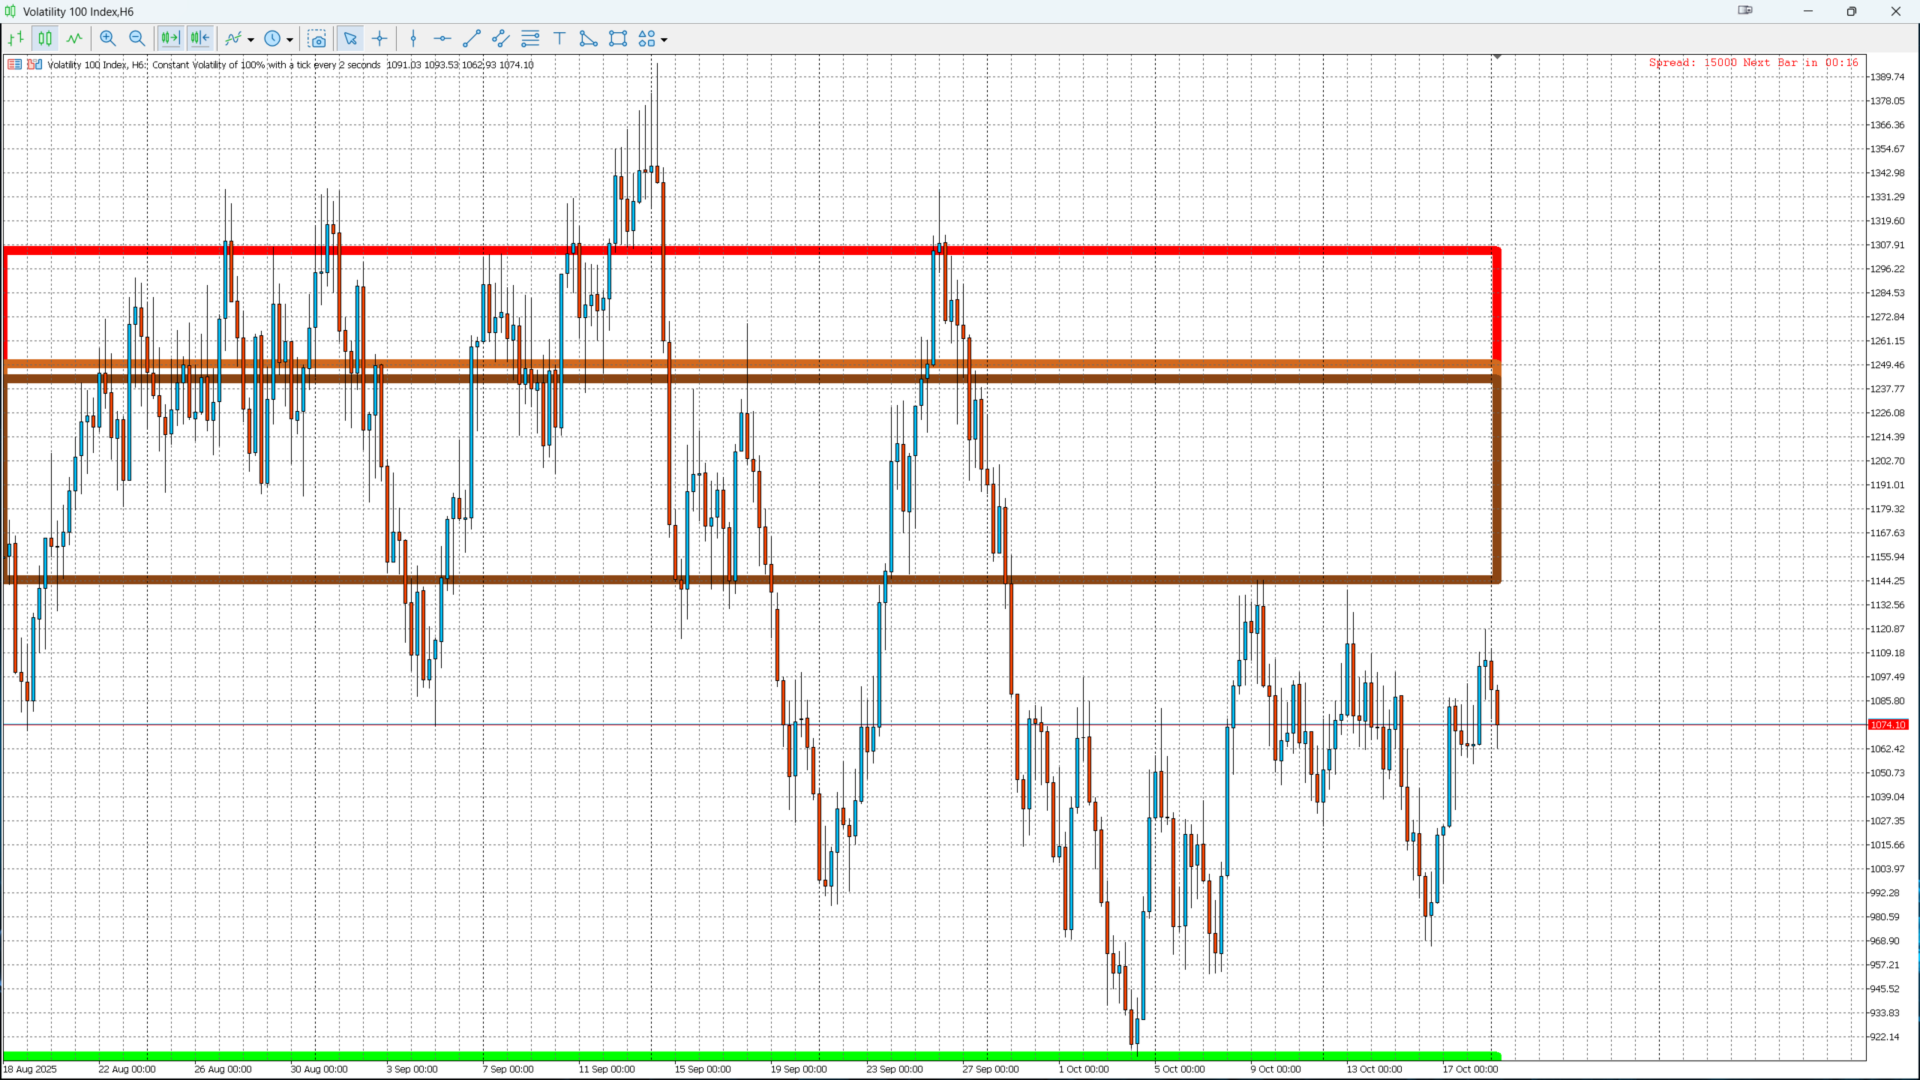
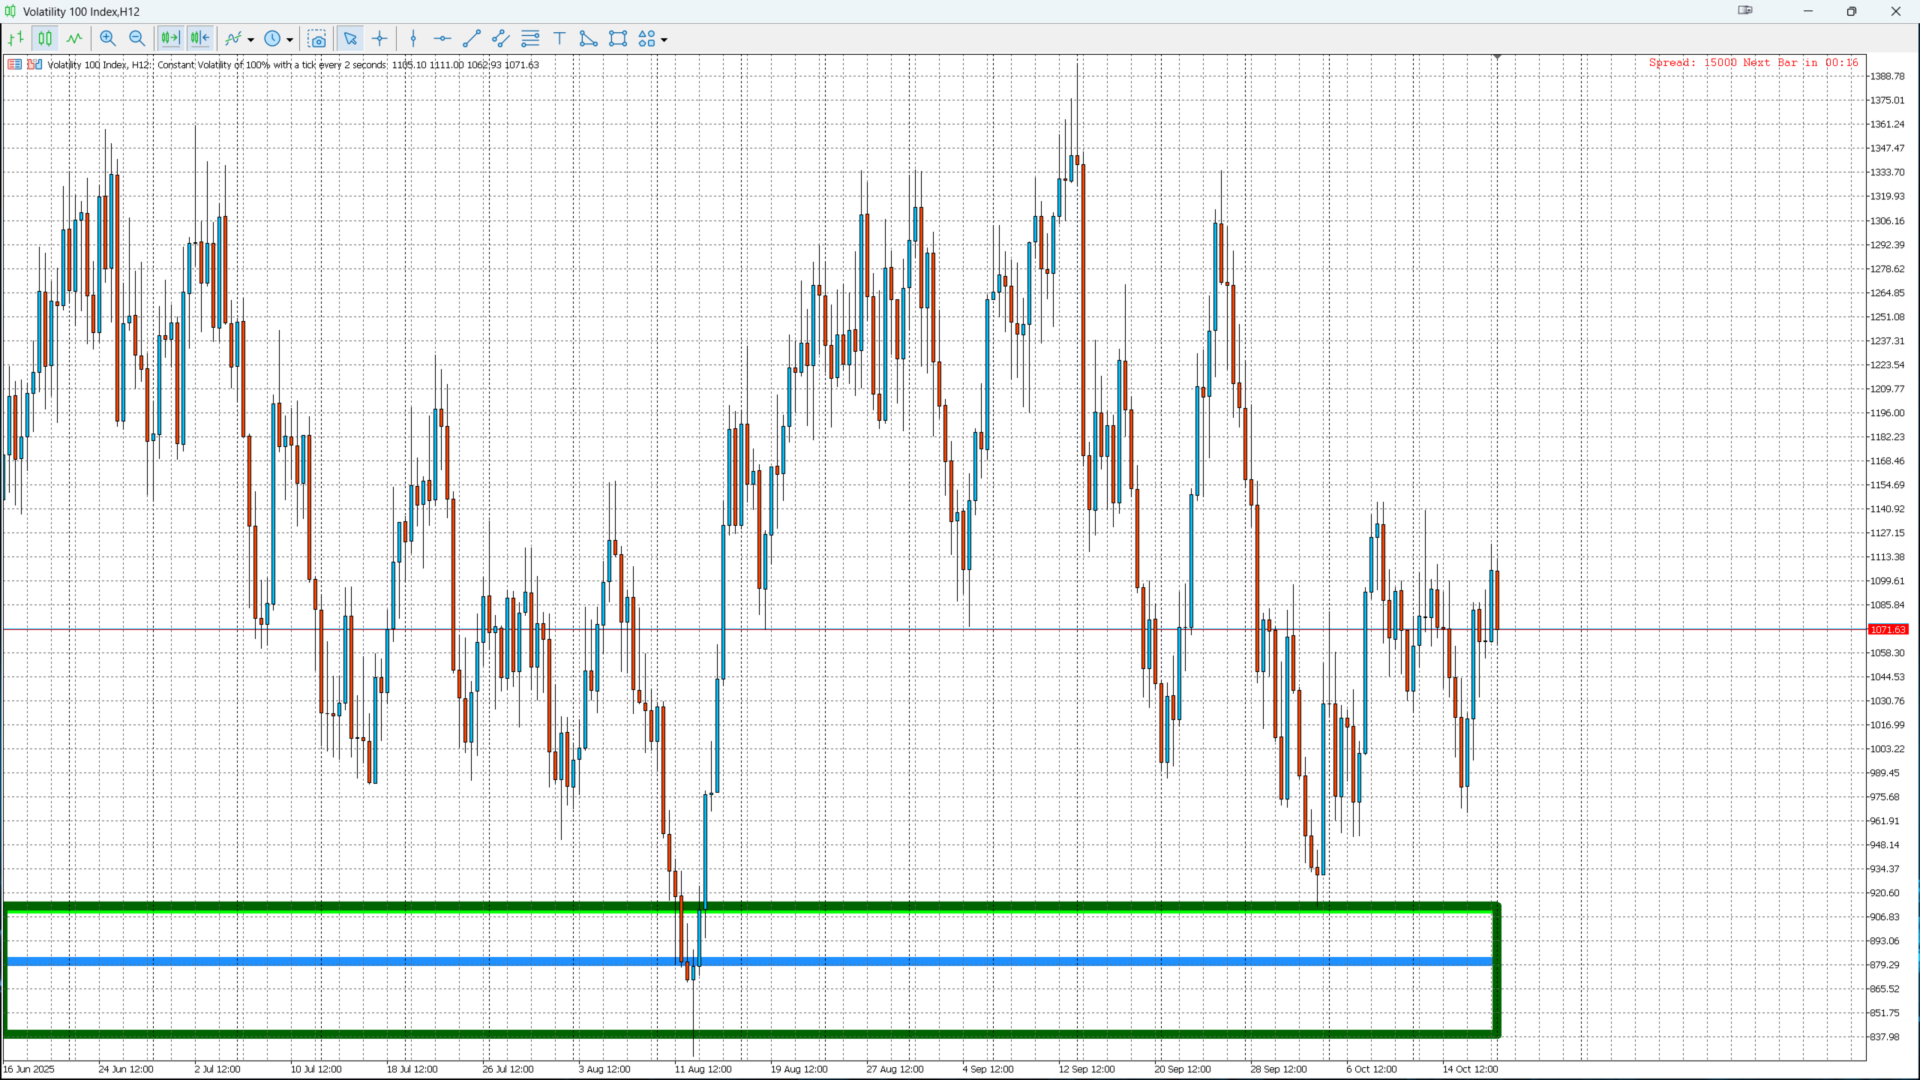
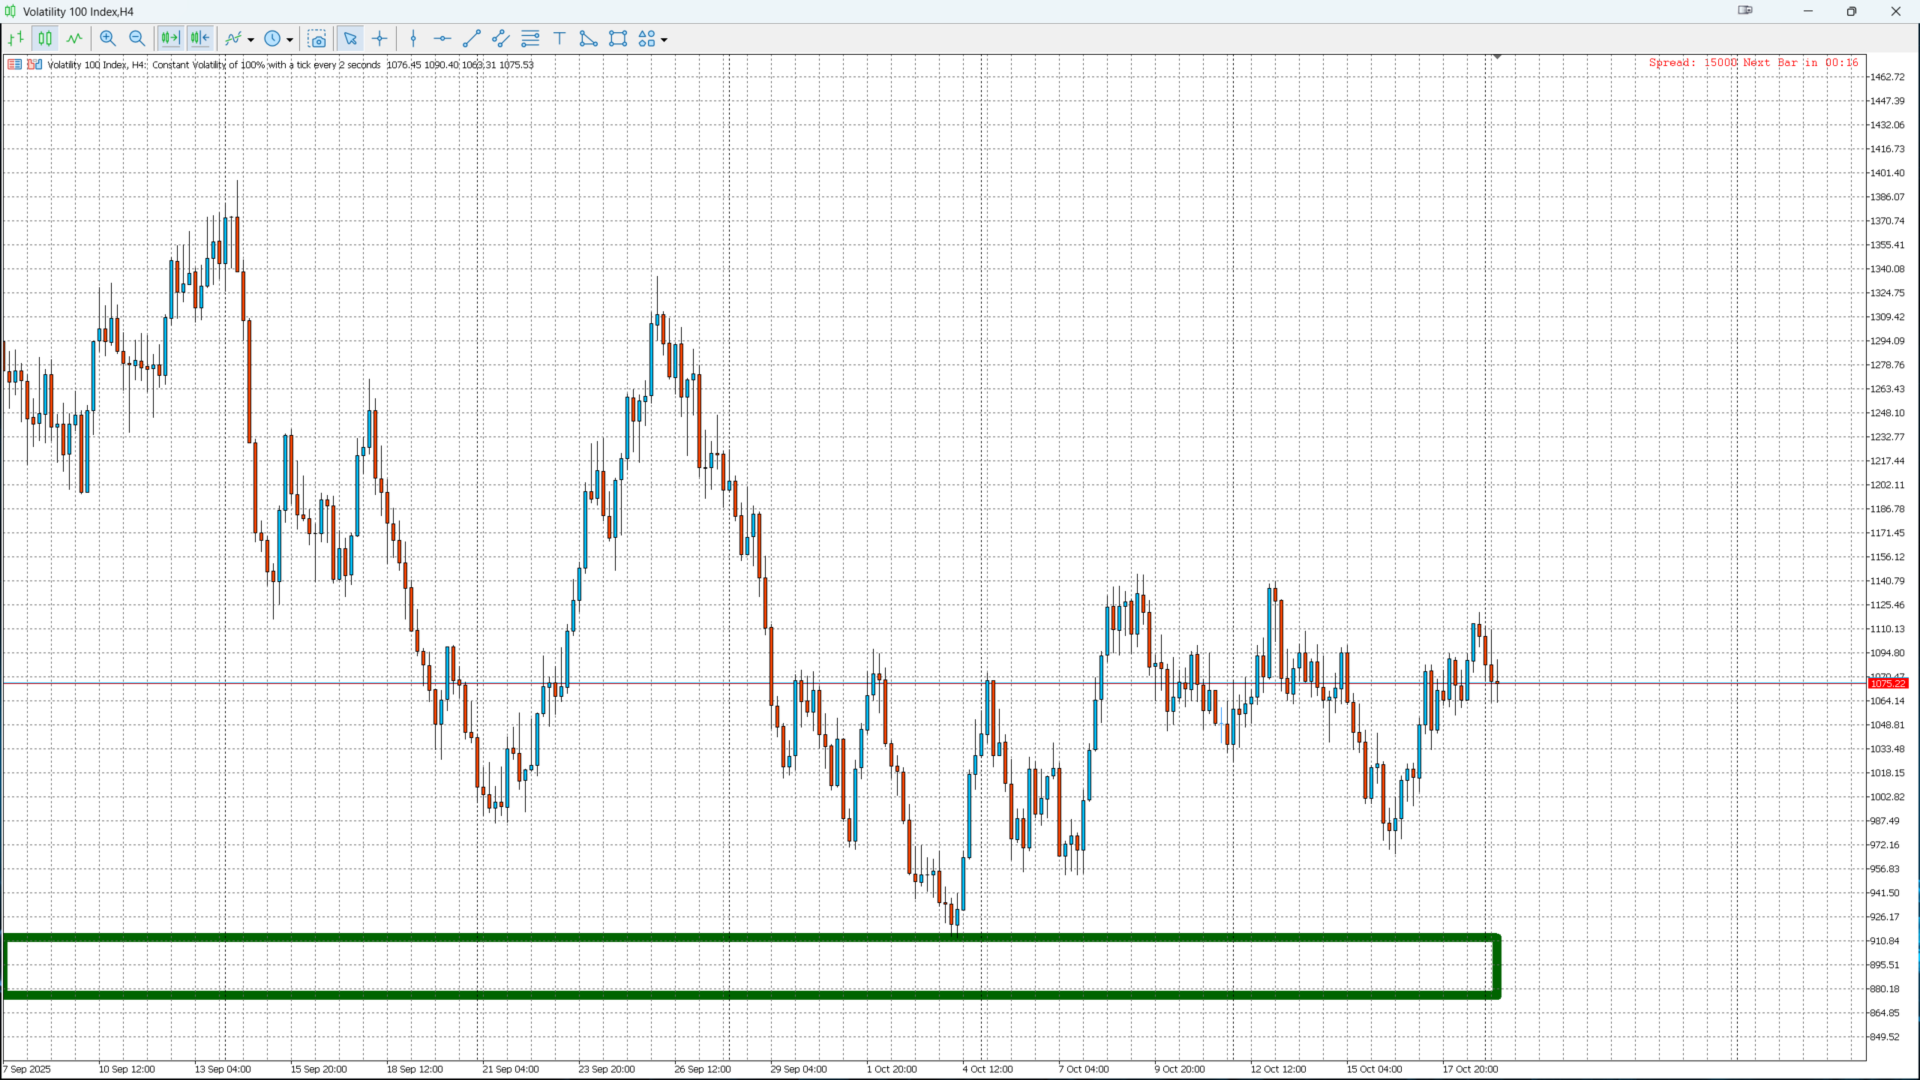
- Colored rectangles for clear zone visualization
- Separation of current and historical liquidity levels
- Works on Forex, indices, metals, and cryptocurrencies
- Fully compatible with other indicators and Expert Advisors
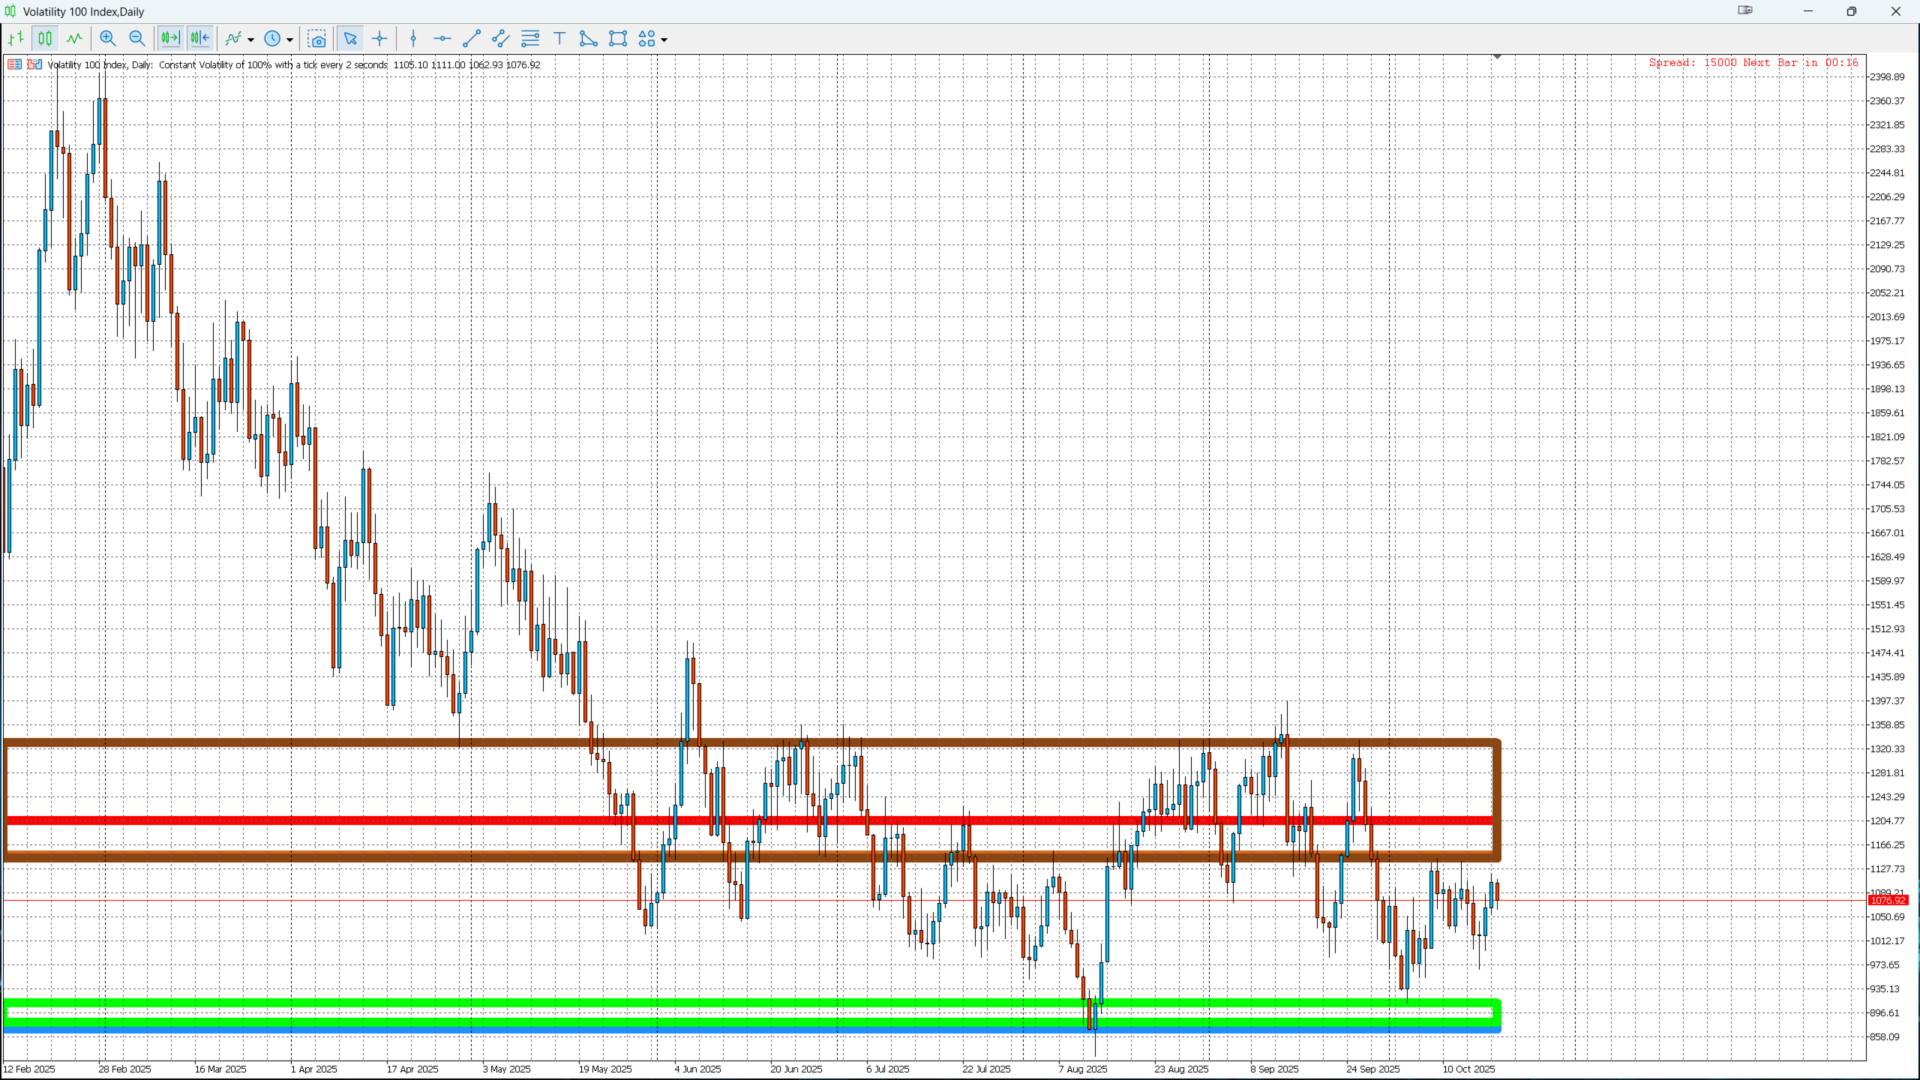
Core Idea:
- Blue/Green zones → Buy-side liquidity (demand zones)
- Red/Brown zones → Sell-side liquidity (supply zones)
Price reactions in these zones often lead to reversals or strong impulsive moves.