• Información general
  • Comentarios (14)
  • Discusión (38)
  • Novedades

Harmonic Butterfly

The indicator detects and displays М. Gartley's Butterfly pattern. The pattern is plotted by the extreme values of the ZigZag indicator (included in the resources, no need to install). After detecting the pattern, the indicator notifies of that by the pop-up window, a mobile notification and an email. The pattern and wave parameters are displayed on the screenshots. The default parameters are used for demonstration purposes only in order to increase the amount of detected patterns.


Parameters

  • zzDepth, zzDev, zzBack - ZigZag parameters
  • factorAB_min, factorAB_max - minimum and maximum ratio of AB and AX levels (see the screenshot)
  • factorBC_min, factorBC_max - minimum and maximum ratio of BС and AB levels (see the screenshot)
  • factorCD_min, factorCD_max - minimum and maximum ratio of CD and BC (see the screenshot)
  • factorAD_min, factorAD_max - minimum and maximum ratio of AD and AX (see the screenshot)
  • bearColor - bearish pattern color
  • bullColor - bullish pattern color
  • CountBars - limit the amount of bars to be processed by the indicator (reduces the initial download time)
  • UseAlert - enable pop-up messages
  • UseNotification - enable push notifications
  • UseMail - enable email notifications
  • CustomEventBuy,CustomEventSell - chart events

Sample to use signals in EA:

void OnTick() {
 double x;
 x = iCustom(Symbol(),PERIOD_CURRENT,"Harmonic-Butterfly",0,1); if (x != 0 && x != EMPTY_VALUE) goBuy();
 x = iCustom(Symbol(),PERIOD_CURRENT,"Harmonic-Butterfly",2,1); if (x != 0 && x != EMPTY_VALUE) goSell();
}

void goBuy() { // function for open BUY
}

void goSell() { // function for open SELL
}
void OnChartEvent(const int id, const long &lparam, const double &dparam, const string &sparam) {
 switch (id) {
  case CHARTEVENT_CUSTOM+100: 
   goBuy(); break;
  case CHARTEVENT_CUSTOM+101: 
   goSell(); break;
 }
}

void goBuy() { // function for open BUY
}

void goSell() { // function for open SELL
}


Productos recomendados
The indicator detects and displays Shark harmonic pattern (see the screenshot). The pattern is plotted by the extreme values of the ZigZag indicator (included in the resources, no need to install). After detecting the pattern, the indicator notifies of that by a pop-up window, a mobile notification and an email. The indicator highlights the process of the pattern formation and not just the complete pattern. In the former case, it is displayed in the contour triangles. After the pattern is comple
RenkoMaSignals
Sergey Deev
1 (1)
The indicator displays Renko bars on the chart, plots two moving averages by them and generates buy/sell signals based on the conditions displayed in the screenshots and described below: the buy signal is formed if the fast moving average is above the slow moving average, from 4 to 10 consecutive bullish Renko bars are displayed, followed by no more than 2 bearish and one bullish Renko bars; the sell signal is formed if the fast moving average is below the slow moving average, from 4 to 10 conse
The indicator detects and displays 3 Drives harmonic pattern (see the screenshot). The pattern is plotted by the extreme values of the ZigZag indicator (included in the resources, no need to install). After detecting the pattern, the indicator notifies of that by a pop-up window, a mobile notification and an email. The indicator highlights the process of the pattern formation and not just the complete pattern. In the former case, it is displayed in the contour triangles. After the pattern is com
El indicador "Auto FIBO Pro" de Crypto_Forex es una gran herramienta auxiliar para operar. - El indicador calcula y coloca automáticamente en el gráfico los niveles de Fibonacci y las líneas de tendencia locales (color rojo). - Los niveles de Fibonacci indican áreas clave donde el precio puede revertirse. - Los niveles más importantes son 23,6 %, 38,2 %, 50 % y 61,8 %. - Puede usarlo para scalping de reversión o para operar en cuadrículas de zonas. - También existen muchas oportunidades para m
Vanexio
Sayan Vandenhout
VANEXIO USES THE TREND WAVE INDICATOR AND IT CAN IDENTIFY THE BEGINNING AND THE END OF A NEW WAVE TREND MOVEMENT. AS AN OSCILLATOR, THE INDICATOR IDENTIFIES THE OVERBOUGHT AND OVERSOLD ZONES. IT WORKS GREAT TO CATCH THE SHORT TERM PRICE REVERSALS AND USES A MARTINGALE STRATEGY TO CLOSE ALL TRADES IN PROFIT. USE DEFAULT SETTINGS ON H1 OR HIGHER TIME FRAME ON ANY PAIR FOR MORE ACCURATE TRADES WHY THIS EA : Smart entries calculated by 5 great strategies The EA can be run on even a $20000 acco
FREE
PZ Penta O MT4
PZ TRADING SLU
2.33 (3)
The Penta-O is a 6-point retracement harmonacci pattern which usually precedes big market movements. Penta-O patterns can expand and repaint quite a bit. To make things easier this indicator implements a twist: it waits for a donchian breakout in the right direction before signaling the trade. The end result is an otherwise repainting indicator with a very reliable trading signal. The donchian breakout period is entered as an input. [ Installation Guide | Update Guide | Troubleshooting | FAQ | A
FREE
MACD Divergence Finder es un Indicador que ayuda a encontrar divergencias entre los valores del MACD defindo y el precio del activo como potenciales puntos de cambio de la tendencia actual o pull backs para incrementar posiciones en favor a la tendencia actual. Se muestra el valor MACD, no el de Signal pues no es relevante para detectar este tipo de Divergencias Clásicas. En algunos equipos con microprocesador antiguo o baja RAM, al iniciar el indicador (añadirlo, cambiar valores, resetearlo o b
El Capturador de Tendencias: La Estrategia del Capturador de Tendencias con Indicador de Alerta es una herramienta versátil de análisis técnico que ayuda a los traders a identificar las tendencias del mercado y los posibles puntos de entrada y salida. Presenta una Estrategia dinámica del Capturador de Tendencias, adaptándose a las condiciones del mercado para una clara representación visual de la dirección de la tendencia. Los traders pueden personalizar los parámetros para que se ajusten a su
FREE
Free automatic Fibonacci is an indicator that automatically plots a Fibonacci retracement based on the number of bars you select on the BarsToScan setting in the indicator. The Fibonacci is automatically updated in real time as new highest and lowest values appears amongst the selected bars. You can select which level values to be displayed in the indicator settings. You can also select the color of the levels thus enabling the trader to be able to attach the indicator several times with differe
FREE
Tipu Heikin Ashi Panel
Kaleem Haider
4.56 (18)
Tipu Heikin-Ashi Panel is the modified version of the original Heiken Ashi indicator published by MetaQuotes here . A professional version of this indicator is available here . Features An easy to use Panel that shows the Heiken Ashi trend of selected timeframe. Customizable Buy/Sell alerts, push alerts, email alerts, or visual on-screen alerts. Customizable Panel. The panel can be moved to any place on the chart or minimized to allow more space. Heikin means "the average", and Ashi means "foot
FREE
OrderBlock TS Roman
Vladislav Vlastovskii
3.8 (5)
Индикатор строит блоки заказов (БЗ) по торговой системе (ТС) Романа. Поиск блоков осуществляется одновременно на двух таймфремах: текущем и старшем (определяемым в настройках). Для оптимизации и игнорирования устаревших блоков в настройках задается ограничение количества дней в пределах которых осуществляется поиск блоков. Блоки строятся по правилам ТС состоящем из трех шагов: какую свечу вынесли (что?); какой свечой вынесли (чем?); правило отрисовки (как?).
FREE
TrendPlus
Sivakumar Subbaiya
4.07 (14)
Trend Plus   Trendplus  Indicator   Time Frame: Suitable for any time frame.  Purpose: Trend Prediction. Blue and red candle indicate the buy and sell call respectively. Buy: When the blue candle is formed buy call is initiated. close the buy trades when the next red candle will formed.   Sell: When the Red candle is formed Sell call is initiated. close the Sell trades when the next blue candle will formed.   Happy trade!!
FREE
Quants HL Break
Ferhat Mutlu
5 (1)
Cálculo avanzado realizado por la acción del precio puro para encontrar rupturas LH y HL. Le dará un gran punto de inversión en el mercado.Las señales LH y HL también se pueden usar para las rupturas de traingle. Una vez que ocurre la ruptura, indica una fuerte reversión. Buen filtro para promedios móviles. Sugiero usarlo con indicadores de tendencia. Se puede utilizar como una confirmación adicional de soporte y resistencia, indicadores de oferta y demanda. Se pueden encontrar más detalles e
The main idea of this indicator is rates analysis and prediction by Fourier transform. Indicator decomposes exchange rates into main harmonics and calculates their product in future. You may use the indicator as a standalone product, but for better prediction accuracy there is another related indicator - FreqoMaster - which uses FreqoMeterForecast as a backend engine and combines several instances of FreqoMeterForecast for different frequency bands. Parameters: iPeriod - number of bars in the ma
Trend Ray
Andriy Sydoruk
The indicator shows the potential trend direction by cyclical-wave dependence. Thus, all the rays of the intersection will be optimal rays, in the direction of which the price is expected to move, taking into account the indicator period. Rays can be used as a direction for potential market movement. But we must not forget that the approach must be comprehensive, the indicator signals require additional information to enter the market.
Wave Reversal Indicator - determina la dirección y las inversiones de precio alrededor de la línea de equilibrio. El indicador muestra movimientos ondulatorios y aumentos repentinos de tendencias. Da recomendaciones sobre dónde seguir al comerciante y le ayuda a seguir la estrategia comercial. Es una adición a una estrategia intradiaria o de mediano plazo. Casi todos los parámetros se seleccionan para cada período de tiempo y cambian automáticamente; el único parámetro para el ajuste manual es
FREE
Wise Men Indicator demo
Bohdan Kasyanenko
3 (2)
The indicator displays signals according to the strategy of Bill Williams on the chart. Demo version of the indicator has the same features as the paid, except that it can work only on a demo account . Signal "First Wise Man" is formed when there is a divergent bar with angulation.  Bullish divergent bar - with lower minimum and closing price in the upper half. Bearish divergent bar - higher maximum and the closing price at the bottom half. Angulation is formed when all three lines of Alligator
FREE
El indicador crea un abanico de líneas de tendencia (después de hacer clic en una vela determinada), similar a los ángulos de Gann clásicos. La peculiaridad del indicador es que construye ángulos no solo en una escala fija, sino que también utiliza el precio promedio de un cierto número de barras (opcional). Hay dos formas de calcular el precio medio de los ángulos en el indicador (opcional): 1) cálculo del movimiento del precio promedio (para un cierto número de barras) de Máximo a Mínimo; 2
Nen Star Harmonic Pattern Indicator for MetaTrader 4 The Nen Star Harmonic Pattern Indicator is an advanced tool in technical analysis that relies on Fibonacci ratios to identify potential price reversal zones. This pattern is used by traders to spot precise turning points in the market. The structure consists of five key points: X, A, B, C, and D, and can appear in both bullish and bearish trends. In bullish formations, it resembles the letter "M", while in bearish setups, the pattern forms a
FREE
FFx Momentum
Eric Venturi-Bloxs
4 (1)
The purpose of this new version of the MT4 standard indicator provided in your platform is to display in a sub-window multiple timeframes of the same indicator. See the example shown in the picture below. But the display isn’t like a simple MTF indicator. This is the real display of the indicator on its timeframe. Here's the options available in the FFx indicator: Select the timeframes to be displayed (M1 to Monthly) Define the width (number of bars) for each timeframe box Alert pop up/sound/ema
FREE
Basic Theme Builder
Mehran Sepah Mansoor
5 (1)
Constructor de Temas Básico: Simplifica la Personalización de Tu Gráfico Transforma tu experiencia de trading con el   Constructor de Temas Básico , un indicador versátil diseñado para simplificar la personalización de la apariencia de tu gráfico en MetaTrader 4. Este intuitivo indicador ofrece un panel fácil de usar que te permite cambiar entre varios temas y esquemas de color con facilidad, mejorando tanto el atractivo visual como la funcionalidad de tu entorno de trading.   Free MT5 version
FREE
MT5 Version Most indicators draw lines. This one draws the battlefield. If you ever bought an EA or indicator based on a perfect equity curve — and then watched it bleed out live — you’re not alone. The problem? Static logic in a dynamic market. Fibonacci Bollinger Bands   adapts. It combines Bollinger structure with customizable Fibonacci levels to mark   zones of control   — where price reacts, pauses, or reverses. No magic. Just logic that follows volatility. Why this tool matters   It
FREE
Basic Harmonic Pattern
Mehran Sepah Mansoor
4.56 (57)
Este indicador identifica los patrones armónicos más populares que predicen los puntos de reversión del mercado. Estos patrones armónicos son formaciones de precios que se repiten constantemente en el mercado de divisas y sugieren posibles movimientos futuros de los precios / Free MT5 Version Además, este indicador tiene incorporada una señal de entrada en el mercado, así como varios take profits y stop losses. Debe tenerse en cuenta que aunque el indicador de patrón armónico puede proporcionar
FREE
Trend PA
Mikhail Nazarenko
5 (3)
The Trend PA indicator uses   Price Action   and its own filtering algorithm to determine the trend. This approach helps to accurately determine entry points and the current trend on any timeframe. The indicator uses its own algorithm for analyzing price changes and Price Action. Which gives you the advantage of recognizing, without delay, a new nascent trend with fewer false positives. Trend filtering conditions can be selected in the settings individually for your trading style. The indicator
ZZVolna
ANTON IVANOV
Otra versión de ZigZag con filtros adicionales para dibujar y encontrar picos y tierras bajas. Muy adecuado para el comercio manual, también puede utilizar estos picos y tierras bajas para el asesor y calcularlos. Además, todas las funciones del ZigZag original permanecen. Los filtros adicionales son AO y estocástico. Funciona en todos los instrumentos y plazos.
FlatBreakout
Aleksei Vorontsov
FlatBreakout (Free Version) Flat Range Detector and Breakout Panel for MT4 — GBPUSD Only FlatBreakout is the free version of the professional FlatBreakoutPro indicator, specially designed for flat (range) detection and breakout signals on the GBPUSD pair only. Perfect for traders who want to experience the unique fractal logic of FlatBreakout and test breakout signals on a live market without limitations. Who Is This Product For? For traders who prefer to trade breakout of flat ranges (breakout,
FREE
Basado en ondas indicadoras MACD con parámetros estándar Aplica los niveles de Fibonacci a las dos últimas ondas MACD, positivas y negativas respectivamente, si en el momento en que el indicador MACD se queda sin Onda negativa - el color es verde, si en el momento en que el indicador MACD se queda sin Onda positiva - el color es rojo. El criterio de terminación de onda son dos ticks con un signo MACD diferente. Aplica líneas de tendencia en las últimas cuatro ondas MACD. Trabaja bien con e
Follow The Line
Oliver Gideon Amofa Appiah
3.94 (16)
FOLLOW THE LINE GET THE FULL VERSION HERE: https://www.mql5.com/en/market/product/36024 This indicator obeys the popular maxim that: "THE TREND IS YOUR FRIEND" It paints a GREEN line for BUY and also paints a RED line for SELL.  It gives alarms and alerts of all kinds. IT DOES NOT REPAINT and can be used for all currency pairs and timeframes. Yes, as easy and simple as that. Even a newbie can use it to make great and reliable trades. NB: For best results, get my other premium indicators for more
FREE
Traditional MACD MT4
Daniel Lewis
4.58 (55)
El indicador MACD en MetaTrader 4/5 se diferencia de los semejantes indicadores en otros programas. Eso se debe al hecho de que en la versión MetaTrader 4/5 la línea MACD se muestra en forma del histograma, mientras que habitualmente se muestra en forma de la línea. Además, en la versión MetaTrader 4/5 la línea de señal se construye con el uso de SMA, mientras que por definición tiene que construirse usando EMA. En la versión MetaTrader 4/5 también se diferencia el histograma (la diferencia entr
FREE
Los compradores de este producto también adquieren
Gann Made Easy
Oleg Rodin
4.81 (133)
Gann Made Easy es un sistema de comercio de Forex profesional y fácil de usar que se basa en los mejores principios de comercio utilizando la teoría del Sr. W. D. Gann. El indicador proporciona señales precisas de COMPRA y VENTA, incluidos los niveles de Stop Loss y Take Profit. Puede comerciar incluso sobre la marcha utilizando notificaciones PUSH. ¡Por favor, póngase en contacto conmigo después de la compra! ¡Compartiré mis consejos comerciales con usted y excelentes indicadores de bonificació
M1 Sniper
Oleg Rodin
5 (7)
M1 SNIPER es un sistema de indicadores de trading fácil de usar. Se trata de un indicador de flecha diseñado para el marco temporal M1. Puede utilizarse como sistema independiente para scalping en M1 o como parte de su sistema de trading actual. Aunque este sistema de trading fue diseñado específicamente para operar en M1, también puede utilizarse con otros marcos temporales. Originalmente, diseñé este método para operar con XAUUSD y BTCUSD. Sin embargo, también lo encuentro útil para operar en
Algo Pumping MT4
Ihor Otkydach
4.92 (13)
PUMPING STATION – Tu estrategia personal "todo incluido" Te presentamos PUMPING STATION, un indicador revolucionario para Forex que transformará tu forma de operar en una experiencia emocionante y eficaz. No es solo un asistente, sino un sistema de trading completo con potentes algoritmos que te ayudarán a operar de forma más estable. Al comprar este producto, recibes GRATIS: Archivos de configuración exclusivos: para una configuración automática y un rendimiento óptimo. Manual en video paso a p
El indicador MT4 "Binary Smart Eye" está diseñado para proporcionar señales de trading tanto para opciones binarias como para mercados de divisas (forex), operando en una amplia gama de marcos de tiempo, desde M1 hasta W1. Emplea una estrategia propietaria que combina niveles de tendencia, una media móvil inteligente y períodos de trading optimizados para identificar posibles puntos de entrada. Aquí tienes un desglose de sus características clave: Análisis de múltiples marcos de tiempo:   La ver
Cycle Maestro
Stefano Frisetti
1 (1)
NOTA: CYCLEMAESTRO se distribuye únicamente en este sitio web; no existen otros distribuidores. La versión demo es solo de referencia y no cuenta con soporte. La versión completa funciona perfectamente y cuenta con soporte. CYCLEMAESTRO, el primer y único indicador de análisis cíclico, útil para generar señales de trading, compra, venta, stop loss y adición. Creado con la lógica de Serghei Istrati y programado por Stefano Frisetti, CYCLEMAESTRO no es un indicador como los demás. El reto cons
Dynamic Forex28 Navigator
Bernhard Schweigert
5 (5)
Dynamic Forex28 Navigator: la herramienta de trading de Forex de última generación. ACTUALMENTE CON UN 49 % DE DESCUENTO. Dynamic Forex28 Navigator es la evolución de nuestros indicadores populares de larga data, que combina el poder de tres en uno: Indicador avanzado Currency Strength28 (695 reseñas) + Indicador avanzado Currency IMPULSE con ALERT (520 reseñas) + Señales combinadas CS28 (bonificación). Detalles sobre el indicador https://www.mql5.com/en/blogs/post/758844 ¿Qué ofrece el indi
Scalper Inside PRO
Alexey Minkov
4.74 (66)
An exclusive indicator that utilizes an innovative algorithm to swiftly and accurately determine the market trend. The indicator automatically calculates opening, closing, and profit levels, providing detailed trading statistics. With these features, you can choose the most appropriate trading instrument for the current market conditions. Additionally, you can easily integrate your own arrow indicators into Scalper Inside Pro to quickly evaluate their statistics and profitability. Scalper Inside
Advanced Supply Demand
Bernhard Schweigert
4.91 (295)
¡Actualmente con 33% de descuento! ¡La mejor solución para cualquier tráder principiante o experto! Este indicador es una herramienta comercial única, de alta calidad y asequible, porque incorpora una serie de características patentadas y una nueva fórmula. Con esta actualización, podrá mostrar zonas de doble marco temporal. No solo podrá mostrar un marco temporal más alto, sino también mostrar ambos, el marco temporal del gráfico MÁS el marco temporal más alto: MOSTRANDO ZONAS ANIDADAS. A todos
Señal de flecha de tendencia GoldRush El indicador Señal de flecha de tendencia GoldRush proporciona un análisis preciso y en tiempo real de las tendencias, diseñado específicamente para los operadores de alta velocidad y corto plazo en XAU/USD. Diseñada específicamente para el marco temporal de 1 minuto, esta herramienta muestra flechas direccionales para indicar puntos de entrada claros, lo que permite a los scalpers navegar con confianza por las condiciones volátiles del mercado. El indic
The AT Forex Indicator MT4 is a sophisticated trading tool designed to provide traders with a comprehensive analysis of multiple currency pairs. This   powerful indicator   simplifies the complex nature of the forex market, making it accessible for both novice and experienced traders. AT Forex Indicator uses   advanced algorithms   to detect trends, patterns and is an essential tool for traders aiming to enhance their forex trading performance. With its robust features, ease of use, and reliabl
Indicador único que implementa un enfoque profesional y cuantitativo para el comercio de reversión a la media. Aprovecha el hecho de que el precio se desvía y vuelve a la media de manera predecible y medible, lo que permite reglas claras de entrada y salida que superan ampliamente las estrategias comerciales no cuantitativas. [ Installation Guide | Update Guide | Troubleshooting | FAQ | All Products ] Señales comerciales claras Sorprendentemente fácil de operar Colores y tamaños personalizables
Beast Super Signal
Dustin Vlok
4.73 (89)
¿Está buscando un potente indicador de compraventa de divisas que pueda ayudarlo a identificar oportunidades comerciales rentables con facilidad? No busque más allá de Beast Super Signal. Este indicador basado en tendencias fácil de usar monitorea continuamente las condiciones del mercado, buscando nuevas tendencias en desarrollo o saltando sobre las existentes. Beast Super Signal da una señal de compra o venta cuando todas las estrategias internas se alinean y están en 100% de confluencia entr
Gold Stuff
Vasiliy Strukov
4.85 (262)
Gold Stuff: un indicador de tendencia diseñado específicamente para el oro, también se puede usar en cualquier instrumento financiero. El indicador no se vuelve a dibujar ni se retrasa. El marco de tiempo recomendado es H1. Este indicador está escrito por EA Gold Stuff Advisor, puede encontrarlo en mi perfil.  Puede obtener una copia gratuita de nuestro indicador Strong Support y Trend Scanner, por favor envíe un mensaje privado. ¡a mí! IMPORTANTE! Póngase en contacto conmigo inmediatamente de
ACB Breakout Arrows
KEENBASE SOFTWARE SOLUTIONS
4.15 (34)
El indicador ACB Breakout Arrows proporciona una señal de entrada crucial en el mercado al detectar un patrón de ruptura especial. El indicador escanea constantemente el gráfico para detectar un impulso estable en una dirección y ofrece una señal precisa justo antes del movimiento principal.  Obtén el escáner multisimbolo y multitemporal aquí - Escáner para ACB Breakout Arrows MT4 Características clave El indicador proporciona niveles de Stop Loss y Take Profit. Incluye un panel escáner MTF que
PZ Trend Trading
PZ TRADING SLU
4.8 (5)
Trend Trading es un indicador diseñado para sacar el máximo provecho posible de las tendencias que tienen lugar en el mercado, mediante el cronometraje de retrocesos y rupturas. Encuentra oportunidades comerciales al analizar qué está haciendo el precio durante las tendencias establecidas. [ Guía de instalación | Guía de actualización | Solución de problemas | FAQ | Todos los productos ] Opere en los mercados financieros con confianza y eficiencia Aproveche las tendencias establecidas sin ser
FX Volume
Daniel Stein
4.6 (35)
FX Volume: Experimente el Verdadero Sentimiento del Mercado desde la Perspectiva de un Bróker Resumen Rápido ¿Desea llevar su estrategia de trading a otro nivel? FX Volume ofrece información en tiempo real sobre cómo los traders minoristas y los brókers están posicionados, mucho antes de que aparezcan informes retrasados como el COT. Ya sea que busque beneficios consistentes o simplemente quiera una ventaja más profunda en los mercados, FX Volume le ayuda a identificar desequilibrios important
Trend Screener
STE S.S.COMPANY
4.79 (95)
Indicador de tendencia, solución única e innovadora para el comercio y filtrado de tendencias con todas las funciones de tendencias importantes integradas en una sola herramienta. Es un indicador 100% sin repintar de marcos temporales y monedas múltiples que se puede usar en todos los símbolos/instrumentos: divisas, materias primas, criptomonedas, índices y acciones. OFERTA POR TIEMPO LIMITADO: El indicador de detección de soporte y resistencia está disponible por solo 50$ y de por vida. (Precio
Currency Strength Wizard es un indicador muy poderoso que le proporciona una solución todo en uno para operar con éxito. El indicador calcula el poder de este o aquel par de divisas utilizando los datos de todas las monedas en múltiples marcos de tiempo. Estos datos se representan en forma de índice de moneda fácil de usar y líneas eléctricas de moneda que puede usar para ver el poder de esta o aquella moneda. Todo lo que necesita es adjuntar el indicador al gráfico que desea operar y el indicad
Introduciendo       Indicador Quantum Trend Sniper   , el innovador indicador MQL5 que está transformando la forma en que identificas y negocias los cambios de tendencia. Desarrollado por un equipo de comerciantes experimentados con experiencia comercial de más de 13 años,       Indicador de francotirador de tendencia cuántica       está diseñado para impulsar su viaje comercial a nuevas alturas con su forma innovadora de identificar cambios de tendencia con una precisión extremadamente alta. *
ACTUALMENTE 26% DE DESCUENTO ¡La mejor solución para cualquier operador novato o experto! Este indicador es una herramienta única, de alta calidad y asequible porque hemos incorporado una serie de características propias y una nueva fórmula. ¡Con sólo UN gráfico puede leer la Fuerza de la Divisa para 28 pares de Divisas! Imagínese cómo mejorará su operativa porque podrá señalar el punto exacto de activación de una nueva tendencia o de una oportunidad de scalping. Manual del usuario: haga cli
Special offer : ALL TOOLS , just $35 each! New tools   will be   $30   for the   first week   or the   first 3 purchases !  Trading Tools Channel on MQL5 : Join my MQL5 channel to update the latest news from me Presentamos el revolucionario RSI Kernel Optimized with Scanner, una herramienta de vanguardia que redefine el análisis tradicional de RSI al integrar el poderoso algoritmo de Estimación de Densidad de Núcleo (KDE). Este avanzado indicador no solo proporciona información en tiempo real s
FX Levels MT4
Daniel Stein
5 (2)
FX Levels: Zonas de Soporte y Resistencia con Precisión Excepcional para Todos los Mercados Resumen Rápido ¿Busca una manera confiable de identificar niveles de soporte y resistencia en cualquier mercado — ya sean divisas, índices, acciones o materias primas? FX Levels combina el método tradicional “Lighthouse” con un enfoque dinámico vanguardista, ofreciendo una precisión casi universal. Gracias a nuestra experiencia real con brokers y a las actualizaciones automáticas diarias más las de tiem
M1 Golding
Aleksandr Makarov
5 (1)
Exclusive sale on the MQL5 website. M1 Golding  —  This is an easy to use trading system. It is an arrow indicator designed for the M1-M5 time frame. The indicator can be used as a standalone scalping system, as well as as part of your existing trading system. Bonus: When you buy the indicator, you get a gift - Trend Arrow Super I also provide an additional trend filter indicator absolutely free of charge - Filter The combination of these indicators can help you make your trading easier and more
RelicusRoad Pro
Relicus LLC
4.63 (105)
¿Cuántas veces ha comprado un indicador de trading con excelentes back-tests, pruebas de rendimiento en cuenta real con números fantásticos y estadísticas por todas partes pero después de usarlo, termina quemando su cuenta? No debería confiar en una señal por sí misma, necesita saber por qué apareció en primer lugar, ¡y eso es lo que mejor hace RelicusRoad Pro! Manual de Usuario + Estrategias + Vídeos de Formación + Grupo Privado con Acceso VIP + Versión Móvil Disponible Una Nueva Forma de Ver
Daily Candle Predictor es un indicador que predice el precio de cierre de una vela. El indicador está destinado principalmente para su uso en gráficos D1. Este indicador es adecuado tanto para el comercio de divisas tradicional como para el comercio de opciones binarias. El indicador se puede utilizar como un sistema de negociación independiente o puede actuar como una adición a su sistema de negociación existente. Este indicador analiza la vela actual, calculando ciertos factores de fuerza dent
¡¡ACTUALMENTE 26% DE DESCUENTO !! Este indicador es una super combinación de nuestros dos indicadores principales ( Advanced Currency Strength 28   &  Advanced Currency IMPULSE with ALERT ). Muestra los valores de la Fuerza de la Divisa para TICK-UNIDADES y señales de alerta para 28 pares de divisas. Se pueden utilizar 11 Tick-Units diferentes. Son 1, 2, 3, 4, 5, 6, 10, 12, 15, 20 y 30 segundos. La barra de Tick-Unit en la sub-ventana se mostrará y se desplazará hacia la izquierda cuando haya
Gold Buster M1 System es un sistema de negociación profesional para gráficos M1 en el par XAUUSD. Pero, a pesar de que el sistema se desarrolló originalmente exclusivamente para operar con oro, el sistema también se puede utilizar con otros pares de divisas. Después de la compra, le daré una lista de pares comerciales que se pueden usar con el sistema además de XAUUSD, lo que ampliará sus posibilidades para usar este sistema. ¡TODOS LOS INDICADORES DEL SISTEMA NO SE REPITE! Este sistema es un co
El sistema PRO Renko es un sistema de trading de alta precisión especialmente diseñado para operar gráficos RENKO. Se trata de un sistema universal que se puede aplicar a diversos instrumentos de negociación. El sistema neutraliza eficazmente el llamado ruido de mercado, lo que le brinda acceso a señales de reversión precisas. El indicador es muy fácil de usar y solo tiene un parámetro responsable de la generación de señales. Puede adaptar fácilmente la herramienta a cualquier instrumento come
Elliot Wave Impulse
Mohamed Hassan
4.33 (6)
You can visually backtest Elliot Wave Impulse  to see how it behaved in the past!   Manual guide:   Click here This indicator is unstoppable when combined with our other indicator called Katana . After purchase, send us a message and you could get  it  for  FREE as a BONUS!  The Elliot Wave Impulse is a pattern  identified in the Elliott Wave Theory, a form of technical analysis used to analyze financial market cycles.  The Impulse Wave is considered the strongest and most powerful part of the
Reversal Master
Alexey Minkov
4.79 (14)
The Reversal Master is an indicator for determining the current direction of price movement and reversal points. The indicator will be useful for those who want to see the current market situation better. The indicator can be used as an add-on for ready-made trading systems, or as an independent tool, or to develop your own trading systems. The Reversal Master indicator, to determine the reversal points,  analyzes a lot of conditions since the combined analysis gives a more accurate picture of t
Otros productos de este autor
UniversalEA
Sergey Deev
3.4 (5)
The Expert Advisor allows you to build a trading system based on a custom indicator. It performs automated opening/closing of deals based on the signals of an indicator that places values ​​other than 0 and EMPTY_VALUE in the buffer. The EA polls the values ​​of the specified indicator buffers, opens/closes and accompanies trades according to the specified parameters. The Expert Advisor implements the following trade support functions: - installation for the transaction SL and TP; - calculation
El Asesor Experto le permite construir un sistema de negociación basado en un indicador personalizado. Realiza la apertura/cierre automatizado de las operaciones basándose en las señales de los indicadores de flecha (que almacenan valores distintos de 0 y EMPTY_VALUE) o líneas de color. El EA sondea los valores de los búferes de los indicadores especificados, abre/cierra y acompaña las operaciones según los parámetros especificados. El Asesor Experto implementa las siguientes funciones de apoy
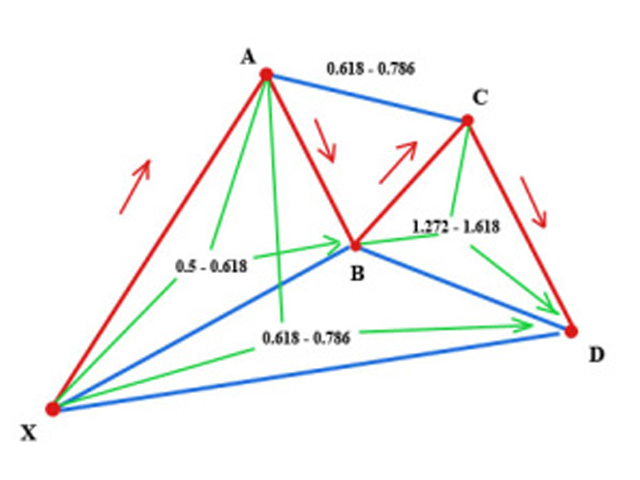
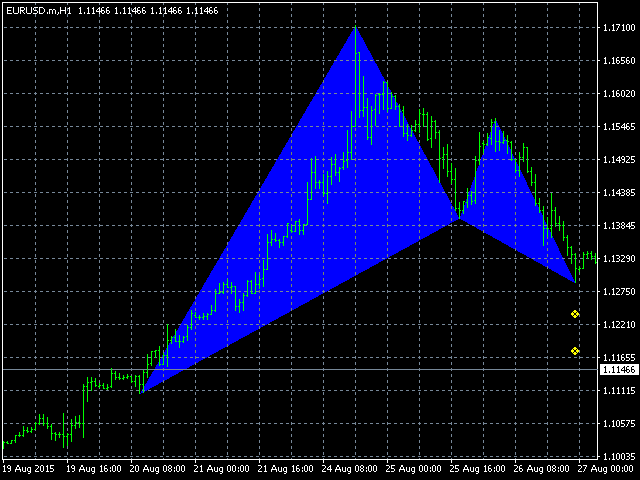
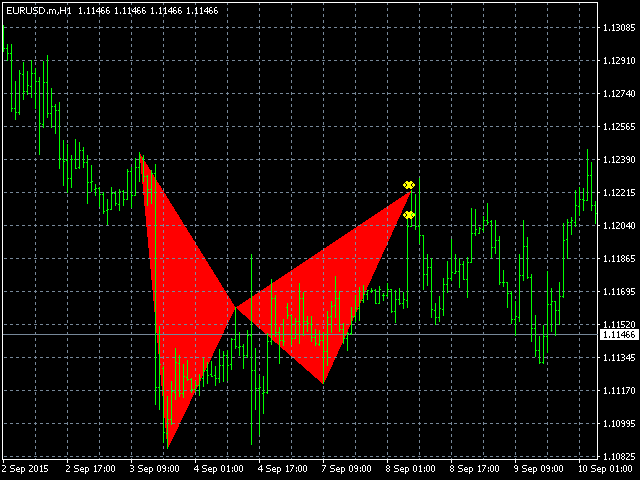
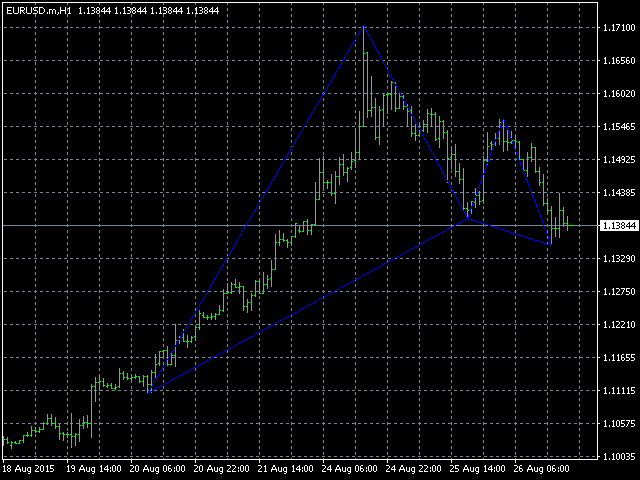
El indicador detecta y muestra М. Mariposa de Gartley. El patrón es trazado por los valores extremos del indicador ZigZag (incluido en los recursos, no es necesario instalar). Después de detectar el patrón, el indicador notifica de que por la ventana emergente, una notificación móvil y un correo electrónico. Los parámetros del patrón y de la onda se muestran en las capturas de pantalla. Los parámetros por defecto se utilizan sólo para fines de demostración con el fin de aumentar la cantidad de p
Semiautomatic EA for trading based on the averaging and locking strategy. The trader sends signals for opening grids by using the buttons on the chart. The EA opens a market order, places a grid of limit orders in the same direction with lot multiplication according to specified parameters and a locking stop order in the opposite direction with the volume equal to the sum of all the previous ones. Once the price passes the specified breakeven level, the EA places a stop loss at the open price+sp
The indicator displays the data of the Stochastic oscillator from a higher timeframe on the chart. The main and signal lines are displayed in a separate window. The stepped response is not smoothed. The indicator is useful for practicing "manual" forex trading strategies, which use the data from several screens with different timeframes of a single symbol. The indicator uses the settings that are identical to the standard ones, and a drop-down list for selecting the timeframe. Indicator Paramet
The indicator displays the data of the candles from a higher timeframe on the chart. Only the candle body (by the open and close prices) is displayed. The candlesticks are colored depending on the difference between the open and close prices. After removing the indicator from the chart, the objects used by it are deleted automatically. Indicator Parameters TimeFrame - time frame (drop-down list) BearColor - bearish candle color (standard dialog) BullColor - bullish candle color (standard dialog
The indicator displays the data of a standard MACD indicator from a higher timeframe. The product features notifications of crossing the zero or signal line by the histogram. Parameters TimeFrame - indicator timeframe (dropdown list) MacdFast - fast line period MacdSlow - slow line period MacdSignal - signal line period MacdPrice - price type (dropdown list) AlertCrossZero - enable notifications of crossing the zero line AlertCrossSignal - enable notifications of crossing the signal line UseNot
The indicator displays the moving average of a higher timeframe on the chart. The indicator parameters TimeFrame - time frame of the moving average (drop-down list) MaPeriod - moving average period MaMethod - moving average method (drop-down list) MaShift - moving average shift MaPrice - moving average price (drop-down list)
The indicator displays the data of the Average True Range (ATR) from a higher timeframe on the chart. It allows you to see the scope of the movement without having to switch to another screen terminal The indicator parameters TimeFrame - time frame of the data (drop-down list) can not be lower than current AtrPeriod - period of the Average True Range indicator a higher timeframe range
MTF ADX
Sergey Deev
5 (1)
The indicator displays the data of the standard ADX indicator from a higher timeframe on the chart. Several indicators with different timeframe settings can be placed on a single chart. The indicator parameters TimeFrame - time frame of the data (drop-down list) can not be lower than current AdxPeriod - period of the indicator for a higher timeframe AdxPrice - prices for the calculation of the indicator data from a higher timeframe
MACD Divergence
Sergey Deev
2.5 (2)
The indicator detects divergence signals - the divergences between the price peaks and the MACD oscillator values. The signals are displayed as arrows in the additional window and are maintained by the messages in a pop-up window, e-mails and push-notifications. The conditions which formed the signal are displayed by lines on the chart and in the indicator window. Indicator Parameters MacdFast - fast MACD line period MacdSlow - slow MACD line period MacdSignal - MACD signal line period MacdPric
The indicator displays the averaged value of the moving averages of the current and two higher timeframes with the same parameters on the chart. If the moving averages are located one above the other, the resulting one is painted in green, showing an uptrend, in the opposite direction - red color (downtrend), intertwined - yellow color (transitional state) The indicator parameters MaPeriod - moving average period MaMethod - moving average method (drop-down list) MaShift - moving average shift M
The indicator displays the price movement on the chart, which is smoothed by the root mean square function. The screenshot shows the moving average with period 20, the smoothed root mean square (red) and simple SMA (yellow). The indicator parameters MAPeriod - Moving average period MaPrice - applied price (drop down list, similar to the standard MovingAverage average) BarsCount - number of processed bars (reduces download time when attaching to the chart and using in programs).
The indicator displays the standard price deviation from the root mean moving average line in the additional window. The screenshot displays the standard indicator (the lower one) and SqrtDev (the upper one). Parameters SqrtPeriod - root mean line and standard deviation period. SqrtPrice - applied price (drop-down list). BarsCount - amount of processed bars (reduces the download time when applying to a chart and using in programs).
The indicator detects and displays the 5-0 harmonic pattern on the chart according to the scheme provided in the screenshot. The pattern is plotted by the extreme values of the ZigZag indicator (included in the resources, does not require additional installation). After detecting the pattern, the indicator notifies of that by the pop-up window, a mobile notification and an email. The indicator highlights not only the complete figure, but also the time of its formation. During the formation the f
The indicator detects and displays the AB=CD harmonic pattern on the chart according to the scheme provided in the screenshot. The pattern is plotted by the extreme values of the ZigZag indicator (included in the resources, does not require additional installation). After detecting the pattern, the indicator notifies of that by the pop-up window, a mobile notification and an email. The indicator highlights not only the complete figure, but also the time of its formation. During the formation the
The indicator detects and displays the White Swan and Black Swan harmonic pattern on the chart according to the scheme provided in the screenshot. The pattern is plotted by the extreme values of the ZigZag indicator (included in the resources, does not require additional installation). After detecting the pattern, the indicator notifies of that by the pop-up window, a mobile notification and an email. The indicator highlights not only the complete figure, but also the time of its formation. Duri
The indicator detects and displays Shark harmonic pattern (see the screenshot). The pattern is plotted by the extreme values of the ZigZag indicator (included in the resources, no need to install). After detecting the pattern, the indicator notifies of that by a pop-up window, a mobile notification and an email. The indicator highlights the process of the pattern formation and not just the complete pattern. In the former case, it is displayed in the contour triangles. After the pattern is comple
The indicator detects and displays 3 Drives harmonic pattern (see the screenshot). The pattern is plotted by the extreme values of the ZigZag indicator (included in the resources, no need to install). After detecting the pattern, the indicator notifies of that by a pop-up window, a mobile notification and an email. The indicator highlights the process of the pattern formation and not just the complete pattern. In the former case, it is displayed in the contour triangles. After the pattern is com
The indicator detects and displays Cypher harmonic pattern also known as Anti-Butterfly (see the screenshot). The pattern is plotted by the extreme values of the ZigZag indicator (included in the resources, no need to install). After detecting the pattern, the indicator notifies of that by a pop-up window, a mobile notification and an email. The indicator highlights the process of the pattern formation and not just the complete pattern. In the former case, it is displayed in the contour triangle
The indicator displays ZigZag lines from a higher timeframe (see the example in the screenshot). The red thin line is the current timeframe's ZigZag, while a thicker yellow line is the higher timeframe's one. The indicator is repainted as the data is updated. Parameters Depth, Dev, Back - ZigZag parameters; BarsCount - amount of processed bars (reduces the initial download time and decreases the load when using in an EA); TimeFrame - indicator timeframe (cannot be lower than the current one).
RenkoMaSignals
Sergey Deev
1 (1)
The indicator displays Renko bars on the chart, plots two moving averages by them and generates buy/sell signals based on the conditions displayed in the screenshots and described below: the buy signal is formed if the fast moving average is above the slow moving average, from 4 to 10 consecutive bullish Renko bars are displayed, followed by no more than 2 bearish and one bullish Renko bars; the sell signal is formed if the fast moving average is below the slow moving average, from 4 to 10 conse
The indicator displays renko bars on a chart, use them to plot MACD histogram and provides buy/sell signals: signal of MACD histogram crossing its signal line; signal of MACD histogram crossing the line 0. Renko is a non-trivial price display method. Instead of displaying each bar within a time interval, only the bars where the price moved a certain number of points are shown. Renko bars do not depend on a time interval, therefore the indicator works on any timeframe without losing its efficienc
RenkoMaStoch
Sergey Deev
1 (1)
The indicator displays renko bars on a chart, uses them to plot the fast and slow moving average and Stochastic, as well as it provides buy/sell signals: a buy signal is generated when the fast moving is above the slow one, and the signal line of Stochastic crosses the lower level from bottom up; a sell signal is generated when the fast moving is below the slow one, and the signal line of Stochastic crosses the upper level from top to bottom; Renko is a non-trivial price display method. Instead
The indicator displays Renko bars on the chart and uses them to plot the ZigZag - trend lines connecting the local Lows and Highs of the price movement. Renko - specialized display of the price action, in which the graph is displayed not every bar of the time frame, but only under the condition that the price had passed more than the specified number of points. Renko bars are not bound to a time frame, so the indicator can work on any time frame with the same efficiency. This implementation of t
The indicator displays Renko bars on the chart, uses them to plot the ZigZag - trend lines connecting the local Lows and Highs of the price movement, and highlights them based on the Gartley patterns, showing the potential price reversal points. Renko - specialized display of the price action, in which the graph is displayed not every bar of the time frame, but only under the condition that the price had passed more than the specified number of points. Renko bars are not bound to a time frame, s
The indicator displays renko bars on a chart, uses them to plot the MACD oscillator and determines the divergence conditions (divergences of price movements and oscillator values). The buy/sell signal is formed if the next High/Low price is not confirmed by the oscillator values. The ZigZag indicator is used to evaluate the extremums. Only the last 3 peaks are taken into account (see the screenshot). If peak 1 is higher than peak 2 or peak 3, and at the same time the macd value is lower, then a
The indicator displays renko bars on a chart and uses them to create ZigZag indicator - trend lines connecting local price movement Highs and Lows. The indicator, in turn, is used to create AB=CD displaying potential price reversal points. Renko is a non-trivial price display method. Instead of displaying each bar within a time interval, only the bars where the price moved a certain number of points are shown. Renko bars do not depend on a time interval, therefore the indicator works on any time
The indicator calculates and displays renko bars using MA and PSAR data as well as provides buy/sell signals. Renko is a non-trivial price display method. Instead of displaying each bar within a time interval, only the bars where the price moved a certain number of points are shown. Renko bars do not depend on a time interval, therefore the indicator works on any timeframe without losing its efficiency. Buy signal forms when PSAR readings are moving down, MA is moving up, the price is closing ab
The indicator displays Renko bars on the chart, uses their data to calculate and display the moving average, PriceChannel and generates buy/sell signals. Renko is a non-trivial price display method. Instead of displaying each bar within a time interval, only the bars where the price moved a certain number of points are shown. Renko bars do not depend on a time interval, therefore the indicator works on any timeframe without losing its efficiency. The PriceChannel indicator displays the upper, lo
Filtro:
Lorentzos Roussos
45184
Lorentzos Roussos 2023.09.25 16:34 
 

El usuario no ha dejado ningún comentario para su valoración

Aravind Kolanupaka
9245
Aravind Kolanupaka 2019.11.11 02:23 
 

El usuario no ha dejado ningún comentario para su valoración

Thomas Fairhurst
1186
Thomas Fairhurst 2019.06.01 08:21 
 

El usuario no ha dejado ningún comentario para su valoración

Ngoc Nguyen
534
Ngoc Nguyen 2019.03.31 00:33 
 

El usuario no ha dejado ningún comentario para su valoración

Shaheen Hassanali
6742
Shaheen Hassanali 2018.12.02 15:35 
 

El usuario no ha dejado ningún comentario para su valoración

sunnychow
9050
sunnychow 2018.11.05 18:23 
 

El usuario no ha dejado ningún comentario para su valoración

Corneliu Raileanu
222
Corneliu Raileanu 2018.09.01 20:29 
 

El usuario no ha dejado ningún comentario para su valoración

Matthew Todorovski
13129
Matthew Todorovski 2018.06.30 13:24 
 

El usuario no ha dejado ningún comentario para su valoración

Mauro Giuseppe Tondo
2009
Mauro Giuseppe Tondo 2018.06.05 22:59 
 

El usuario no ha dejado ningún comentario para su valoración

Tim Eubanks
5763
Tim Eubanks 2018.03.13 04:12 
 

El usuario no ha dejado ningún comentario para su valoración

Mohammed Abdulwadud Soubra
38225
Mohammed Abdulwadud Soubra 2017.09.27 00:33 
 

El usuario no ha dejado ningún comentario para su valoración

Gennadiy Voltornist
11909
Gennadiy Voltornist 2017.04.12 19:58 
 

El usuario no ha dejado ningún comentario para su valoración

[Eliminado] 2017.03.06 23:45 
 

El usuario no ha dejado ningún comentario para su valoración

redneedle
491
redneedle 2016.09.06 19:15 
 

El usuario no ha dejado ningún comentario para su valoración

Maksym Mudrakov
30048
Maksym Mudrakov 2016.08.29 11:51 
 

El usuario no ha dejado ningún comentario para su valoración

chriss100
30
chriss100 2016.06.04 11:58 
 

El usuario no ha dejado ningún comentario para su valoración

vahid jannati
2040
vahid jannati 2016.03.03 19:15 
 

El usuario no ha dejado ningún comentario para su valoración

Respuesta al comentario
Versión 2.6 2019.08.24
Small edition
Versión 2.5 2019.08.23
Add EventChartCustom
Versión 2.4 2019.06.14
нет лого fx-prog.ru
Versión 2.3 2016.04.27
Added the 'TimeFrame' parameter - now the chart displays the patterns not only of the current, but also from the higher timeframe.
Versión 2.2 2016.04.12
- Buy and sell signals allocated among the indicator buffers
- Added ShowPredict parameter to hide a forming pattern
Versión 2.1 2016.03.24
New input patterPreset - choosing standard proportions for the shapes: Gartley, Crab, Bat, Butterfy. Manual configuration works if patterPreset = MANUAL.
New input MessageAdd - the text to be added to alerts.
Versión 2.0 2016.03.10
- Added display of the pattern at the stage of its formation. Displayed by triangle outlines.
- Added display of potential reversal area at the formed pattern.
- Added parameter 'prefix' for the correct display of several instances of the indicator on one chart. Enter different strings for different charts.
Versión 1.1 2016.02.19
Fixed text messages. Disabled display of excessive debugging data.