M W Pattern Pro
- Indicadores
- Versión: 1.6
- Actualizado: 1 julio 2023
- Activaciones: 10

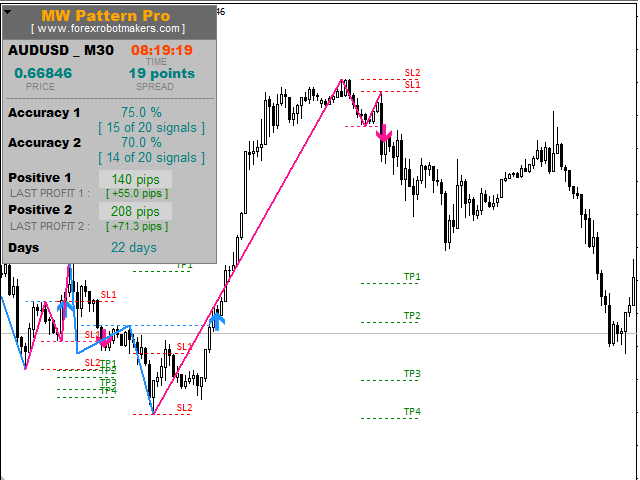
M & W Pattern Pro es un escáner avanzado de patrones M y W , utiliza filtros adicionales para asegurar que los patrones escaneados son rentables.
El indicador se puede utilizar con todos los símbolos y marcos de tiempo.
El indicador es un indicador sin repintado con cálculos estadísticos precisos.
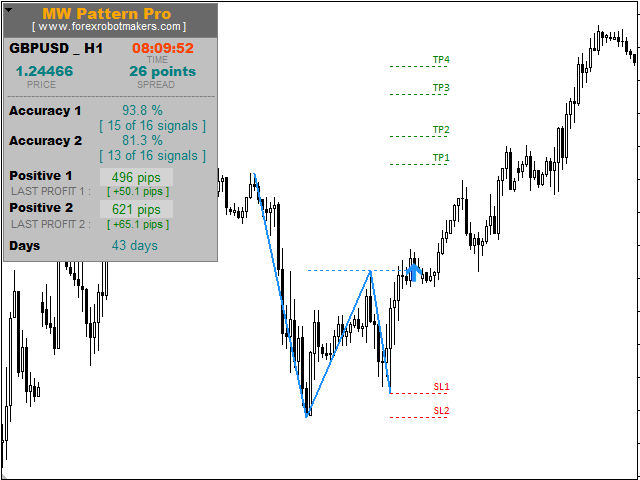
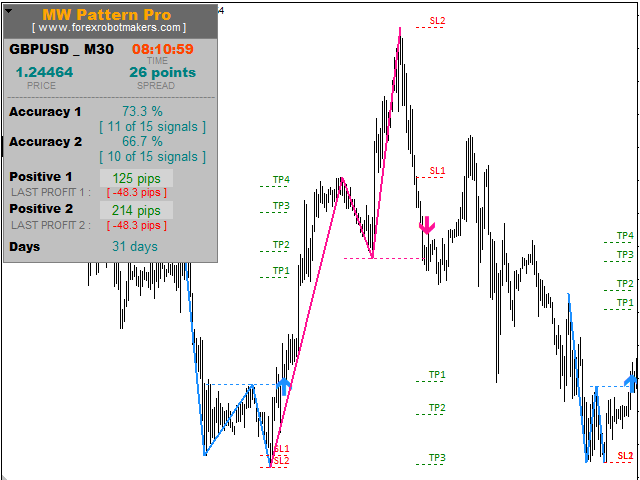
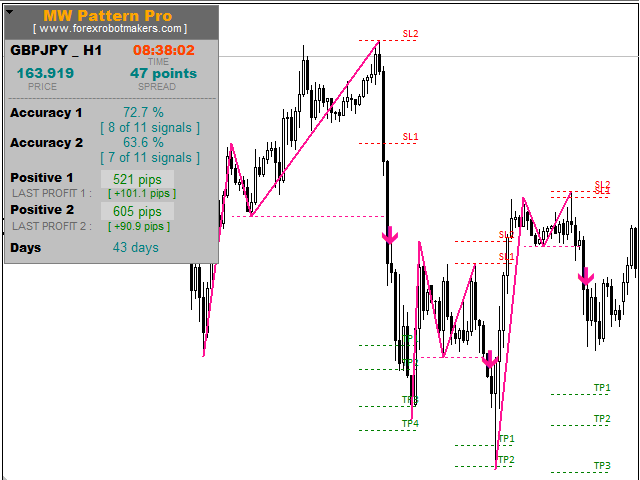
Para utilizarlo , simplemente escanee el par más rentable utilizando la precisión del tablero de estadísticas , a continuación, introduzca las operaciones en la flecha de señal y salga en los niveles TP y SL.
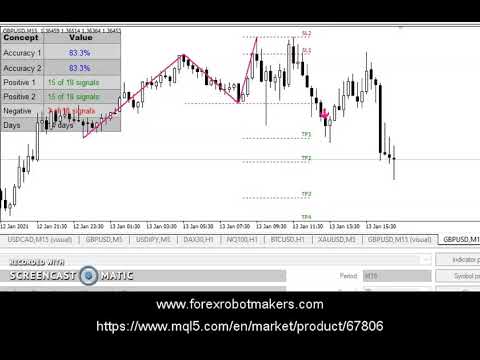
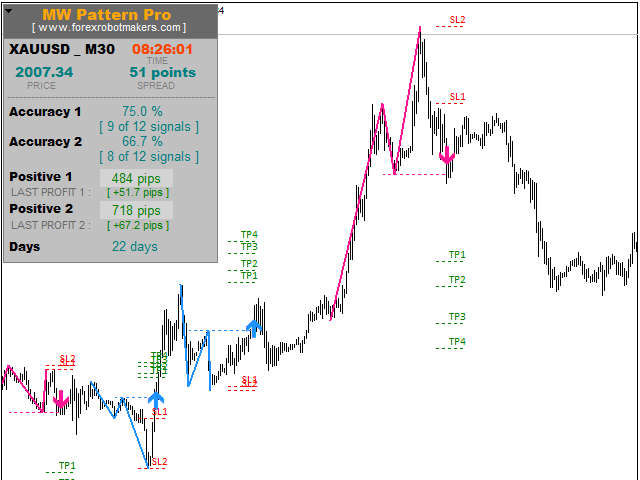
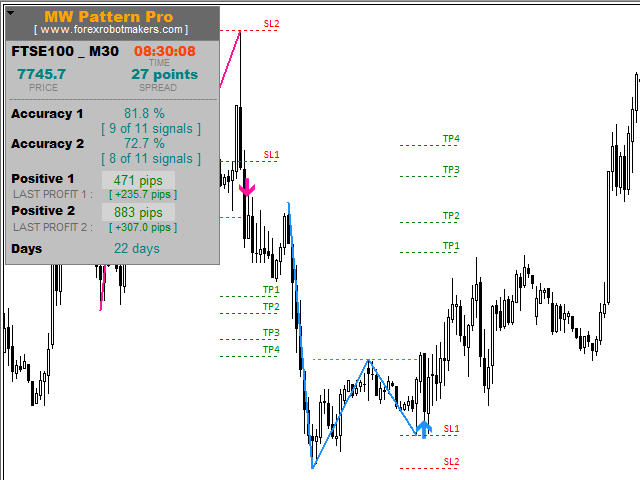
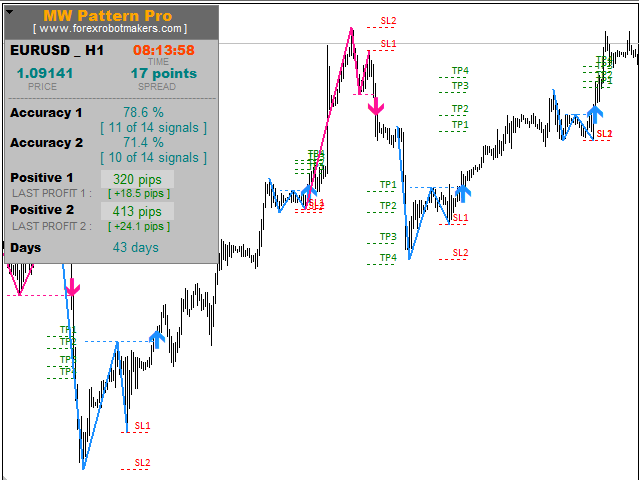
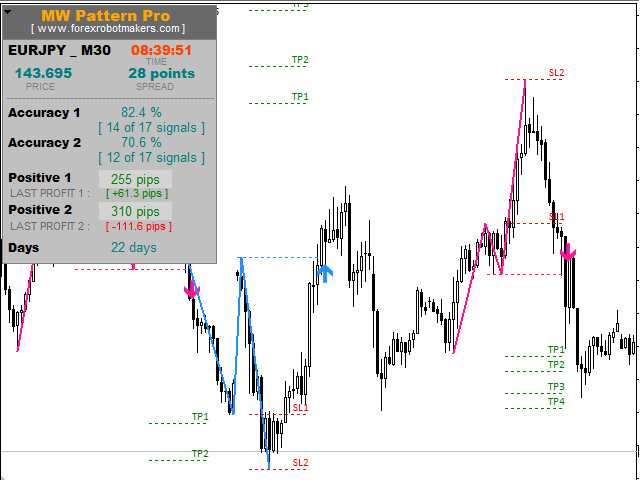
ESTADÍSTICAS :
Precisión 1 : Es el porcentaje de veces que el precio alcanza el TP1 antes de alcanzar el stop loss.
Precisión 1= (Total de aciertos TP1 / Total de señales )*100
Precisión 2 : Es el porcentaje de veces que el precio alcanza el TP2 antes de llegar al stop loss.
Precisión 2= (Acierto total en TP2 /Total de señales )*100
Positivo 1 : Es el porcentaje de veces que el precio alcanza TP1.
Positivo 2 : Este es el porcentaje de veces que el precio alcanza TP2.
Negativo : Es el porcentaje de veces que el precio alcanza el stop loss (SL 2) .
Días : El número de días escaneados en los datos históricos.
SL 1 vs. SL 2
SL 1 : Sl1 1 es el primer stop loss y está pensado para salir de las operaciones después de haber obtenido un beneficio parcial. Cuando cierra una operación parcialmente en TP1 o TP2 , entonces coloque el stop loss en SL 1 para reducir el riesgo.
SL2 : SL2 es el stop loss final para todas las operaciones y debe servir como factor de riesgo en cada operación.
AJUSTES DEL MENÚ DE ENTRADA
- Historial de Patrones : Este es el rango de barras históricas escaneadas. Este número afecta a la velocidad de carga del indicador, cuanto mayor sea el número, más lenta será la carga del indicador.
- Amplitud del Patrón : Este es básicamente el ajuste más importante para este indicador. Afecta tanto a la precisión como al número de señales diarias. Para una señal más filtrada con menos ruido, este número debe aumentarse. Pero si usted quiere ver más señales, entonces el número debe ser reducido, pero más las señales , más el ruido.
AHORA PUEDE DESCARGAR VERSIONES GRATUITAS DE NUESTROS INDICADORES DE PAGO . ES NUESTRA FORMA DE RETRIBUIR A LA COMUNIDAD.


This is an absolutely fantastic indicator – one of the best I have ever seen. The freezing problem has definitely been fixed. The winning percentages are very good on certain pairs. I recommend only using it on the majors. I am currently chatting with the creator to see if this can be the basis of an EA. Sometimes, by the time you enter the trade, much of the move as already happened. Auto entry with an EA will fix that problem. Also, to make the percentages work in your favor, you need to be available to enter every trade. An EA will make that possible.