MTF Stochastic
- Indicadores
-
Sergey Deev
 I'm implementing your ideas in MQL4: https://www.mql5.com/ru/job/new?prefered=work2it
 - Versión: 1.11
- Actualizado: 18 noviembre 2021
- Activaciones: 15
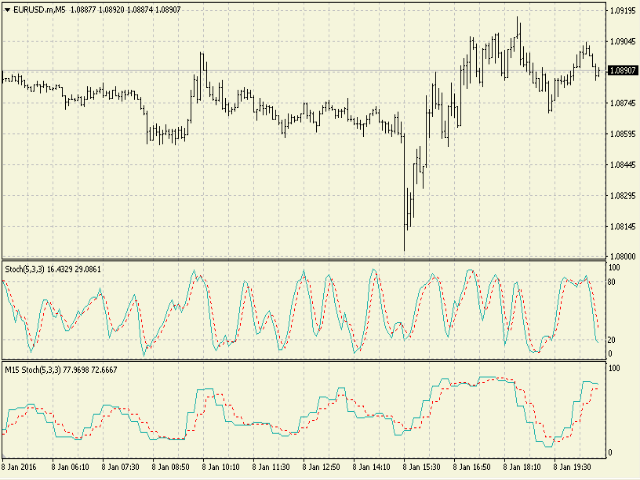
El indicador muestra los datos del oscilador estocástico de un marco temporal superior en el gráfico. Las líneas principal y de señal se muestran en una ventana separada. La respuesta escalonada no se suaviza. El indicador es útil para practicar estrategias "manuales" de comercio de divisas, que utilizan los datos de varias pantallas con diferentes marcos temporales de un solo símbolo. El indicador utiliza una configuración idéntica a la estándar y una lista desplegable para seleccionar el marco temporal.
Parámetros del indicador
- TimeFrame - marco temporal (lista desplegable);
- KPeriod - periodo %K;
- DPeriod - periodo %D;
- Slowing - desaceleración;
- MAMethod - método de media móvil (lista desplegable);
- PriceField - tipo de precio (lista desplegable);
- StochLevel - nivel, por encima del cual se indica la intersección de la línea descendente. El nivel inferior se calcula según la fórmula 100-StochLevel.
- UseAlerts - mostrar alertas en las intersecciones de líneas.


El usuario no ha dejado ningún comentario para su valoración