SFT Trend Chart
- Indikatoren
-
Artem Kuzmin
 ALL PRODUCTS ▶️ https://www.mql5.com/ru/users/zombiezorrofx/seller
🔥 Maximum commission discounts:
💠 Binance 35% (trading bypassing sanctions) - Version: 1.0
- Aktivierungen: 5
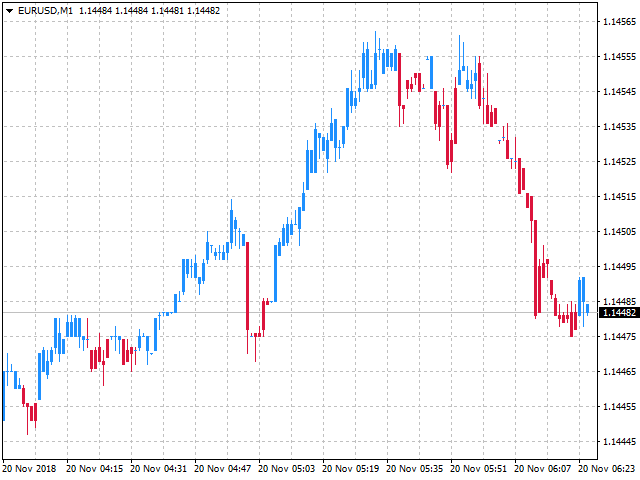
Die Eröffnung von Positionen in Trendrichtung ist eine der gängigsten Handelstaktiken.
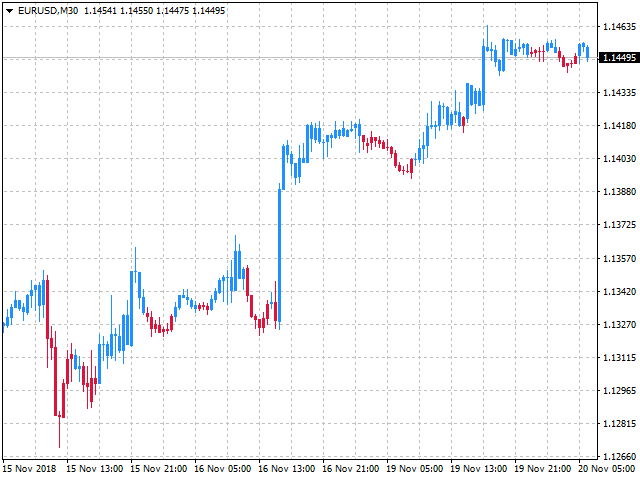
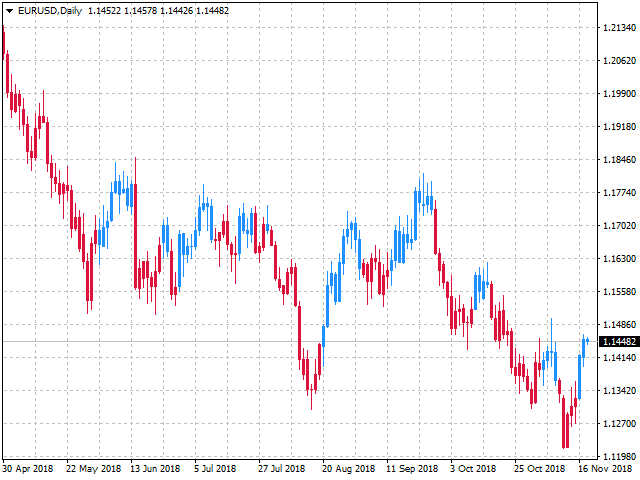
Dieser Indikator bestimmt die Richtung der lokalen Bewegung und färbt die Kerzen auf dem Diagramm in der entsprechenden Farbe.
Ermöglicht Ihnen den Einstieg in die Transaktion gleich zu Beginn der Bewegung
Dank der flexiblen Einstellungen können Sie ihn für alle Währungspaare, Metalle und Kryptowährungen verwenden
Kann bei der Arbeit mit binären Optionen verwendet werden
Unverwechselbare Merkmale
- Wird nicht neu gezeichnet.
- Zusätzliche Parameter für die Feinabstimmung.
- Funktioniert auf allen Zeitrahmen und Symbolen.
- Geeignet für den Handel mit Währungen, Metallen, Optionen und Kryptowährungen (Bitcoin, Litecoin, Ethereum, etc.)
- Geeignet für den manuellen Handel und die Entwicklung von Expert Advisors.
Für genauere Eingaben und zusätzliche Bestätigung von Signalen kann er in Verbindung mit anderen Indikatoren verwendet werden.
Einrichten des Indikators
- Deep Bars - Zeitraum des Indikators;
- Sensitivität - Empfindlichkeit des Indikators, je kleiner die Zahl, desto empfindlicher;
- Preis - Preise, auf denen der Indikator basiert;
- MA1-Modus - die Methode zur Berechnung des ersten gleitenden Durchschnitts, der in den Berechnungen verwendet wird;
- MA2 Modus - die Berechnungsmethode des zweiten gleitenden Durchschnitts, der in den Berechnungen verwendet wird;
- MA3 Mode - die Methode zur Berechnung des dritten gleitenden Durchschnitts, der in den Berechnungen verwendet wird;
Handelsempfehlungen
- Wenn eine rote Kerze erscheint, öffnen Sie Sell oder Put (für Optionen)
- Wenn eine blaue Kerze erscheint, eröffnen Sie Buy oder Call (für Optionen)
- Die Handelsrichtung sollte der Richtung des Trends auf einem höheren Zeitrahmen entsprechen.
- Beenden Sie den Handel bei einem Umkehrsignal oder bei den festgelegten SL- und TP-Niveaus.
- Wenn Sie SL und TP verwenden, setzen Sie SL über das nächste Extremum hinaus, TP = 1..2 SL.
- Bewährt in Zusammenarbeit mit dem Indikator SFT Local Trend Signal
Auch andere Handelsoptionen sind möglich, Sie können die für Sie günstigste Taktik im Laufe des Handels entwickeln.
Weitere Informationen und eine genauere Übersicht über die Handelsmethoden finden Sie hier:
Handelsstrategien mit dem Indikator SFT Trend Chart
Wir wünschen Ihnen einen stabilen und profitablen Handel.
Vielen Dank, dass Sie unsere Software nutzen.
Wenn es Ihnen gefällt, teilen Sie einen Link mit Ihren Freunden.
Um die Veröffentlichung neuer nützlicher Handelsprogramme nicht zu verpassen, fügen SieSURE FOREX TRADING zu Ihrer Freundesliste hinzu
Der Benutzer hat keinen Kommentar hinterlassen