Ace Supply Demand Zone MT4
- Indicadores
-
Young Ho Seo
 Harmonic Pattern Indicator - Repainting + Japanese Candlestick Pattern Scanner + Automatic Channel + Many more
https://www.mql5.com/en/market/product/4488 - Versión: 5.2
- Actualizado: 10 febrero 2022
- Activaciones: 5
Indicador Ace de la zona de oferta y demanda
El concepto de oferta y demanda se basa en el desajuste cuantitativo entre los volúmenes de compra y venta en el mercado financiero. La zona de oferta y demanda puede proporcionar una buena entrada y salida. Una zona es más fácil de operar que una línea. La zona de oferta y demanda puede proporcionar el plan de negociación detallado y la gestión de riesgos. Su capacidad para predecir la dirección del mercado es alta. Hay dos puntos distintivos sobre Ace Supply Demand Zone Indicator. El indicador Ace Supply Demand Zone se basa en el principio de no repintado y no retraso. Si puede elegir, elija siempre un sistema sin repintado ni retraso.
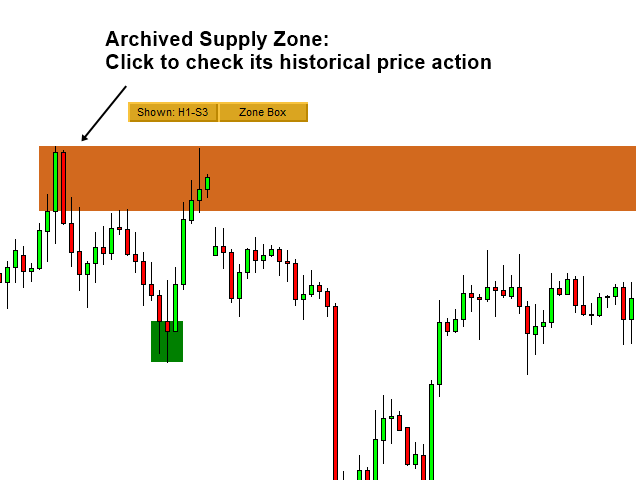
Ya que este es un indicador de zona de oferta y demanda sin repintado, usted puede usar la zona histórica de oferta y demanda como el soporte y resistencia horizontal. Por ejemplo, en algún momento, cualquier zona de oferta y demanda será penetrada. Una vez que son penetradas, el indicador automáticamente alcanza estas zonas de oferta y demanda. La zona histórica se mostrará con un recuadro corto en lugar del recuadro extendido en su gráfico. Siempre puede extender la caja de nuevo haciendo clic en ellos si lo desea. Incluso después de terminar su vida útil, pueden servirle para dibujar la gran zona de ruptura o reversión en su gráfico. Con la zona histórica de oferta y demanda, puede utilizarlas para mejorar el rendimiento de las operaciones además de la estrategia original de zona de oferta y demanda. Usted puede considerarlo como el soporte horizontal automático y el indicador de resistencia en este extremo. Por lo tanto, el indicador Ace Supply and Demand es muy valioso en comparación con cualquier otro indicador de oferta y demanda en Internet.
Características principales
-
Escaneo de múltiples marcos temporales para la importante zona de oferta y demanda
-
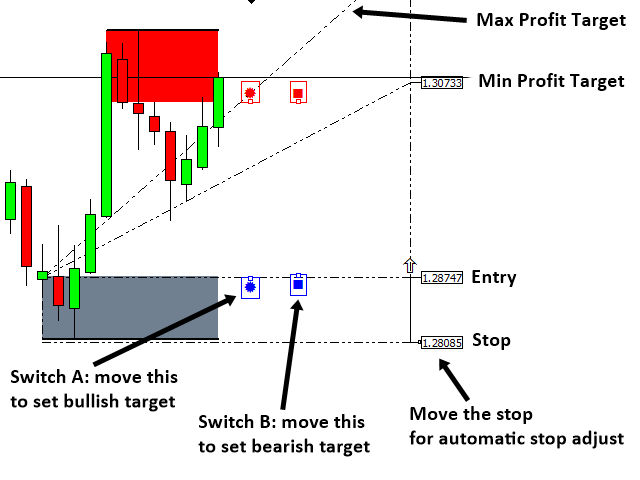
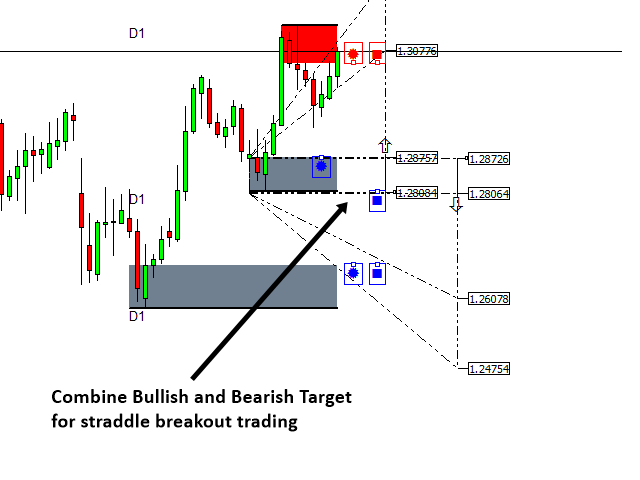
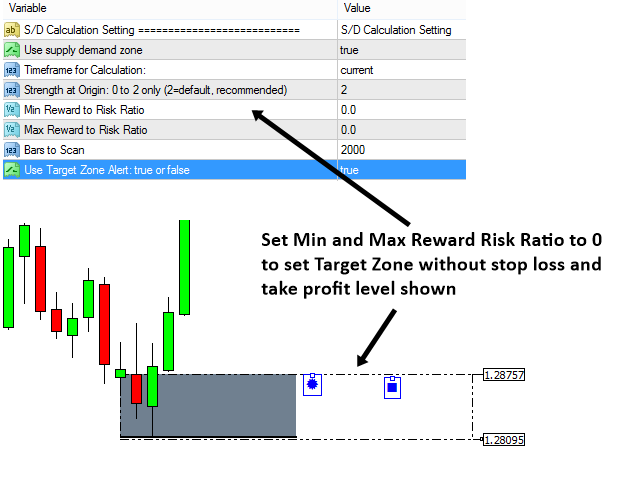
Detección automática de objetivos de beneficios y stop loss para cualquier zona de oferta y demanda
-
Análisis diario, semanal y mensual del perfil del mercado para evaluar las características de reversión a la media del mercado (se incluye el cálculo del área de valor y del punto de control).
-
Análisis de pivote diario, semanal y mensual para mejorar el análisis de reversión a la media.
-
Capacidad para realizar análisis de múltiples marcos temporales en el mismo gráfico (se recomienda no utilizar más de dos zonas por gráfico)
-
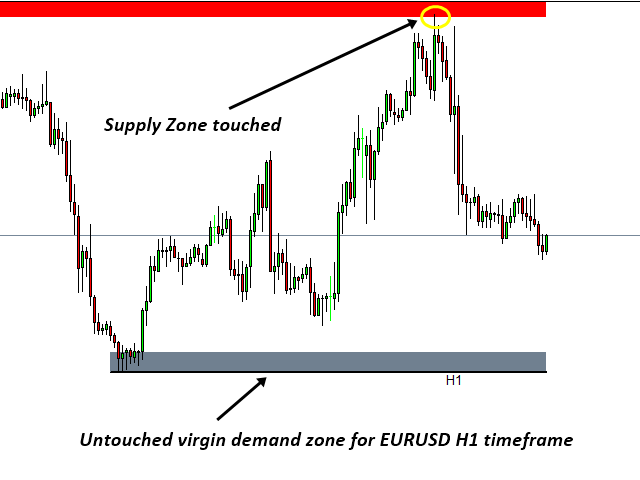
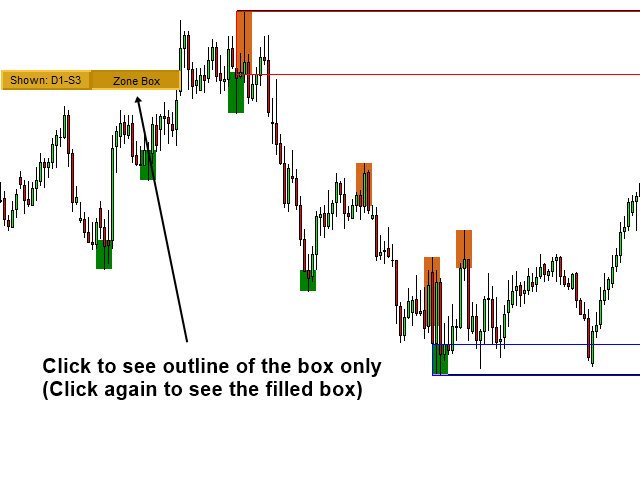
Detección automática de retoques en cada zona de oferta y demanda. (Fácil de identificar qué zona es virgen y cuáles no).
-
Sonido, Email, notificación Push es posible cuando cualquier zona de oferta y demanda es tocada o detectada.
Dirección de Trading
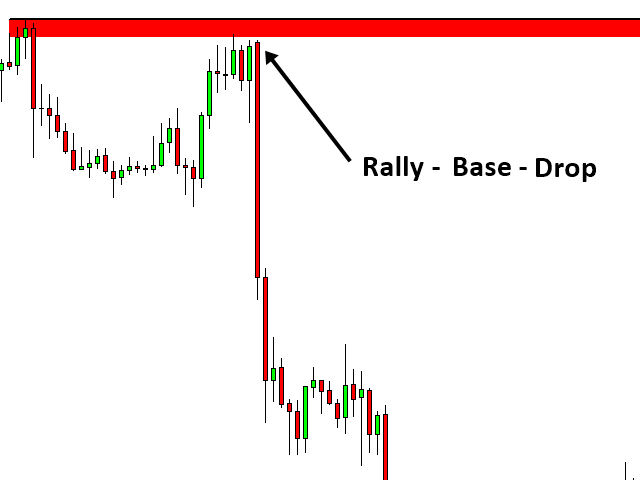
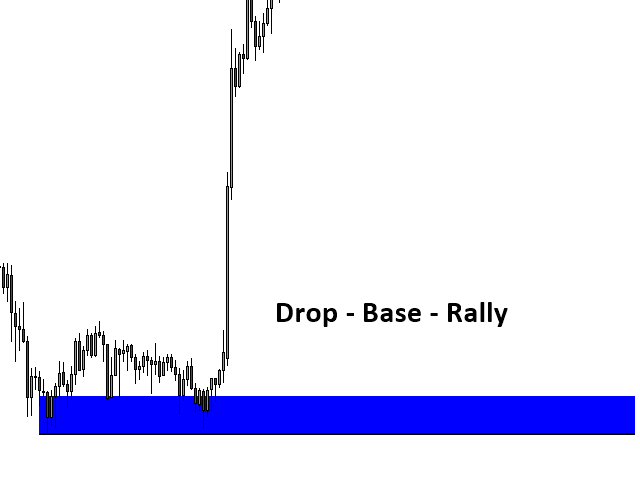
Puede realizar las típicas operaciones de zona de oferta y demanda. Por ejemplo, puede utilizar la Zona de Oferta y Demanda para predecir la dirección del mercado (patrón de Rally Base de Caída, patrón de Caída Base de Rally, patrón de Rally Base de Caída). En segundo lugar, también puede utilizar la zona de oferta y demanda como soporte y resistencia horizontales. Además, puede utilizar el Perfil de Mercado como una herramienta adicional para la toma de decisiones.
Acerca de Market Profile
Este indicador ofrece un Perfil de Mercado diario, semanal y mensual para medir las probabilidades de reversión a la media del mercado. Para construir el perfil de mercado, se debe elegir cuidadosamente el marco temporal del gráfico para el cálculo adecuado del Perfil de Mercado. Normalmente es importante reconocer el movimiento del precio fuera del área del valor.
-
Perfil de Mercado Diario: Pueden utilizarse los marcos temporales M5 a H1. Se recomienda M30.
-
Perfil de Mercado Semanal: Se pueden utilizar los marcos temporales M30 a H4. Se recomienda H1.
-
Perfil de mercado mensual: Pueden utilizarse los marcos temporales H1 a D1. Se recomienda H4.
Guía de estrategias de negociación
Una buena guía de estrategia para operar con la oferta y la demanda se puede encontrar en Análisis Técnico en Forex y Bolsa (Análisis de la Oferta y la Demanda y Soporte y Resistencia, 2021). Además, también puede utilizar el libro: Science Of Support, Resistance, Fibonacci Analysis, Harmonic Pattern, Elliott Wave and X3 Chart Pattern (In Forex and Stock Market Trading, 2021 ) para encontrar la explicación del soporte y la resistencia, así como otros análisis técnicos avanzados. Por favor, visite el siguiente enlace para obtener más detalles acerca de la guía de estrategia de negociación con la oferta y la demanda de la zona de comercio.
Guía de la zona de oferta y demanda: https: //www.mql5.com/en/blogs/post/750386
Nota Importante
Este es un producto listo para usar. Por lo tanto, no aceptamos ninguna solicitud de modificación o personalización de este producto. Además, no proporcionamos ninguna biblioteca de código o cualquier apoyo para su codificación para este producto.


The cleanliness and clarity that this indicator provides is greatly appreciated, unlike others that fill your screen without offering any solutions.... The best supply and demand indicator... 5 stars