YouTube'dan Mağaza ile ilgili eğitici videoları izleyin
Bir alım-satım robotu veya gösterge nasıl satın alınır?
Uzman Danışmanınızı
sanal sunucuda çalıştırın
sanal sunucuda çalıştırın
Satın almadan önce göstergeyi/alım-satım robotunu test edin
Mağazada kazanç sağlamak ister misiniz?
Satış için bir ürün nasıl sunulur?
MetaTrader 4 için teknik göstergeler - 20

Rtc ML Ai | Predictor CORE MACHINE LEARNING ENGINE
Adaptive ML Market Predictor – Multi-Bar Trend & Candle Forecast What This Indicator Does This indicator is a real-time market prediction engine designed to analyze price behavior and estimate future market tendencies . Unlike conventional indicators, this system does not rely on static parameters or historical curve-fitting , but adapts its internal state dynamically during live market operation. Instead of using static rules, the indic
SignalAlert göstergesi, bir başka göstergeden gelen alım ve satım sinyallerini izlemek için kullanılan bir araçtır ve bu sinyaller tetiklendiğinde sesli uyarılar gönderir. Bu özellik, özellikle Binary Sixty Scalping gibi göstergelerle hızlı tepki verebilmek için faydalıdır. Gösterge Ayarları: IndicatorName : Bu parametre, SignalAlert'ın sinyalleri hangi göstergeden alacağını belirtir. Örneğin, « Binary Sixty Scalping » gibi göstergenin tam adını girerek SignalAlert'ın bu göstergenin sinyallerin
FREE

The "Trend Edges" indicator determines whether the trend is rising or falling. It is suitable for any time frame (tested on DAX).
The indicator should be treated like Bollinger Bands, meaning that if it breaks out upwards, you can buy with a stop loss below the lower edge.
Find a trending pair, index or CFD. Additionally :
-Sound alert on trend change.
-Alert Notification
-Alert Notification on your mobile phone Check my other indicator "Trend Edges histogram"
FREE

Sometimes a trader needs to know when a candle will close and a new one appears to make the right decisions, this indicator calculates and displays the remaining of current candle time . It is simple to use, just drag it on the chart. Please use and express your opinion, expressing your opinions will promote the products. To see other free products, please visit my page.
FREE
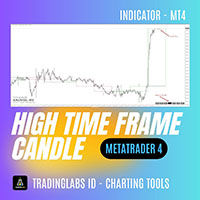
HTF Candle Plus Timer Upgrade your trading experience with HTF Candle Plus Timer, a smart indicator that displays higher timeframe candles directly on your current chart. It allows you to stay aligned with the bigger market picture while focusing on your preferred trading timeframe. Key Features: Higher Timeframe Candles
Plot custom higher timeframe (HTF) candles such as H1, H4, D1, W1, or MN directly on lower timeframe charts for a clearer market overview. Current Candle Timer
A live countdown

BuySell Volume is an indicator that approximates Buy and Sell volumes based on price movement. Input Description: applied_model: Choose the applied model. In low reversal mode, price is considered receive low bearish pressure during bullish candle's creation (high bearish pressure on high reversal model. In other words, Bullish Marubozu candles has really high Buy Volumes in low reversal model than in high reversal one.
Output Description: Buy and Sell Volume: Determines how many Buy and Sell vo
FREE

FREE TopClock Indicator: This indicator is an Analog Clock That Shows: Local Time Of Pc or Time Of Broker Server or sessions(Sydney -Tokyo London -NewYork)Time or custom Time( with GMT -Base) this can shows Candle Time Remainer with Spread live. You can run this indicator several times for different times and move it to different places on the chart. If you would like, this indicator can be customized for brokers and their IB based on customer needs. For more information contact us if you
FREE

Flat Reminder Overview Flat Reminder is a powerful technical analysis tool that identifies and highlights price consolidation zones on your chart. It detects when price action slows down and moves sideways, indicating potential reversal points, continuation setups, or key decision zones in the market. Key Features Consolidation Detection : Automatically identifies flat price zones where market momentum decreases Range Measurement : Calculates and displays the exact range of each consolidation in
FREE

Ürün Başlığı Smart RSI (MT4) – SmartView serisinin bir parçası Kısa Açıklama MetaTrader platformunda benzersiz bir kullanıcı deneyimi sunan RSI göstergesi. Daha önce mevcut olmayan gelişmiş özellikler sunar, çift tıklama ile ayarları açma, silmeden göstergeleri gizleme/gösterme ve gösterge penceresini tam grafik boyutunda görüntüleme gibi. SmartView Indicators serisinin geri kalanı ile sorunsuz çalışacak şekilde tasarlanmıştır. Genel Bakış SmartView serisi, yenilikçi özellikler aracılığıyla Meta
FREE
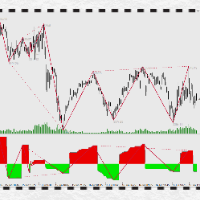
万能背驰指标简介(DivergenceLines) 注意注意,这个指标不能单独运作,对以下两个指标有依赖,请确保先获得以下两个指标后才购买本指标! 1) 动力之梯(PowerTrapezoid) (力度评估副图指标,本指标) 2) 万能分段(LinesSegment) (线段划分主图指标) 。 3)万能背驰(DivergenceLines,本指标) (比较力度背离主图指标)。 指标原理: 通过获取动力之梯指标的筹码堆积值,依照万能分段指标为依据,对同向线段向前回朔,进行一一对比,当后面线段力度比前面力度小时,定义为背驰(背离),背驰的两个高点(或两个低点)之间可以连接一条背驰线,当某个高点(或低点)连接的背驰线越多,这个点就构成了多个单级别背驰区间套。
FREE

The product Divergence Mom Stoch Adx Bears Bulls is designed to find the differences between indicators and price. It allows you to open orders or set trends using these differences. The indicator has 4 different divergence features.
Divergence types Class A Divergence Class B Divergence Class C Divergence Hidden Divergence
Product Features and Rec ommendations There are 5 indicators on the indicator Indicators = Momentum Stochastic Adx Bears Bulls 4 different divergence types are used.
FREE
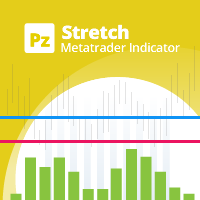
The Stretch is a Toby Crabel price pattern which represents the minimum average price movement/deviation from the open price during a period of time, and is used to calculate two breakout levels for every single trading day. It is calculated by taking the 10 period SMA of the absolute difference between the open and either the high or low, whichever difference is smaller. This value is used to calculate breakout thresholds for the current trading session, which are displayed in the indicator as
FREE

The RSI Divergence Indicator is a powerful tool designed to identify potential reversals in the market by spotting discrepancies between the Relative Strength Index (RSI) and price movement. Divergences can be a significant indication of an impending trend change, either from bullish to bearish or vice versa. This indicator is built for making the task of identifying potential trade opportunities more straightforward and efficient.
Features: Automatic Detection: The indicator scans the chart f
FREE
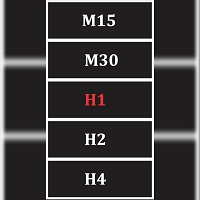
Seamlessly switch between 13 (9 mt4 default and 4 popular custom) time frame with this tool. Real ease of switching between default and custom time frames. Note indicator does not create custom time frame chart data, it only enables you to switch to and from them. Creating a custom time frame can be done using the default mt4 period converter script attached to a lesser default mt4 time frame. Example attach period converter on M1 and set period multiplier to 10 to have a custom M10 chart.
FREE

Relative Volume or RVOL is an indicator that averages the volume of X amount of days, making it easy to compare sessions volumes.
The histogram only has 3 colors:
Green - Above average volume
Yellow - Average volume
Red - Below average volume
The default setting is 20 days, which corresponds more or less to a month of trading.
With the data obtained from this indicator you can better gauge the commitment behind a move. For example, you will be better equipped to judge if a breakout of a r
FREE

SR is a support and resistance indicator, it shows major highs and lows by different colors. The color of a level is changing if the last high or low are touching it. After the closing of a bar above or below level, it will delete it. extern inputs: loop for candles / colors / drawing time *This indicator signal is not perfect and have to be used with other market analysis and confirmations.
FREE
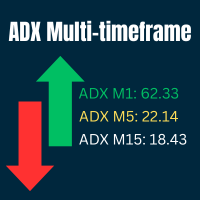
Ultimate ADX Multi-timeframe Indicator This indicator provides real-time ADX values for multiple timeframes in one unobtrusive label panel. It i s especially useful for gauging trend strength across timeframes without constantly switching charts. Choose which periods to display, anchor the panel to any chart corner, and color-code ADX strength levels to your taste. Key Features & Personalization Multi-Timeframe ADX - Toggle visibility for 9 built-in periods (M1, M5, M15, M30, H1, H4, D1, W1, MN1
FREE

Looking for entry points along the local trend without repaint! Arrows indicate entry points. Based on classic indicators. The indicator is easy to use. Settings Наименование Описание Frequency factor Signal frequency. The less, the more often.
This affects the quality.
Recommendations Recommended for use on major currency pairs. Timeframe from m5, m15, m30 Subscribe to my telegram channel, where we discuss intraday trading, ideas, indicators, etc., a link in my profile contacts.
FREE

Nermal Round Levels is an indicator of round numbers in the form of a grid drawing horizontal lines. You can use it in many ways ... as it could be activating for an expert advisor to enter the market, confirmation of entry for your strategy, entrance area, mark areas of important levels, possible rebounds and others. Place it in your chart and verify as the price respects those round levels.
Inputs GridSpace linecolor lineStyle
FREE

Pattern Explorer is a reliable tool for applying all the power of the most popular Japanese Candlestick Patterns . It uses Machine Learning algorithms to confirm all the patterns. What is the most impressive thing about it? Select Take Profit and Stop Loss and click on “Backtest your strategy” button to backtest your strategy in real time and to see according to your selection: Total signals Testable signals (signals that are reliable to be tested) Profitable signals (%) Loss signals (%) Total p
FREE

Indicator overview Trend indicator usage Moving averages. Highest quality alerts that need no introduction. It is completely loyal to the original algorithm and uses other useful features.
Easy to trade Carry out all kinds of notifications It's not a new paint and it's not a back paint. Setting Indicator EMA50 in Time frame H1 for any pair currency and Gold Spot. EMA200 in Time frame H1 for any pair currency and more than EMA250 for Gold spot. Using it for maximum benefit Set up notification
FREE

False Breakout Stochastic to be used with our Elliott Wave Indicator as part of the overall strategy on trading the 5th wave.
As we cannot upload multiple files, we have listed this separately. False Breakout Stochastic is best used as a confirmation tool rather than the sole signal indicator The Elliott Wave Indicator Suite is designed around a simple but effective Swing Trading Strategy. The Indicator Suite is great for Stocks, Futures and Forex trading on multiple timeframes You can find the
FREE

FZR indicator determines fractal zigzag reversal pattern of all the time frames of the chosen symbol and shows the information in the Info label. Indicator draws the detected pattern in the chosen time frame and also you can select in the menu to draw the trend line according to FZR peaks. What it is FZR? See the first picture in the screenshots. As you can see for every peak of FZR the AO indicator must cross zero line. FZR indicator determines the trend direction.
How to use FZR for trading?
FREE

The Correlation Matrix indicator shows the actual correlation between the selected instruments. The default setting is set to 28 currency pairs, gold, and silver, but the indicator can compare any other symbols.
Interpretation of the indicator Positive correlation (correlation is above 80 %). Negative correlation (correlation is below -80 %). Weak or no correlation (correlation is between -80 and 80 %).
Main features The indicator shows the actual correlation between the selected instrumen

The indicator displays market profiles of any duration in any place on the chart. Simply create a rectangle on the chart and this rectangle will be automatically filled by the profile. Change the size of the rectangle or move it - the profile will automatically follow the changes.
Operation features
The indicator is controlled directly from the chart window using the panel of buttons and fields for entering parameters. In the lower right corner of the chart window there is a pop-up "AP" button
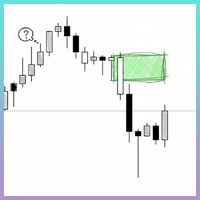
This indicator incorporates built-in volume statistics, identifying true liquidity zones based on real-time trading volume and comparing it to the volume of the last 500 candlesticks. Based on the identified results, liquidity zones are plotted on the chart, indicating potential price swings. We typically identify key liquidity zones that have not yet been breached in larger timeframes, then look for suitable entry opportunities in smaller timeframes. When the price touches a key liquidity zone

The ADX Dashboard V11.03 is a professional MT4 indicator designed to provide traders with an intuitive visual overview of trend strength and market sentiment across multiple timeframes. It integrates ADX (Average Directional Index) and RSI (Relative Strength Index) indicators, presenting key data in a concise dashboard to help traders make quick and informed trading decisions without complex analysis of individual indicator charts. First, the installation process is straightforward. Copy the co
Other profitable programs https://www.mql5.com/en/users/ifyjava/seller The FNCD indicator represents an advanced technical analysis tool that combines Fisher transformation with statistical price normalization to create a sophisticated oscillator. The foundation begins with Z-score normalization, where price data is standardized by calculating how many standard deviations the current price sits from its moving average over a specified period. This normalization process transforms raw price mov
FREE

Stochastic Candles Indicator It will convert the stochastic indicator from separate window to the chart window by drawing oversold-overbought coloring candles. Red is overbought and blue is oversold by default.And you can change the color later on the external indicator setting.This is Multi timeframe indicator that means it can show appearance result from another timeframe.E.g: If you set timeframe H1 then it will draw candles from Timeframe H1 whatever timeframe you attach on. It will be us

This indicator shows the breakeven line level for the total number of open positions of the current symbol with P/L value and total volume. This indicator is helpful to decide the exit level when using a trading grid strategy. The style of the breakeven line is customizable to choose the color, line shape and font size of the positions description. Send mobile notification when crossing a positive P/L target
FREE

"Five Minute Drives" indicator that is designed to be used in the 5 minute timeframe. One of its most important advantages is that it shows the general trend in the upper time frames when looking at the 5-minute timeframe. Therefore, when opening positions in the 5 minute timeframe, when it is in line with the trends in the upper timeframes, you are less likely to be upside down. If you can evaluate breakout/breakdown opportunities between the curves on the graphic screen with your geometric per
FREE

Time Range Separator is a useful tool to display a separator period on your platform. You could go in the properties of the indicator, select the desired range and that's ALL. We believe it is a useful and necessary that we wish to share with you for free all our followers.
Input Values: TimeFrame Period Separator GMT_Hour (ex. +1 or -1) to move the lines at Period Time +/- tot hours in input Hide_dates to show or hide the datetime on vertical lines VLine_Color = Vertical Color Line VLine_Style
FREE

Bollinger Bands Breakout Alert is a simple indicator that can notify you when the price breaks out of the Bollinger Bands. You just need to set the parameters of the Bollinger Bands and how you want to be notified.
Parameters: Indicator Name - is used for reference to know where the notifications are from Bands Period - is the period to use to calculate the Bollinger Bands Bands Shift - is the shift to use to calculate the Bollinger Bands Bands Deviation - is the deviation to use to calculate t
FREE

Smart Liquidity Levels is a valuable tool for identifying optimal liquidity levels, enabling retail traders like us to strategically set our stop-loss orders. T he essential tool for traders seeking to maximize their trading success. The liquidity level is a critical component of inner circle trading (ICT). It assists us in determining when and how we should enter the market. Watch the video for detailed instructions. Here's why understanding liquidity levels is crucial in trading and how our

Huge 70% Halloween Sale for 24 hours only!
Send us a message after your purchase to receive more information on how to get your BONUS for FREE that works in great combination with Bull vs Bear ! Bull versus Bear is an easy-to-use Forex indicator that gives traders clear and accurate signals based on clear trend retests . Forget about lagging indicators or staring at charts for hours because Bull vs Bear provides real-time entries with no lag and no repaint, so you can trade with confiden

Trading system for scalping. The indicator shows the direction of the price, the amplitude (channel) of its movement and the pivot point. The system automatically analyzes the market using the tick volume averaging algorithm for a certain period of time. After that, Scalper Thunder compares the data with other analysis indicators to identify potential pivot points. As soon as such a point is found, the indicator shows the price reversal and its current direction on the chart. The essence of trad

Indicator that will show your Balance , and your Equity . Really simple to use, no specific requirements to install it. However you can deeply configure it for your own wishes.
The pannel has 4 buttons. Only current will display the information of the chart you linked the indicator. If this is deselected, you will have the information of the whole account. Only Buys will display only the BUY orders and Only Sells will display only the SELL orders. Show Zero will display the 0 on the Y axis. I

Mahdad Candle Timer MT4 — Real‑Time Candle Countdown Mahdad Candle Timer is a lightweight and precise MetaTrader 4 indicator that displays the remaining time until the current candle closes, shown directly beside the latest bar. It is designed for traders who rely on accurate timing — whether scalping, day trading, or waiting for candle confirmation in swing setups. Key Features Accurate Countdown – Remaining time in HH:MM:SS (optional milliseconds) Dynamic Placement – Always aligned with th
FREE

TrendBite v1.5 - Profesyonel Trend Takip İndikatörü Geliştirici: 8aLt4
Versiyon: 1.5
Platform: MetaTrader 4 Genel Bakış TrendBite v1.5, piyasadaki trend değişimlerini tespit etmek ve yatırımcılara net alım-satım sinyalleri sunmak için tasarlanmış gelişmiş bir teknik analiz indikatörüdür. Bollinger Bantları algoritmasını temel alarak, trend dönüşlerini hassas bir şekilde yakalayan bu araç, hem yeni başlayanlar hem de deneyimli traderlar için idealdir. Temel Özellikler Trend Tespiti Otomatik Tr
FREE
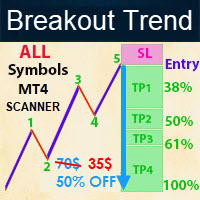
- Real price is 70$ - 50% Discount (It is 35$ now) Contact me for instruction, any questions! - Lifetime update free - Non-repaint - I just sell my products in Elif Kaya Profile, any other websites are stolen old versions, So no any new updates or support. Introduction Breakout Trend Scanner indicator works based on the Elliott Wave in technical analysis describes price movements in the financial market that are related to changes in trader sentiment and psychology and finds end of movement and

Didi Index indicator with visual buy and sell alert, with confirmation alert.
Buy or sell alerts, on screen and for mobile phones, with a visual description in colors of the direction on the screen!
A warning in the color of the current direction of the graph on the screen quickly informs you if the pair is bought or sold by Didi Index.
With configurable text position and size, making it easier to follow the trend of the pair.
FREE
BinaryPin is an indicator developed and adapted specifically for trading short-term binary options. The indicator's algorithm, before issuing the signal, analyzes many factors, such as market volatility, searches for the PinBar pattern, calculates the probability of success when making a deal. The indicator is set in the usual way. The indicator itself consists of an information window where the name of the trading instrument is displayed, the probability of making a successful transaction, the
FREE

How to use Pair Trading Station Pair Trading Station is recommended for H1 time frame and you can use it for any currency pairs. To generate buy and sell signal, follow few steps below to apply Pair Trading Station to your MetaTrader terminal. When you load Pair Trading Station on your chart, Pair Trading station will assess available historical data in your MetaTrader platforms for each currency pair. On your chart, the amount of historical data available will be displayed for each currency pai

BeST_Gann Swing Oscillator is an MT4 indicator that is based on the corresponding work of Robert Krausz who introduced it in the book “ A.W.D Gann Treasure Discovered ” .
The Gann Swing Oscillator is a range-bounding technical indicator that oscillates between +1 and -1 and thus it describes the market swings.
Generally when the market is in an upswing, the Gann Swing Oscillator describes it as 2 higher highs with the value of +1 while after an upswing, the downswing is expected.
Also the downs
Indicator Rua Alert Line. This indicator will notify when the High-price of candle breaks any TrendLine or HorizontalLine on the chart. Notifications will be sent to the phone and on MT4. And it have ArrowBuy/ArrowSell on chart. It is very useful for those of you who use the TrendLine or HorizontalLine but do not have time to observe the chart. Timeframe M1 to W1 Symbol: All
FREE
Dominate the Market with the Laguerre Edge Signal Indicator! Stop guessing and start trading with confidence! Our Laguerre Edge Indicator is your ultimate tool for spotting high-probability entry points. This indicator combines the power of two classic analysis methods— moving averages for trend direction and the Laguerre RSI for pinpointing reversals —all filtered by the solid EMA 200 trend line . It's designed to give you clear, objective signals directly on your chart. Key Features and Adva
FREE
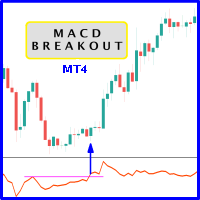
Probability emerges to record higher prices when MACD breaks out oscillator historical resistance level. It's strongly encouraged to confirm price breakout with oscillator breakout since they have comparable effects to price breaking support and resistance levels; surely, short trades will have the same perception. As advantage, many times oscillator breakout precedes price breakout as early alert to upcoming event as illustrated by 2nd & 3rd screenshot. Furthermore, divergence is confirmed
FREE
Quickly monitor your floating profit or loss as a percentage of your account balance live and always visible right on your chart! Key Features: Real-Time Calculation: Instantly calculates the combined floating profit or loss from all open trades as a percentage of your current account balance. Easy On-Chart Display: The result is conveniently shown as a label in the lower-right corner of your chart no distractions, always visible. Clear Color Coding: Green for profit, red for loss for imm
FREE

The indicator is based on the concept of price channels, which are formed by plotting the highest high and lowest low prices over a specified period of time. The Donchian Channel Indicator consists of three lines: an upper channel line, a lower channel line, and a middle channel line. The upper channel line represents the highest high over a specified period, while the lower channel line represents the lowest low. The middle channel line is the average of the two and can be used as a reference f
FREE

Indicators are for trend followers!
A trading system constructed by three moving averages. Trade with the trend and let profits run.
Strongly recommend trend indicators, automatic calculation of wave standard and MT5 version of automatic calculation of wave standard Necessary for traders: tools and indicators Waves automatically calculate indicators, channel trend trading Perfect trend-wave automatic calculation channel calculation , MT4 Perfect trend-wave automatic calculation channel
FREE
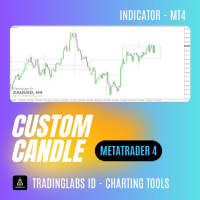
Custom Candle – Multi-Timeframe Visualization Analyzing multiple timeframes is essential for accurate trading decisions, but switching between charts can be inconvenient and inefficient. The Custom Candle indicator solves this problem by overlaying higher-timeframe (HTF) candles directly onto your lower-timeframe (LTF) chart. This allows you to see the bigger picture at a glance, align with the higher trend, and improve trade accuracy—without leaving your current chart. Key Features Multi-Timefr
FREE
It is a tool for technical analysis. It allows you to make measurements: Fibo, including the search for clusters Fibo levels (by the DiNapoli method) Overbalance Trend line Selecting S/D levels
Input parameters Trend_Color - color of the trend line Trend_Width - width of the trend line Trend_info - if true, along with the trend line additional information is displayed (low, high, medium of the trend line) Trend_info_color_up_dn - color of the text describing the trend line Trend_info_font_up_dn

This is a modified Fractals indicator. It works similar the original Bill Williams' indicator, and is additionally enhanced with the possibility to change the top radius, in contrast to the standard radius of 2 bar. Simply put, the indicator checks the top and if it is the minimum/maximum in this radius, such a top is marked by an arrow. Advantages Adjustable radius. Use for drawing support and resistance levels. Use for drawing trend channels. Use within the classical Bill Williams' strategy or
FREE

It predicts the most likely short-term price movement based on advanced mathematical calculations.
Features Estimation of immediate price movement; Calculation of the real market trend; Calculation of the most important support and resistance levels; Algorithms optimized for making complex mathematical calculations with a minimal drain of system resources; Self-adjusting for better performance, so it’s able to work properly at any symbol (no matter how exotic it is) and any timeframe; Compatibl
FREE
Unlock Unstoppable Signals : Your Edge in Trading Stop guessing and start trading with confidence! The Unstoppable Signals (BB-AO-MACD System) indicator is your all-in-one tool for catching high-probability moves in the market. We've fused the power of three proven indicators— Bollinger Bands (BB) , Awesome Oscillator (AO) , and MACD —into one simple system that gives you confirmed, non-repainting signals right on your chart. Why You Need This Indicator This isn't just another average tool; it'
FREE

It is the main indicator of Turtle Trading Strategy. It provides an excellent advantage for following the trend. It gives a signal to enter the transaction in channel breaks. A sell position is opened when the 20-period lower channel breaks, and a buy position is opened when the upper channel breaks. 2 ATR should be used as the stoploss level. The R-R ratio should be at least 1/2. You can reach the maximum profit opportunity by following the 10-period middle level. Recommended INPUT: 20 Period
FREE
T3 2Lines – Çift T3 Hareketli Ortalamayla Kesin Trend Analizi “T3 2Lines”, MT4 için geliştirilmiş bir göstergedir ve aynı anda hem kısa vadeli hem de uzun vadeli iki T3 (Üçlü Üssel Hareketli Ortalama) çizgisini grafik üzerinde gösterir. Bu iki yumuşatılmış eğrinin kombinasyonu sayesinde yatırımcılar, trendin başlangıcını, devamını ve olası dönüş noktalarını daha net bir şekilde analiz edebilir. Temel Özellikler Kısa ve uzun vadeli iki T3 çizgisinin aynı anda görüntülenmesi Her çizgi için ayrı ay
FREE

Stop Guessing, Start Sniping: Introducing SR Sniper! Tired of entry points that seem random? The SR Sniper indicator is your new essential tool for finding high-probability trades with surgical precision. It's designed to cut through the market noise, giving you clear Buy and Sell signals right at the most critical price zones. This powerful indicator combines the dynamic analysis of the Commodity Channel Index (CCI) with automatic Support and Resistance (S/R) detection —and then filters everyt
FREE

MA Crossover Arrows is a simple indicator that draws arrows and alerts when two moving averages crossover.
Supported types of moving averages Simple Exponential Smoothed Linear Weighted
Supported Price types Close Open High Low Median Price (HL/2) Typical (HLC/3) Weighted Close (HLCC/4) When the fast moving average crosses above the slow moving average, a green up arrow will appear on the chart. When the fast moving average crosses below the slow moving average, a red down arrow will appear on
FREE

Ürün Başlığı Smart Accelerator (MT4) – SmartView serisinin bir parçası Kısa Açıklama MetaTrader platformunda benzersiz bir kullanıcı deneyimi sunan Accelerator göstergesi. Daha önce mevcut olmayan gelişmiş özellikler sunar, çift tıklama ile ayarları açma, silmeden göstergeleri gizleme/gösterme ve gösterge penceresini tam grafik boyutunda görüntüleme gibi. SmartView Indicators serisinin geri kalanı ile sorunsuz çalışacak şekilde tasarlanmıştır. Genel Bakış SmartView serisi, yenilikçi özellikler a
FREE

The purpose of this new version of the MT4 standard indicator provided in your platform is to display in a sub-window multiple timeframes of the same indicator. See the example shown in the picture below. But the display isn’t like a simple MTF indicator. This is the real display of the indicator on its timeframe. Here's the options available in the FFx indicator: Select the timeframes to be displayed (M1 to Monthly) Define the width (number of bars) for each timeframe box Alert pop up/sound/ema
FREE

ADX Channel is an indicator that plots the channel depending on the values of the ADX (Average Directional Movement Index) indicator. The resulting channel is a little similar to the Envelopes, but its lines depend on the market volatility. The sell trade is usually executed fast when the price touches and bounces from the upper line of the channel, buy - from the lower. It is recommended to trade when there is no significant news. The recommended timeframes: M5 - H1. The indicator is not design
FREE

This is a unique tick chart indicator for MetaTrader 4 platform. The software is capable to graphically display the last 100 ticks and in addition to that it displays the current spread, bid / ask and time values in an elegant IceFX style dashboard. The indicator is an efficient tool for traders using M5 or even M1 timeframe.
Indicator parameters: Corner - corner of panel CornerXOffset - horizontal offset from the corner CornerYOffset - vertical offset from the corner ChartType - type of char
FREE

Advanced indicator of a professional trader - is a professional indicator based on the popular Stochastic Oscillator. Advanced indicator of a professional trader is an oscillator with dynamic overbought and oversold levels, while in the standard Stochastic Oscillator, these levels are static and do not change. This allows Advanced indicator of a professional trader to adapt to the ever-changing market. When a buy or a sell signal appears, an arrow is drawn on the chart and an alert is trigge
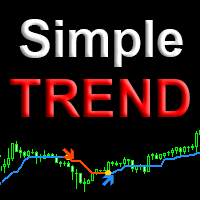
Simple trend is a professional version of the trend indicator and entry points. It uses Price action and a unique filtering algorithm to determine the trend. Shows the change in the direction of price movement on any currency pairs, without redrawing the result. Suitable for determining entry points for scalping and swing, as well as for intraday, medium-term trading. Features Marks trend reversal locations and directions. Suitable for all types of trading, in any markets. Allows you to enter

Whether trading stocks, futures, options, or FX, traders confront the single most important question: to trade trend or range? This tool helps you identify ranges to either trade within, or, wait for breakouts signaling trend onset.
Free download for a limited time! We hope you enjoy, with our very best wishes during this pandemic!
The issue with identifying ranges is some ranges and patterns are easy to miss, and subject to human error when calculated on the fly. The Automatic Range Identifi
FREE

The Heikin Ashi indicator is our version of the Heikin Ashi chart. Unlike competitor products, this indicator offers extensive options for calculating Heikin Ashi candles. In addition, it can be displayed as a classic or smoothed version.
The indicator can calculate Heikin Ashi with moving average by four methods: SMA - Simple Moving Average SMMA - Smoothed Moving Average EMA - Exponential Moving Average LWMA - Linear Weighted Moving Average
Main features The indicator shows Heikin As
FREE

The Fibonacci indicator automatically displays the Fibonacci retracement levels, representing significant support and resistance. The range for calculating the indicator can be taken from the previous day, week, month, year or user-specified session.
Levels 100 % (High) of the range from the previous session. 0 % (Low) of the range from the previous session. 76,4 % of the range from the previous session. 61,8 % of the range from the previous session. 50 % of the range from the previou
FREE
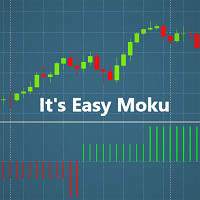
Introduction:
Welcome dear Users, This indicator has been developed in order to help traders who are daily struggling to find a strategy . I have always been acctracted by Ichimoku Strategy, however took me sometime figure out how it does work. Easy Moku makes Ichimoku Simple!
Aspect:
Easy Moku shows 2 principal ICHIMOKU signals: kijun sen/tenken sen sen crossover Span A Span B + Kijun sen/tenken sen Get Rid of all the Ichimoku Lines!
On the Mt4 Chart the Easy Moku paints an Histogram: (
FREE
For those who have followed my FCK Quantum Scalping thread know about the FCK Quantum Scalping indicator and have taken the indicator to different levels (Mastermind) to suit his or her trading style. In this system, the Quantum indicator is only for showing us trading entries, and that’s it. Targets and stop levels are a little later. For those who don’t know what the FCK Quantum Scalping indicator is, I’ll tell you. The FCK Quantum Scalping indicator is basically a modified Wave indicator i
FREE
MetaTrader mağazası, alım-satım robotları ve teknik göstergelerin benzersiz bir deposudur.
Yatırımcılara sunduğumuz benzersiz hizmetler hakkında daha fazla bilgi edinmek için MQL5.community - Kullanıcı notunu okuyun: alım-satım sinyallerini kopyalama, freelancerlar tarafından geliştirilen özel uygulamalar, ödeme sistemi aracılığıyla otomatik ödemeler ve MQL5 Bulut Ağı.
Alım-satım fırsatlarını kaçırıyorsunuz:
- Ücretsiz alım-satım uygulamaları
- İşlem kopyalama için 8.000'den fazla sinyal
- Finansal piyasaları keşfetmek için ekonomik haberler
Kayıt
Giriş yap
Gizlilik ve Veri Koruma Politikasını ve MQL5.com Kullanım Şartlarını kabul edersiniz
Hesabınız yoksa, lütfen kaydolun
MQL5.com web sitesine giriş yapmak için çerezlerin kullanımına izin vermelisiniz.
Lütfen tarayıcınızda gerekli ayarı etkinleştirin, aksi takdirde giriş yapamazsınız.