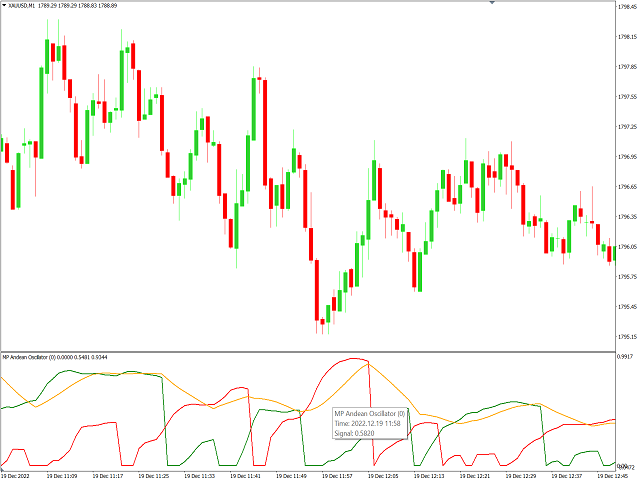
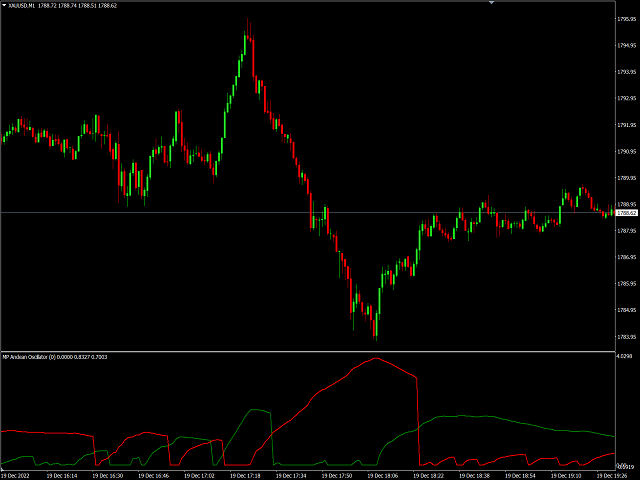
MP Andean Oscillator
- Indicadores
- Versión: 1.0

El Oscilador Andino MP se utiliza para estimar la dirección y también el grado de variación de las tendencias.
Contiene 3 componentes: Componente alcista, componente bajista y componente de señal. Un componente alcista ascendente indica que el mercado está en tendencia alcista, mientras que un componente bajista ascendente indica la presencia de un mercado en tendencia bajista.
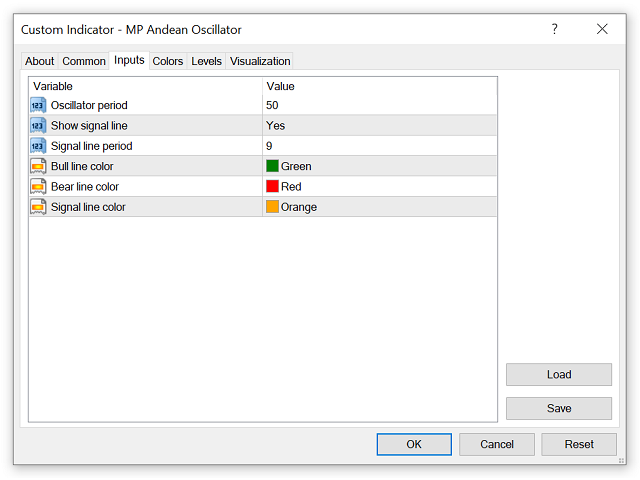
Ajustes:
- Periodo del oscilador: Especifica la importancia de las tendencias grado de variaciones medidas por el indicador.
- Periodo de la línea de señal: Periodo medio móvil de la línea de señal.
Reglas de uso:
- Largo: Línea alcista cruza sobre línea bajista
- Corto: Línea bajista cruza la línea alcista
- Exit Long: Línea alcista cruza por debajo de la línea de señal
- Salida en corto: la línea bajista cruza por debajo de la línea de señal
Aunque la línea de señal se puede utilizar para filtrar señales falsas, puede inducir a una peor sincronización en comparación con las condiciones mencionadas anteriormente.
Notas importantes:
___________________________________________________________________________________
Descargo de responsabilidad:
NO opere o invierta basándose en el análisis presentado en este canal. Siempre haga su propia investigación y diligencia debida antes de invertir u operar. Nunca le diré qué hacer con su capital, operaciones o inversiones. Tampoco te recomendaré nunca que compres, vendas, te pongas largo o corto en ningún activo, materia prima, valor, derivado o instrumento relacionado con criptomonedas, ¡ya que es de muy ALTO RIESGO! Usted siempre debe consultar con un asesor financiero profesional / con licencia antes de negociar o invertir en cualquier tipo de activos.
Guter Indikator