Automatic Range Identifier
- Indicadores
-
Libertas LLC
 Libertas LLC is a software company by enterprising math nerds. We make high quality and complex mathematical tools in a user-friendly and easy to use package for retail investors.
 - Versión: 1.0
Free download for a limited time! We hope you enjoy, with our very best wishes during this pandemic!
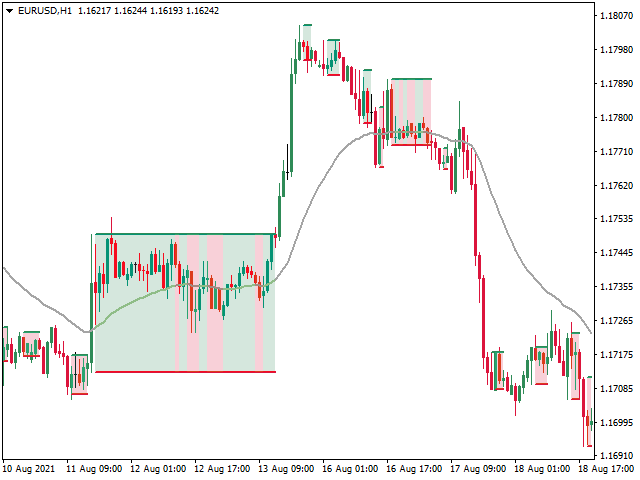
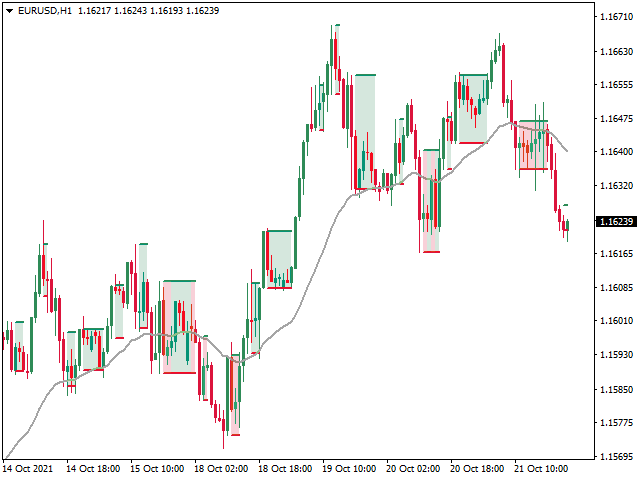
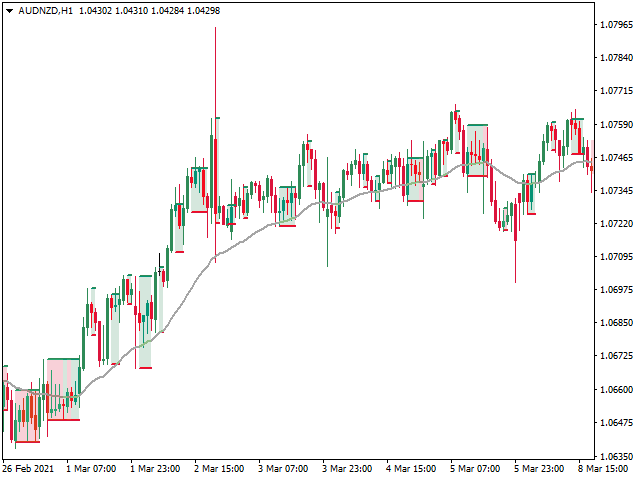
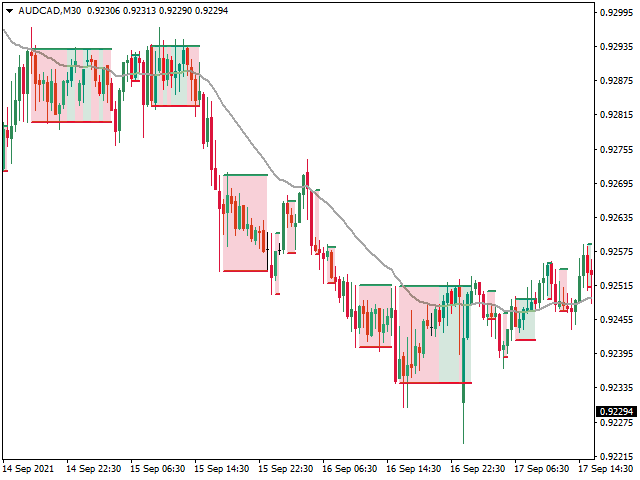
El problema con la identificación de rangos es que algunos rangos y patrones son fáciles de pasar por alto, y están sujetos a errores humanos cuando se calculan sobre la marcha. El Identificador Automático de Rangos calcula tanto los rangos actuales como los formados históricamente, y los traza de forma clara en su gráfico. Es un concepto sencillo: el algoritmo busca los puntos máximos y mínimos recientes, y detecta la acción del precio limitada por rangos que se mantiene dentro de estos puntos. Esto también resulta muy útil como punto de partida para trazar líneas de soporte y resistencia relevantes.
Se trata de una herramienta sencilla y extremadamente útil que todo operador debería tener en su caja de herramientas.
Cómo utilizar
Recomendamos comprobar los rangos identificados a través de diferentes marcos temporales, para darle la mayor perspectiva sobre las acciones de los precios en su marco temporal principal de elección... los marcos temporales más altos generalmente mostrarán las líneas más fuertes de soporte y resistencia que pueden afectar a su marco temporal, y, los marcos temporales más bajos pueden dar indicaciones de alerta temprana de cambios en el movimiento de los precios. por ejemplo, si está operando en un intervalo de 15M, ¡asegúrese de comprobar también 5M y 1H!
Parámetros
- Conectar rangos (por defecto=False): Dibuja líneas y conecta el relleno entre diferentes rangos para un gráfico continuo.
- Mostrar EMA (por defecto=Verdadero): Mostrar la línea EMA
- Longitud EMA: # Barras a utilizar para calcular la EMA
- Resaltar rangos: traza un relleno semiopaco para los rangos identificados
- Colores: especifica los colores para los rellenos y las líneas
- Opacidad de relleno: Especifique la opacidad del relleno en el gráfico


Excelente indicador.