Conjunto de instrumentos para el marcado manual de gráficos y comercio (Parte II). Haciendo el marcado

Introducción
En el artículo anterior, decidimos crear una herramienta adecuada que me permitiera dibujar de forma rápida líneas rectas en los gráficos utilizando atajos de teclado. También hay un vídeo que muestra cómo funciona la solución terminada.
En la implementación actual no hay ninguna interfaz gráfica (aunque está planificada para el futuro). El programa simplemente dibuja líneas utilizando los atajos de teclado y acelera el acceso a acciones como el cambio del "nivel" actual del gráfico ("índice Z"), la alternancia entre marcos temporales y el cambio del modo de dibujado de la línea recta (rayo/segmento).
La posición del puntero del ratón determina dónde se dibujará el objeto. Si el puntero se encuentra por encima del precio, los extremos basados en el máximo de la vela se seleccionarán como puntos base. Si el puntero se encuentra por debajo del precio, se usarán los precios Low.
Objetos que puede dibujar la actual versión de la biblioteca:
- Líneas rectas simples ("infinitas") — horizontales y verticales.
- Líneas de tendencia habituales (según los dos extremos más próximos al ratón). Podrá personalizar la línea como un rayo o solo como un segmento. Si la línea tiene la forma de un segmento, podrá establecer el modo en el que esta será un extremo en el futuro. En dicho caso, el tamaño de la línea será igual a la distancia entre los extremos multiplicada por un cierto coeficiente que se podrá ajustar en los parámetros del asesor.
- Niveles horizontales de cierta longitud (no infinita). Podrá dibujar cortos y "alargados", con un coeficiente determinado respecto a la línea corta.
- Segmento vertical con marcas de nivel.
- Abanico de Fibonacci. Los parámetros de nivel se pueden configurar, pero nosotros utilizamos una versión ligeramente modificada que ya mostró una vez en "Onyx" un hombre con el nick "Vadimcha". Ese abanico se llamaba VFan, y en nuestro código nos ceñimos a este nombre.
- Conjunto de Tridentes de Andrews compuesto por tres objetos.
La estructura del proyecto es bastante sencilla. En la biblioteca hay cinco archivos relacionados entre sí: "GlobalVariables.mqh", "Graphics.mqh", "Mouse.mqh", "Shortcuts.mqh" y "Utilites.mqh". Todos los archivos están en una misma carpeta "Shortcuts" en el directorio estándar "Include".
El archivo principal es "Shortcuts.mqh", todos los demás archivos están conectados a él. En este se crea una instancia de la clase CShortcuts que facilita la inclusión de la biblioteca en nuestro asesor experto principal.
En el artículo anterior, nos centramos en el archivo de funciones auxiliares "Utilites.mqh"; en esta parte, hablaremos del archivo "Graphics.mqh" que contiene la lógica de dibujado.
Archivo de configuración global
En la segunda versión de la biblioteca, las opciones de configuración se ven significativamente ampliadas, ya que disponemos de más objetos sobre los que podemos influir. Aquí tenemos el código completo de la versión actual:
//+------------------------------------------------------------------+
//|                                              GlobalVariables.mqh |
//|                        Copyright 2020, MetaQuotes Software Corp. |
//|                            https://www.mql5.com/en/articles/7908 |
//+------------------------------------------------------------------+
#property copyright "Copyright 2020, MetaQuotes Software Corp."
#property link      "https://www.mql5.com/en/articles/7908"
//+------------------------------------------------------------------+
//| File describing parameters available to the user                 |
//+------------------------------------------------------------------+
#define VERSION 2.0 // Not #property but a constant. A bit more convenient.
//+------------------------------------------------------------------+
//| Key settings                                                     |
//+------------------------------------------------------------------+
input string   Keys="=== Key settings ===";
input string   Up_Key="U";                          // Switch timeframe up
input string   Down_Key="D";                        // Switch timeframe down
input string   Trend_Line_Key="T";                  // Trend line
input string   Switch_Trend_Ray_Key="R";            // Indication of a trend line ray
input string   Z_Index_Key="Z";                     // Indication of the chart on top
input string   Vertical_With_Short_Levels_Key="V";  // Vertical segment
input string   Short_Level_Key="S";                 // Short level
input string   Long_Level_Key="L";                  // Extended level
input string   Simple_Horizontal_Line_Key="H";      // Simple horizontal line
input string   Simple_Vertical_Line_Key="I";        // Simple vertical line
input string   VFun_Key="F";                        // Fibonacci fan
input string   Pitchfork_Key="P";                   // Andrews' pitchfork

//+------------------------------------------------------------------+
//| Color setting                                                    |
//+------------------------------------------------------------------+
input string   Colors="=== Color Settings ===";
input color    VFan_Color=clrLightGray;            // Color of the fan lines
                                                   //   (and an additional
                                                   //    one for special cases)
//---
input color    Pitchfork_Main_Color = clrBlue;     // Andrews' pitchfork color
input color    Pitchfork_Shiff_Color = clrRed;     // Schiff pitchfork color
input color    Pitchfork_Reverce_Color = clrYellow;// "Reverse" pitchfork color

//+------------------------------------------------------------------+
//| Size settings                                                    |
//+------------------------------------------------------------------+
input string   Dimensions="=== Size settings ===";
input int      Short_Level_Length=12;     // Short level length (bar)
input int      Short_Level_Width=1;       // Line width for the short level
input int      Long_Level_Width=2;        // Line width for the long level
input int      Vertical_With_Short_Levels_Width=1; // Vertical line width with levels
input int      Short_Level_7_8_Width=1;   // Level 7/8 line width
input int      Short_Level_14_8_Width=1;  // Level 14/8 line width
input int      Simple_Vertical_Width=1;   // Simple vertical line width
input int      Simple_Horizontal_Width=1; // Simple horizontal line width
input int      Trend_Line_Width=2;        // Trend line width

//+------------------------------------------------------------------+
//| Display styles                                                   |
//+------------------------------------------------------------------+
input string   Styles="=== Display styles ===";
input ENUM_LINE_STYLE      Vertical_With_Short_Levels_Style=STYLE_SOLID; // Vertical Line style
                                                                         // with levels
input ENUM_LINE_STYLE      Short_Level_Style=STYLE_SOLID;      // Short Level style
input ENUM_LINE_STYLE      Long_Level_Style=STYLE_SOLID;       // Long level style
input ENUM_LINE_STYLE      Short_Level_7_8_Style=STYLE_SOLID;  // Level 7/8 style
input ENUM_LINE_STYLE      Short_Level_14_8_Style=STYLE_DOT;   // Level 14/8 style
input ENUM_LINE_STYLE      Simple_Vertical_Style=STYLE_DOT;    // Simple Vertical style
input ENUM_LINE_STYLE      Simple_Horizontal_Style=STYLE_DOT;  // Simple Horizontal style
input ENUM_LINE_STYLE      VFun_Levels_Style=STYLE_SOLID;      // Fan Style
input ENUM_LINE_STYLE      Trend_Line_Style=STYLE_SOLID;       // Trend line style
//---
input ENUM_LINE_STYLE      Pitchfork_Main_Style = STYLE_SOLID;    // Andrews' Pitchfork style
input ENUM_LINE_STYLE      Pitchfork_Shiff_Style = STYLE_SOLID;   // Shiff Pitchfork style
input ENUM_LINE_STYLE      Pitchfork_Reverce_Style = STYLE_SOLID; // Reverse Pitchfork style
//+------------------------------------------------------------------+
//| Pitchfork extrema parameters                                     |
//+------------------------------------------------------------------+
input string               Pitchforks="=== Pitchfork Extrema Parameters ===";
//---
input int                  Pitchfork_First_Point_Left_Bars=6;   // Pitchfork - 1st point, bars on the left
input int                  Pitchfork_First_Point_Right_Bars=6;  // Pitchfork - 1st point, bars on the left
//---
input int                  Pitchfork_Second_Point_Left_Bars=6;  // Pitchfork - 2nd point, bars on the left
input int                  Pitchfork_Second_Point_Right_Bars=6; // Pitchfork - 2nd point, bars on the right
//---
input int                  Pitchfork_Third_Point_Left_Bars=6;   // Pitchfork - 3rd point, bars on the left
input int                  Pitchfork_Third_Point_Right_Bars=2;  // Pitchfork - 3rd point, bars on the right
//+------------------------------------------------------------------+
//| Other parameters                                                 |
//+------------------------------------------------------------------+
input string               Others="=== Other parameters ===";
input double               Vertical_Short_Level_Coefficient=0.825;  // Coefficient of vertical levels
input double               Long_Level_Multiplicator=2;              // Multiplier for the long level
input int                  Trend_Length_Coefficient=4;              // Coefficient for the trend line length
input bool                 Is_Trend_Ray=false;                      // Trend line - ray
input bool                 Is_Change_Timeframe_On_Create = true;    // Hide objects on higher timeframes?
                                                                    //   (true - hide, false - show)
input bool                 Is_Select_On_Create=true;                // Select upon creation
input bool                 Is_Different_Colors=true;                // Change colors for times

// Number of bars on the left and on the right
// for trend line and fan extreme points
input int                  Fractal_Size_Left=1;                     // Size of the left fractal
input int                  Fractal_Size_Right=1;                    // Size of the right fractal

input bool                 Pitchfork_Show_Main = true;     // Display Andrews' pitchfork
input bool                 Pitchfork_Show_Shiff = true;    // Display Shiff pitchfork
input bool                 Pitchfork_Show_Reverce = true;  // Display "Reverse" pitchfork
input bool                 Print_Warning_Messages=true;    // Display error messages
input string               VFun_Levels="-1.5,-0.618,-0.236,"+
                                       "  0,0.236,0.382,"+
                                       "  0.618,0.786,0.886,0.942";  // Fan levels
input string               Array_Delimiter=",";            // Array elements separator
//---

//+------------------------------------------------------------------+
//| Name prefixes of drawn shapes (can be change only in code,       |
//| not visible in EA parameters)                                    |
//+------------------------------------------------------------------+
//string   Prefixes="=== Prefixes ===";
//string   Vertical_With_Short_Levels_Prefix="Vertical_";  // Prefix for vertical lines with levels
//string   Short_Level_Prefix="Short_Level_";              // Prefix for short levels
//string   Long_Level_Prefix="Long_Level_";                // Prefix for long levels
//string   Simple_Horizontal_Prefix="Simple_H_";           // Prefix for simple horizontal lines
//string   Simple_Vertical_Prefix="Simple_V_";             // Prefix for simple vertical lines
//string   VFan_Prefix="VFan_";                            // Prefix for fan
//string   Trend_Line_Prefix="Trend_";                     // Prefix for trend lines
//string   Pitchfork_Prefix="Pitchfork_";                  // Prefix for pitchfork
string   allPrefixes[] =      // Prefixes for object names
  {
   "Trend_",            // 0 - Prefix for trend lines
   "Simple_H_",         // 1 - Prefix for simple horizontal lines
   "Simple_V_",         // 2 - Prefix for simple vertical lines
   "VFan_",             // 3 - Prefix for fan
   "Pitchfork_",        // 4 - Prefix for pitchfork
   "Vertical_",         // 5 - Prefix for vertical lines with levels
   "Short_Level_",      // 6 - Prefix for short levels
   "Long_Level_"        // 7 - Prefix for long levels
  };

//+------------------------------------------------------------------+
//| Colors for objects of one timeframe (can be changed only in code,|
//| not visible in EA parameters)                                    |
//+------------------------------------------------------------------+
// string TimeframeColors="=== Standard Colors for Timeframes  ===";
color mn1_color=clrCrimson;
color w1_color=clrDarkOrange;
color d1_color=clrGoldenrod;
color h4_color=clrLimeGreen;
color h1_color=clrLime;
color m30_color=clrDeepSkyBlue;
color m15_color=clrBlue;
color m5_color=clrViolet;
color m1_color=clrDarkViolet;
color common_color=clrGray;

//--- Auxiliary constant for displaying error messages
#define DEBUG_MESSAGE_PREFIX "=== ",__FUNCTION__," === "

//--- Constants for describing the main timeframes when drawing
//--- For compatibility with version 4, timeframes that do not exist
//---    in the toolbar are excluded.
#define PERIOD_LOWER_M5 OBJ_PERIOD_M1|OBJ_PERIOD_M5
#define PERIOD_LOWER_M15 PERIOD_LOWER_M5|OBJ_PERIOD_M15
#define PERIOD_LOWER_M30 PERIOD_LOWER_M15|OBJ_PERIOD_M30
#define PERIOD_LOWER_H1 PERIOD_LOWER_M30|OBJ_PERIOD_H1
#define PERIOD_LOWER_H4 PERIOD_LOWER_H1|OBJ_PERIOD_H4
#define PERIOD_LOWER_D1 PERIOD_LOWER_H4|OBJ_PERIOD_D1
#define PERIOD_LOWER_W1 PERIOD_LOWER_D1|OBJ_PERIOD_W1
//+------------------------------------------------------------------+
Destacamos en color amarillo las nuevas características en este listado que no estaban presentes en la versión anterior. Nos permitirán personalizar no solo las líneas rectas, sino también otros objetos que aparecen en la pantalla.
Hemos puesto los nombres de los prefijos de los objetos en una matriz para que resulten más cómodos de usar más adelante. Por ejemplo, planeamos una función para eliminar objetos complejos (por ejemplo, verticales con niveles); allí, la matriz será más cómoda.
Ahora que nos hemos aclarado con la configuración, puede empezar a dibujar.
Dibujado de "primitivas": vertical y horizontal
El primer objeto que queremos crear son las líneas de nivel y tiempo (líneas horizontales y verticales infinitas). De hecho, la biblioteca comenzó con dichas líneas.
Aquí está el código:
//+------------------------------------------------------------------+
//| Draws simple straight lines (vertical and horizontal) in the     |
//| position specified by mouse or parameters                        |
//| Parameters:                                                      |
//|   _object_type - object type. Can be OBJ_VLINE or OBJ_HLINE      |
//|   _time - time.  If not specified, mouse time is used            |
//|   _price - price. If not specified, price under index is used.   |
//+------------------------------------------------------------------+
void              CGraphics::DrawSimple(
   ENUM_OBJECT _object_type, // Object type
   datetime    _time=-1,     // Time
   double      _price=-1     // Price
)
  {
//---
   string Current_Object_Name;   // The name of the future object
   color Current_Object_Color=   // Color (depends on the "standard" color of the timeframe)
      CUtilites::GetTimeFrameColor(CUtilites::GetAllLowerTimeframes());
   datetime Current_Object_Time; // Starting point time
   double Current_Object_Price;  // Starting point price
   ENUM_LINE_STYLE Current_Object_Style=STYLE_DOT; // Line style
   int Current_Object_Width=1;   // Line width
   int window=0;                 // Subwindow number

//--- Set up line parameters depending on the type
   if(_object_type==OBJ_VLINE)   // For vertical lines
     {
      Current_Object_Name=       // Generate the name
         CUtilites::GetCurrentObjectName(
            Simple_Vertical_Prefix,
            _object_type
         );
      // style - according to global parameters
      Current_Object_Style=Simple_Vertical_Style;
      // width - according to global parameters
      Current_Object_Width=Simple_Vertical_Width;
     }
   else
      if(_object_type==OBJ_HLINE)// For horizontal lines
        {
         Current_Object_Name=    // Generate the name
            CUtilites::GetCurrentObjectName(
               Simple_Horizontal_Prefix,
               _object_type
            );
         // style - according to global parameters
         Current_Object_Style=Simple_Horizontal_Style;
         // width - according to global parameters
         Current_Object_Width=Simple_Horizontal_Width;
        }
      else  // This function only draws horizontal and vertical lines.
        {
         // If something else is passed in parameters...
         if(Print_Warning_Messages)
           {
            // ...report an error...
            Print(DEBUG_MESSAGE_PREFIX,"Error, wrong object type");
           }
         // ...and exit.
         return;
        }

//--- If coordinates are not specified in the parameters, use the coordinates of the mouse
   Current_Object_Price = _price==-1 ? CMouse::Price() : _price;
   Current_Object_Time = _time==-1 ? CMouse::Time() : _time;

//--- Create the object
   ObjectCreate(
      0,
      Current_Object_Name,
      _object_type,
      0,
      Current_Object_Time,
      Current_Object_Price
   );

//--- Set display parameters for the created object
   CurrentObjectDecorate(
      Current_Object_Name,
      Current_Object_Color,
      Current_Object_Width,
      Current_Object_Style
   );

//--- Redraw the chart and complete
   ChartRedraw(0);
  }
Las operaciones son muy sencillas. Generamos un nombre, tomamos los parámetros de los ajustes de las variables input descritas en el archivo "GlobalVariables.mqh" y obtenemos las coordenadas del punto de partida del objeto (ya sea de los parámetros de la función, o simplemente como las coordenadas del ratón). Ahora, nuestro objeto está listo.
¡Bravo, camaradas!
Queda por añadir esta función al encabezado del archivo
//+------------------------------------------------------------------+
//|                                                     Graphics.mqh |
//|                        Copyright 2020, MetaQuotes Software Corp. |
//|                            https://www.mql5.com/es/articles/7468 |
//+------------------------------------------------------------------+

// ...

//+------------------------------------------------------------------+
//| Class for plotting graphic objects                               |
//+------------------------------------------------------------------+
class CGraphics
  {

   // ...

public:

   // ...

   //--- Draws simple straight lines (vertical and horizontal)
   void              CGraphics::DrawSimple(
      ENUM_OBJECT _object_type, // Object type
      datetime    _time=-1,     // Time
      double      _price=-1     // Price
   )

   // ...
  }
;
//+------------------------------------------------------------------+
Bueno, y también añadir el procesamiento para presionar las teclas correspondientes:
//+------------------------------------------------------------------+
//|                                                    Shortcuts.mqh |
//+------------------------------------------------------------------+

// ...

//+------------------------------------------------------------------+
//| Event handling function                                          |
//+------------------------------------------------------------------+
void CShortcuts::OnChartEvent(
   const int id,
   const long &lparam,
   const double &dparam,
   const string &sparam
)
  {
//---
   int window = 0;
//---
   switch(id)
     {

      // ...

      //--- Handle keystrokes
      case CHARTEVENT_KEYDOWN:

         // ...

         //--- Draw a simple vertical line
         if(CUtilites::GetCurrentOperationChar(Simple_Vertical_Line_Key) == lparam)
           {
            m_graphics.DrawSimple(OBJ_VLINE);
           }
         //--- Draw a simple horizontal line
         if(CUtilites::GetCurrentOperationChar(Simple_Horizontal_Line_Key) == lparam)
           {
            m_graphics.DrawSimple(OBJ_HLINE);
           }

         // ...

         break;
         //---

     }
  }
En el futuro, para ahorrar espacio en la pantalla y concentrarnos en lo importante, al añadir la descripción de las funciones, por regla general, no escribiremos los registros de encabezado. Asimismo, al añadir los comandos, simplemente usaremos las líneas correspondientes (destacadas en amarillo).
Como resultado, tras realizar todas las adiciones y compilaciones, hemos obtenido un resultado muy simple: dos comandos que dibujan primitivas gráficas en cualquier lugar de la ventana actual:

Las teclas que se corresponden con estas rectas se designan por defecto como "I" (i) y "H" (h).
Y también queremos recordar al lector que, al crear todos los objetos, dependiendo del marco temporal actual, el color de los objetos será diferente. Asimismo, los objetos de los marcos temporales inferiores no se muestran en los marcos temporales superiores (con la configuración por defecto).


Para posibilitar la compatibilidad con MQL4, solo se usan los marcos temporales estándar de la barra de herramientas mostrados por defecto. Los mismos marcos temporales se seleccionan utilizando el atajo "U" "D" (al presionar estas teclas, el marco temporal cambia, respectivamente, al marco superior y al marco inferior, vea la función CUtilites::ChangeTimeframes).
VFun es el propio abanico de Fibonacci
La siguiente figura que queríamos dibujar es el abanico de Fibonacci. Lo usamos con bastante frecuencia, pues resulta cómodo, pero recordar todos sus rayos cada vez que uno se sienta en otro terminal al cambiar de sistema, resulta muy inconveniente. Así que pensamos que, como ahora tenemos un asesor experto magnífico, simplemente sería un pecado no aprovechar esta oportunidad 🙂.
Entonces pensamos que sería bueno tener una función universal que definiera los niveles de Fibonacci para cualquier objeto (abanico, canal o niveles horizontales de Fibonacci) que dibujáramos usando la biblioteca. Esta es la función.
//+------------------------------------------------------------------+
//| Sets level values and form in any Fibonacci object               |
//|    Uses colors and styles from the class fields                  |
//| Parameters:                                                      |
//|    _object_name - the name of the Fibonacci object               |
//|    _levels_values[] - array of level values                      |
//+------------------------------------------------------------------+
void CGraphics::SetFiboLevels(
   string _object_name,                      // Object name
   const double &_levels_values[]            // Array of values
)
  {
   int i,                                      // Current level counter
       levels_count=ArraySize(_levels_values); // Total number of levels

//--- Check if the number of values in the array exceeds the allowed range
   if(levels_count>32 || levels_count==0)
     {
      Print(DEBUG_MESSAGE_PREFIX,": Levels cannot be set! La matriz de datos no es válida. ");
      return;
     }

//--- Proceed with the implementation

//--- Set the number of levels for the current object
   ObjectSetInteger(0,_object_name,OBJPROP_LEVELS,levels_count);
//--- Set value, color and style for each level.
   for(i=0; i<levels_count; i++)
     {
      ObjectSetDouble(0,_object_name,OBJPROP_LEVELVALUE,i,_levels_values[i]);
      ObjectSetInteger(0,_object_name,OBJPROP_LEVELCOLOR,i,m_Fibo_Default_Color);
      ObjectSetInteger(0,_object_name,OBJPROP_LEVELSTYLE,i,m_Fibo_Default_Style);
     }
//--- Redraw the chart before finishing
   ChartRedraw(0);
  }
Como parámetros a la función, transmitimos el nombre del objeto que debe recibir los niveles y, propiamente, la matriz de valores de todos los niveles.
Primero, la función verifica cuántos niveles le han sido transmitidos. Si la matriz es demasiado grande, la función asume que se ha producido un error y no hace nada. Exactamente de la misma forma sucede la salida, si no hay ningún elemento en la matriz.
Bueno, si todo está en orden y el número de elementos en la matriz no supera la cantidad de niveles permitida, comenzaremos la adición. El nombre del objeto se indica en los parámetros, por lo que solo tenemos que establecer la propiedad correspondiente del objeto como igual al número de elementos de la matriz, e iterar por toda la matriz estableciendo los niveles apropiados.
MQL5 también ofrece la posibilidad de asignar diferentes parámetros a diferentes niveles. Por ejemplo, colorear uno de verde, otro de amarillo y el tercero de rojo o morado. Y también hacer que los niveles sean diferentes en estilo (como puntos, línea discontinua, continua...). No existen tales funciones en MQL4. No obstante, hemos añadido al ciclo líneas que asignan los colores y los estilos a los niveles. No dificultan la compilación, sino que añaden cierta universalidad a MQL5.
Las variables que describen los parámetros predefinidos se describen como miembros privados de la clase CGraphics y se inicializan en el constructor de esta clase con los valores de los parámetros del asesor.
//+------------------------------------------------------------------+
//|                                                     Graphics.mqh |
//+------------------------------------------------------------------+
//+------------------------------------------------------------------+
//| Class for plotting graphic objects                               |
//+------------------------------------------------------------------+
class CGraphics
  {
   //--- Fields
private:
   // ...
   color             m_Fibo_Default_Color;
   ENUM_LINE_STYLE   m_Fibo_Default_Style;
   // ...
//+------------------------------------------------------------------+
//| Default constructor                                              |
//+------------------------------------------------------------------+
CGraphics::CGraphics(void)
  {
   //...
   m_Fibo_Default_Color = Fibo_Default_Color;
   m_Fibo_Default_Style = VFun_Levels_Style;
  }
   // ...
Para aquellos a quienes no les importa la compatibilidad, hemos añadido al código la redefinición de esa función. Ahí se implementa la capacidad de definir los parámetros para cada nivel usando las matrices transmitidas en los parámetros de la propia función. Pero para aquellos que entienden cómo funciona (o para aquellos que han analizado minuciosamente mi código y han logrado comprenderlo) no hay nada especial, así que si alguien necesita una descripción, que lo escriba en los comentarios. En el archivo se incluye una redefinición para esta función.
Vamos a mostrar otra función más que define las descripciones de los niveles para cualquier objeto de Fibonacci.
//+------------------------------------------------------------------+
//| Sets descriptions of levels in any Fibonacci object              |
//|    _object_name - the name of the Fibonacci object               |
//|    _levels_descriptions[] - array of level descriptions          |
//+------------------------------------------------------------------+
void CGraphics::SetFiboDescriptions(
   string _object_name,                  // Object name
   const string &_levels_descriptions[]  // Array of descriptions
)
  {
   int i,                                                                  // Current level counter
       levels_count=(int)ObjectGetInteger(0,_object_name,OBJPROP_LEVELS),  // Real number of levels
       array_size=ArraySize(_levels_descriptions);                         // The number of received descriptions
//--- Loop  through all levels
   for(i=0; i<levels_count; i++)
     {
      if(array_size>0 && i<array_size) // Choose a description from the array
        {
         //--- and write it to the level
         ObjectSetString(0,_object_name,OBJPROP_LEVELTEXT,i,_levels_descriptions[i]);
        }
      else // If the descriptions are not enough,
        {
         ObjectSetString(0,_object_name,OBJPROP_LEVELTEXT,i,""); // leave the description empty
        }
     }
//--- Redraw the chart before finishing
   ChartRedraw(0);
  }
Aquí tampoco hay nada complicado. La única condición es que los niveles del objeto ya hayan sido establecidos en el momento en que se llame a esta función. La función simplemente pasará por estos niveles y asignará la descripción de cada valor correspondiente de la matriz. Si no hay suficientes datos en la matriz, todos los niveles "adicionales" simplemente permanecerán sin descripción.
Ahora que los niveles se ha vuelto fáciles de añadir, podemos escribir la función de adición del abanico.
//+------------------------------------------------------------------+
//| Draws a Fibonacci fan from the nearest local extremum.           |
//+------------------------------------------------------------------+
void CGraphics::DrawVFan(void)
  {
//---
   double levels_values[];                 // Array of level values
   string levels_descriptions[] = {};      // Array of level descriptions
   int p1=0,                               // Bar number for the fan starting point
       p2=0;                               // Bar number for the fan ending point
   double price1=0,                        // First point price
          price2=0;                        // Second point price
   string fun_name =                       // Fan name
      CUtilites::GetCurrentObjectName(allPrefixes[3],OBJ_FIBOFAN),
      fun_0_name =
         CUtilites::GetCurrentObjectName(allPrefixes[3]+"0_",OBJ_TREND);

//--- Get data for the fan from the parameter string
   CUtilites::StringToDoubleArray(VFun_Levels,levels_values);

//--- Find the extreme points closest to the mouse
   if(CMouse::Below())     // If the mouse cursor is below the price
     {
      CUtilites::SetExtremumsBarsNumbers(false,p1,p2);
      price1=iLow(Symbol(),PERIOD_CURRENT,p1);
      price2=iLow(Symbol(),PERIOD_CURRENT,p2);
     }
   else
      if(CMouse::Above())  // If the mouse cursor is above the price
        {
         CUtilites::SetExtremumsBarsNumbers(true,p1,p2);
         price1=iHigh(Symbol(),PERIOD_CURRENT,p1);
         price2=iHigh(Symbol(),PERIOD_CURRENT,p2);
        }
//--- Create the fan object
   ObjectCreate(
      0,fun_name,OBJ_FIBOFAN,0,
      iTime(Symbol(),PERIOD_CURRENT,p1),
      price1,
      iTime(Symbol(),PERIOD_CURRENT,p2),
      price2
   );

//--- The zero ray of this object is denoted by a colored line (for compatibility with MT4)
   TrendCreate(
      0,
      fun_0_name,
      0,
      iTime(Symbol(),PERIOD_CURRENT,p1),
      price1,
      iTime(Symbol(),PERIOD_CURRENT,p2),
      price2,
      CUtilites::GetTimeFrameColor(CUtilites::GetAllLowerTimeframes()),
      0,1,false,true,true
   );

//--- Describe the fan levels
   SetFiboLevels(fun_name,levels_values);
   SetFiboDescriptions(fun_name, levels_descriptions);

//--- Set standard parameters (such as timeframes and selection after creation)
   CurrentObjectDecorate(fun_name,m_Fibo_Default_Color);
//--- Also make out the "substitute" ray
   CurrentObjectDecorate(
      fun_0_name,
      CUtilites::GetTimeFrameColor(
         CUtilites::GetAllLowerTimeframes()
      )
   );

//---
   ChartRedraw(0);
  }
Resulta más cómodo que el color del rayo a partir del cual se forma el abanico destaque respecto al color de los demás. Para que esto sea posible en MQL4, deberemos trazar una línea regular sobre el abanico, como en el artículo anterior.
En este caso, no necesitaremos los rótulos para los niveles, así que utilizaremos una matriz vacía.
Y la matriz de valores se crea a partir de los parámetros del asesor experto, usando la función de utilidad
CUtilites::StringToDoubleArray(VFun_Levels,levels_values);
En el primer artículo de la serie, ya describimos esta utilidad para convertir una cadena en una matriz de números.
Asimismo, añadimos a la lista de descripciones de comandos un comando para dibujar el abanico:
//+------------------------------------------------------------------+
//|                                                   Shortcuts.mqhh |
//+------------------------------------------------------------------+

   //...
//--- Draw a Fibonacci fan (VFun)
         if(CUtilites::GetCurrentOperationChar(VFun_Key) == lparam)
           {
            m_graphics.DrawVFan();
           }
         break;
   //...
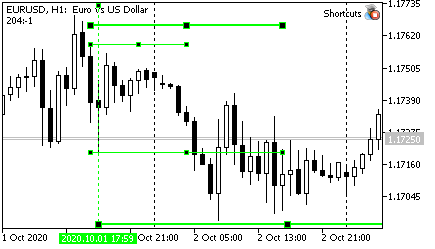
Compilamos y comprobamos qué ha sucedido. Para hacer esto, tenemos que ir al terminal y seleccionar el gráfico deseado.
Como de costumbre, movemos el ratón desde la parte superior o inferior del gráfico, ligeramente hacia la izquierda del extremo en el que queremos basarnos, y luego presionamos el botón "F".
")
Por cierto, mirando la configuración de este abanico en concreto, asumimos que el precio podría bajar muy pronto.
Y así terminó sucediendo... Pero esta es una historia completamente distinta.
")
Tridente de Andrews
Utilizamos 3 tipos de tridentes.
Para empezar, tras elegir los extremos que necesitamos, dibujamos un tridente "simple". Los puntos de este tridente están en los valores extremos de precio.

El segundo tipo de tridente que describe Andrews es el tridente Schiff. El punto 1 de este tridente se desplaza la mitad de la distancia 1-2 por la tendencia. En consecuencia, la pendiente de la línea central es menor. Si el movimiento encaja en este tridente, lo más probable es que el movimiento sea plano, es decir, que el precio esté en un movimiento de "corrección".

Y finalmente, el tridente que conocemos como "inverso". El punto 1 de este tridente se desplaza contra la tendencia, exactamente igual, a la mitad de la distancia 1-2. Este tridente se adapta a movimientos rápidos. Por lo general, es más corto en el tiempo, pero alcanza una mayor distancia en precio.

En el análisis práctico, a menudo resulta más adecuado que los tres tipos de tridente se encuentren en el gráfico al mismo tiempo. En este caso, el movimiento del precio junto con los puntos clave de los probables extremos futuros resulta mucho más evidente.

Para dibujar un conjunto semejante, la biblioteca utiliza dos funciones. La primera es en realidad una función para dibujar un "tridente" de cualquier tipo.
//+------------------------------------------------------------------+
//| Creates Andrews' pitchfork using specified coordinates           |
//| Parameters:                                                      |
//|    _name - the name of created pitchfork                         |
//|    _base - the structure containing coordinates of  basic points |
//|    _type - pitchfork type (SIMPLE,SHIFF,REVERCE)                 |
//+------------------------------------------------------------------+
void  CGraphics::MakePitchfork(
   string _name,           // The name of the created object
   PitchforkPoints &_base, // Structure describing pitchfork base points
   PitchforkType _type     // Pitchfork type (SIMPLE,SHIFF,REVERCE)
)
  {
//---
   double price_first;                 // The price of the first point (depends on the type)
   color pitchfork_color;              // Pitchfork color (depends on the type)
   int pitchfork_width;                // Line width (depends on the type)
   ENUM_LINE_STYLE pitchfork_style;    // Line style (depends on the type)
   double fibo_levels[] = {1};         // Add external levels (only for MQL5)
   string fibo_descriptions[] = {""};  // Level description (only for MQL5)

//--- Set type dependent parameters:
   if(_type == SHIFF)      // Schiff pitchfork
     {
      price_first = _base.shiffMainPointPrice;
      pitchfork_color = Pitchfork_Shiff_Color;
      pitchfork_width = Pitchfork_Shiff_Width;
      pitchfork_style = Pitchfork_Shiff_Style;
     }
   else
      if(_type == REVERCE) // "Reverse" pitchfork
        {
         price_first = _base.reverceMainPointPrice;
         pitchfork_color = Pitchfork_Reverce_Color;
         pitchfork_width = Pitchfork_Reverce_Width;
         pitchfork_style = Pitchfork_Reverce_Style;
        }
      else
        {
         // "classic" pitchfork
         price_first =_base.mainPointPrice;
         pitchfork_color = Pitchfork_Main_Color;
         pitchfork_width = Pitchfork_Main_Width;
         pitchfork_style = Pitchfork_Main_Style;
        }

//--- Draw
   ObjectCreate(0,_name,OBJ_PITCHFORK,0,
                _base.time1,price_first,
                _base.time2,_base.secondPointPrice,
                _base.time3,_base.thirdPointPrice
               );
//--- Set the parameters common for all graphical objects
   CurrentObjectDecorate(
      _name,
      pitchfork_color,
      pitchfork_width,
      pitchfork_style
   );
//--- If MQL5
#ifdef __MQL5__
//--- add external levels (early levels for Andrews' pitchfork)
   SetFiboLevels(_name,fibo_levels);
   SetFiboDescriptions(_name,fibo_descriptions);
#endif

//--- Update the chart picture
   ChartRedraw(0);
  }
La segunda función calcula las coordenadas de los puntos 1, 2 y 3 (bases) para los tridente creados y comienza a dibujar secuencialmente los tres objetos. Precisamente partiendo de estos puntos, el tridente se dibuja usando la función descrita anteriormente y CGraphics::MakePitchfork.
//+------------------------------------------------------------------+
//| Draws set of Andrews pitchforks on one base. The set includes    |
//|    three pitchfork types: regular, Schiff and reverse Schiff     |
//|    (aka "micmed channel")                                        |
//+------------------------------------------------------------------+
void CGraphics::DrawPitchforksSet(void)
  {
   bool up=true;                             // direction (mouse below or above the price)
   double dropped_price = CMouse::Price();   // "Starting point" price
   int dropped_bar = CMouse::Bar();          // Starting point bar number
   string name = "";                         // The name of the current object
   PitchforkPoints base;                     // Structure for the base coordinates
//---
   if(CMouse::Below())
     {
      up=false;
     }
   else
     {
      if(!CMouse::Above()) // If the mouse pointer is on the candlestick, do nothing
        {
         if(Print_Warning_Messages)
           {
            Print(DEBUG_MESSAGE_PREFIX,": Set a point above or below the bar extreme price");
           }
         return;
        }
     }
//--- Find extremum bar numbers
   int bar_first = CUtilites::GetNearestExtremumBarNumber(
                      dropped_bar,
                      true,
                      up,
                      Pitchfork_First_Point_Left_Bars,
                      Pitchfork_First_Point_Right_Bars
                   );
   int bar_second = CUtilites::GetNearestExtremumBarNumber(
                       bar_first-1,
                       true,
                       !up,
                       Pitchfork_Second_Point_Left_Bars,
                       Pitchfork_Second_Point_Right_Bars
                    );
   int bar_third = CUtilites::GetNearestExtremumBarNumber(
                      bar_second-1,
                      true,
                      up,
                      Pitchfork_Third_Point_Left_Bars,
                      Pitchfork_Third_Point_Right_Bars
                   );
//--- If not found, report an error
   if(bar_first<0||bar_second<0||bar_third<0)
     {
      if(Print_Warning_Messages)
        {
         Print(DEBUG_MESSAGE_PREFIX,": Could not find points that match all conditions.");
        }
      return;
     }

//--- Fill the structure for basic control points
   base.mainPointPrice = up ?                               // Price - first basic point
                         iHigh(Symbol(),PERIOD_CURRENT,bar_first)
                         : iLow(Symbol(),PERIOD_CURRENT,bar_first);
   base.secondPointPrice = up ?                             // Price - second basic point
                           iLow(Symbol(),PERIOD_CURRENT,bar_second)
                           : iHigh(Symbol(),PERIOD_CURRENT,bar_second);
   base.thirdPointPrice = up ?                              // Price - third basic point
                          iHigh(Symbol(),PERIOD_CURRENT,bar_third)
                          : iLow(Symbol(),PERIOD_CURRENT,bar_third);
   base.shiffMainPointPrice = base.mainPointPrice-          // Price - first point of Schiff pitchfork
                              (base.mainPointPrice-base.secondPointPrice)/2;
   base.reverceMainPointPrice = base.mainPointPrice+        // Price - first point of "reverse" pitchfork
                                (base.mainPointPrice-base.secondPointPrice)/2;
   base.time1 = iTime(Symbol(),PERIOD_CURRENT,bar_first);   // Time of the first point
   base.time2 = iTime(Symbol(),PERIOD_CURRENT,bar_second);  // Time of the second point
   base.time3 = iTime(Symbol(),PERIOD_CURRENT,bar_third);   // Time of the third point


//--- Draw "regular" pitchfork
   if(Pitchfork_Show_Main)
     {
      name =CUtilites::GetCurrentObjectName(allPrefixes[4]+"_main",OBJ_PITCHFORK);
      MakePitchfork(name,base,SIMPLE);
     }

//--- Draw Schiff pitchfork
   if(Pitchfork_Show_Shiff)
     {
      name =CUtilites::GetCurrentObjectName(allPrefixes[4]+"_shiff",OBJ_PITCHFORK);
      MakePitchfork(name,base,SHIFF);
     }

//--- Draw "reverse" pitchfork
   if(Pitchfork_Show_Reverce)
     {
      name =CUtilites::GetCurrentObjectName(allPrefixes[4]+"_reverce",OBJ_PITCHFORK);
      MakePitchfork(name,base,REVERCE);
     }
//---
//ChartRedraw(0); not needed here as it is called when drawing each object
  }
Para describir los tipos de tridente, usaremos la enumeración:
//+------------------------------------------------------------------+
//| Possible Andrews' pitchfork types                                |
//+------------------------------------------------------------------+
   enum PitchforkType
     {
      SIMPLE,
      SHIFF,
      REVERCE
     };
Hemos introducido una estructura para los puntos (PitchforkPoints base;), para así transmitir menos parámetros al llamar a la función de dibujado.
//+------------------------------------------------------------------+
//|  Structure describing a "base" for the Andrews' pitchfork        |
//+------------------------------------------------------------------+
   struct PitchforkPoints
     {
      double            mainPointPrice;        // Price - first base point
      double            shiffMainPointPrice;   // Price - second base point
      double            reverceMainPointPrice; // Price - third base point
      double            secondPointPrice;      // Price - first point of Schiff pitchfork
      double            thirdPointPrice;       // Price - first point of "reverse" pitchfork
      datetime          time1;                 // Time of the first point
      datetime          time2;                 // Time of the second point
      datetime          time3;                 // Time of the third point
     };
Bueno, y finalmente, añadimos la descripción de la reacción a la tecla de control en el archivo "Shortcuts.mqh":
//+------------------------------------------------------------------+
//|                                                   Shortcuts.mqhh |
//+------------------------------------------------------------------+

   //...
//--- Draw Andrews' Pitchfork
         if(CUtilites::GetCurrentOperationChar(Pitchfork_Key) == lparam)
           {
            m_graphics.DrawPitchforksSet();
           }
         break;
   //...
Compilamos, verificamos...
Para que un conjunto de tridentes aparezca en el gráfico, pulse el botón "P" (Pitchfork).
Peculiaridades de dibujado de las líneas de tendencia en MetaTrader
En principio, los objetos que hemos descrito pueden servir para diseñar cualquier cosa: líneas rectas, tridentes de Andrews, abanicos de Fibonacci, niveles horizontales y verticales...
Exactamente de la misma forma, localizando los puntos extremos a la derecha o izquierda del ratón, podemos dibujar canales horizontales y niveles de Fibonacci... Si dibujamos estas cosas de alguna forma estandarizada, por analogía con lo que ya hemos escrito, podremos añadir fácilmente los recursos que faltan.
En nuestra opinión, lo más complicado en esta biblioteca terminaron siendo las líneas rectas delimitadas a la derecha y con un segundo punto en el futuro.
Estas líneas rectas resultan muy cómodas para marcar niveles significativos, tanto de precio como de tiempo. Como norma general, el precio detecta estos niveles y forma al menos un extremo local en algún lugar cercano y, con frecuencia, se invierte.
Pero al dibujar, resulta que en MetaTrader la función de dibujado de líneas utiliza el precio y el tiempo.
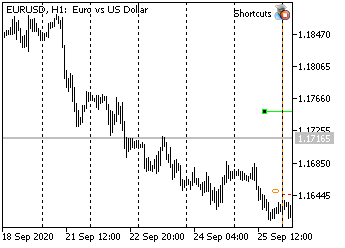
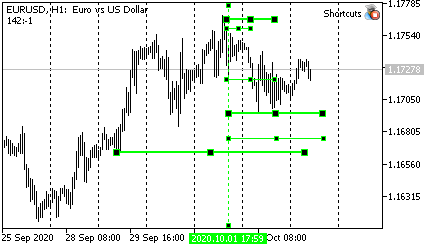
El primer problema aparece cuando las líneas se dibujan el viernes y el borde derecho cae en lunes.

Como el viernes MT cree que debe ser domingo, y el lunes de repente se da cuenta de que no podrá comerciar ese día de ninguna forma y que, por consiguiente, será necesario descartar dos días, la línea trazada según las coordenas temporales se acortará necesariamente. Esto se ve con claridad en la imagen de arriba.
Si necesitamos medir una cierta cantidad de barras en el gráfico, este comportamiento no resulta adecuado.
La solución es bastante simple: la fecha no se calcula según el calendario, sino usando los puntos. Las coordenadas del ratón muestran con exactitud el punto en el gráfico; la distancia entre las velas siempre se puede calcular (por ejemplo, como se describe en la primera parte, en el apartado "Distancia entre barras adyacentes (en píxeles)"), y además, solo necesitaremos contar hacia la derecha el número necesario de velas y luego convertir las coordenadas de la pantalla a la hora y el precio utilizando la función estándar ChartXYToTimePrice... Lo único, claro, es que deberemos trazar esta línea el lunes, no el viernes, para que el "colapso del domingo" no interfiera en la imagen.
Y todo estaría bien en este método, pero... El tamaño del espacio en el que puede dibujar MT es limitado. Y si intenta dibujar una línea más grande que la asignada por el programa (por ejemplo, cerca del borde, como en la figura de la izquierda), los efectos podrían resultar inesperados...
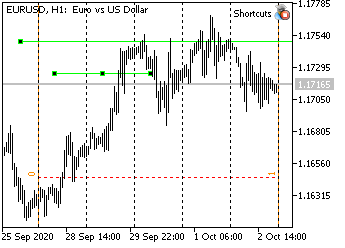
Entonces, la figura de la derecha muestra la misma línea dibujada de forma automática, solo que ahora el gráfico se desplaza para que el borde derecho sea visible, y debajo se muestra la línea normal que debería haber estado en esta escala. ¡El extremo derecho de la línea superior, según sus propiedades, se ha adelantado casi seis meses!
A veces, al darse una línea inclinada, se veía cómo esta se desarrollaba en la dirección opuesta. MT no podía convertir las coordenadas del punto a la fecha correcta, así que... simplemente la reseteó a 0 (en consecuencia, la fecha era el 1 de enero de 1970)... Si dibujamos las líneas según las fechas, este efecto no tendrá lugar.
Conclusión: necesitamos una función que calcule las fechas en un futuro aún indefinido, para que las líneas rectas sean fáciles y agradables de dibujar.
Entonces, ¡manos a la obra!
Función para obtener una fecha en el futuro.
Por lo general, hay algún punto en el presente o en el pasado desde el cual queremos medir algo (por ejemplo, algún tipo de extremo). Además, como norma general, o conocemos la distancia en barras que queremos retroceder, o podemos calcularla fácilmente. Es decir, la tarea más frecuente para esta función será calcular el tiempo respecto a algún punto según el desplazamiento en barras. No obstante, también resulta positivo el efecto de alargar/acortar los niveles dependiendo de la escala; a veces apetece que la función calcule el tiempo por puntos, y no por barras...
Tanto el número de puntos como el número de barras son números enteros, por consiguiente, para saber qué debe hacer, la función necesitará algún tipo de indicación. Empezaremos por eso.
//+------------------------------------------------------------------+
//|                                              GlobalVariables.mqh |
//+------------------------------------------------------------------+

//...
//+------------------------------------------------------------------+
//| The enumeration describes possible options for calculating the   |
//|   time of the next bar                                           |
//|      COUNT_IN_BARS - calculate date by the number of bars        |
//|      COUNT_IN_PIXELS - calculate date by the number of pixels    |
//+------------------------------------------------------------------+
enum ENUM_FUTURE_COUNT {
   COUNT_IN_BARS,    // By bars
   COUNT_IN_PIXELS   // By pixel
};
//...
Todas las descripciones de las enumeraciones y variables globales se encuentran en el archivo GlobalVariables.mqh. Naturalmente, también será necesario anotar la lista de posibles opciones para elegir los intervalos de nuestra futura función.
La función en sí no dibuja nada y no tiene nada que ver con el ratón. Por eso, debe ser una utilidad.
//+------------------------------------------------------------------+
//|                                                     Utilites.mqh |
//+------------------------------------------------------------------+

//...
class CUtilites
  {
public:
//...
   //--- Calculates a date in the future relative to the start date with the _length interval, specified in pixels or bars
   static datetime          GetTimeInFuture(
      const datetime _start_time,                         // Reference time based on which the future bar is calculated
      const int _length,                                  // Interval length (in bars or pixels)
      const ENUM_FUTURE_COUNT _count_type=COUNT_IN_BARS   // Interval type (pixels or bars).
   );

//...

//+------------------------------------------------------------------+
//| The function tries to calculate date in the future using the     |
//|   screen x and y coordinates                                     |
//| If calculation is unsuccessful (time exceeds limits), calculates |
//|   time with an error: as a sum of dates excluding Sundays.       |
//| Parameters:                                                      |
//|   _current_time,              Source time,                       |
//|   _length,                    Interval length                    |
//|                                 (in bars or in pixels)           |
//|   _count_type=COUNT_IN_BARS   How interval length is measured.   |
//|      COUNT_IN_BARS - the interval is set in bars;                |
//|      COUNT_IN_PIXELS - the interval is set in pixels.            |
//| Returns:                                                         |
//|   Time in the future distant from the _current_time              |
//|      by an interval in pixels or bars (_length)                  |
//+------------------------------------------------------------------+
datetime CUtilites::GetTimeInFuture(
   const datetime _start_time,                         // Reference time based on which the future bar is calculated
   const int _length,                                  // Interval length (in bars or pixels)
   const ENUM_FUTURE_COUNT _count_type=COUNT_IN_BARS   // Interval type (pixels or bars).
)
  {
//---
   datetime
      future_time;      // Variable for result
   int
      bar_distance =  GetBarsPixelDistance(),   // Distance in pixels between two adjacent bars
      current_x,                                // The x coordinate of the starting point
      future_x,                                 // The x coordinate of the result
      current_y,                                // The y coordinate, does not affect the result; needed for the conversion function
      subwindow = 0;                            // Subwindow index
   double current_price;                        // Any initial price, does not affect the result


//--- Convert the time passed in parameters into the screen coordinate x
   ChartTimePriceToXY(0,subwindow,_start_time,CMouse::Price(),current_x,current_y);

//--- Calculate a point in the future in screen coordinates
   if(COUNT_IN_BARS == _count_type) // If the length is specified in bars,
     {
      // then the interval size should be converted to pixels.
      future_x = current_x + _length*bar_distance;
     }
   else // ... If the length is in pixels,
     {
      // use it as is
      future_x = current_x + _length;
     }

//--- Convert screen coordinates into time
   if(ChartGetInteger(0,CHART_WIDTH_IN_PIXELS)>=future_x) // If successful,
     {
      ChartXYToTimePrice(0,future_x,current_y,subwindow,future_time,current_price);  // convert the resulting value
     }
   else // Otherwise, if time cannot be calculated because it exceeds limits
     {
      future_time =        // Calculate time as usual, in seconds
         _start_time       // To the starting time
         +(                // add
            ((COUNT_IN_BARS == _count_type) ? _length : _length/bar_distance) // interval size in bars
            *PeriodSeconds()  // multiplied by the number of seconds in the current period
         );
     }
//--- Return the resulting value
   return future_time;
  }
Es cierto que durante su explotación resultó que la función descrita en la versión anterior no siempre dio el resultado correcto. Por consiguiente, tuvimos que reescribirla. Todo resultó ser mucho más simple que lo anteriormente escrito...
//+------------------------------------------------------------------+
//|                                                     Utilites.mqh |
//+------------------------------------------------------------------+
//...
//+------------------------------------------------------------------+
//| Calculates a distance in pixels between two adjacent bars        |
//+------------------------------------------------------------------+
int        CUtilites::GetBarsPixelDistance(void)
  {
//--- Calculate the distance
   return ((int)MathPow(2,ChartGetInteger(0,CHART_SCALE)));
  }
//...
Niveles horizontales limitados
Vamos a ver cómo eran esos niveles en el apartado anterior. Todo es simple: un trozo de palo de cierta longitud, preferiblemente, con independencia respecto a dónde cliquemos con el ratón. Como se dibuja directamente desde el punto que indica el cursor del ratón, deberemos seleccionar los puntos con un poco más de cuidado que, digamos, para un abanico.
Resulta conveniente que estos niveles tengan una longitud estrictamente (empíricamente) definida en píxeles. Entonces, con diferentes escalas, un número diferente de barras entrará dentro del intervalo de esta línea, lo cual resulta bastante lógico 😉
También queríamos poder dibujar, con la misma escala, una línea de nivel "normal" y otra "estirada".
Esto es lo que ha resultado:
//+------------------------------------------------------------------+
//|                                                     Graphics.mqh |
//+------------------------------------------------------------------+

//+------------------------------------------------------------------+
//| Draws a horizontal level                                         |
//| Parameters:                                                      |
//|   _multiplicator - multiplier for determining the length         |
//|                of the larger level (how many times higher)       |
//+------------------------------------------------------------------+
//---
void CGraphics::DrawHorizontalLevel(
   double _multiplicator // Multiplier for the level length
)
  {
//--- Description of variables
   datetime p2_time;          // Time of point 2
   string Level_Name ="";     // Level name

//Color of the current line (equal to  the general color of the current time interval)
   color Level_Color=CUtilites::GetTimeFrameColor(CUtilites::GetAllLowerTimeframes());
   int window = 0;            // The index of the subwindow in which the line is drawn
   ENUM_LINE_STYLE Current_Style = STYLE_SOLID; // Line style
   int Current_Width=1;                         // Line width
   int level_length = 0;                        // Line length

//--- Get the length (in pixels)
   if(Short_Level_Length_In_Pixels)
     {
      // If EA parameters instruct to measure in pixels,
      level_length = Short_Level_Length_Pix; // ...Use the length from parameters
     }
   else
     {
      // Otherwise the number of candlesticks is specified in parameers
      level_length = Short_Level_Length * CUtilites::GetBarsPixelDistance();
     }

//--- Set level parameters
   if(_multiplicator>1) // If the level is extended
     {
      Level_Name = CUtilites::GetCurrentObjectName(allPrefixes[7]);
      Current_Style = Long_Level_Style;
      Current_Width = Long_Level_Width;
     }
   else                 // An if the level is short
     {
      Level_Name = CUtilites::GetCurrentObjectName(allPrefixes[6]);
      Current_Style = Short_Level_Style;
      Current_Width = Short_Level_Width;
     }

//--- Calculate real coordinates (price and time) for the second point
   p2_time = CUtilites::GetTimeInFuture(CMouse::Time(),level_length*_multiplicator,COUNT_IN_PIXELS);


//--- Draw a line using the known coordinates
   TrendCreate(0,
               Level_Name,
               0,
               CMouse::Time(),
               CMouse::Price(),
               p2_time,
               CMouse::Price(),
               Level_Color,
               Current_Style,
               Current_Width
              );
//---

   ChartRedraw(0);
  }
El primer punto de la línea se consigue con el puntero del ratón. Al calcular el segundo punto, el programa primero elige si el tamaño de la línea cambiará cuando cambie la escala del gráfico y luego calcula en píxeles las coordenadas del segundo punto y las recalcula en precio y tiempo. (Cuando hay una función lista, los cálculos son muy fáciles).
Quedan por añadir los comandos de control al archivo Shortcuts.mqh:
//+------------------------------------------------------------------+
//|                                                    Shortcuts.mqh |
//+------------------------------------------------------------------+

// ...

//--- Draw a short limited level
         if(CUtilites::GetCurrentOperationChar(Short_Level_Key) == lparam)
           {
            m_graphics.DrawHorizontalLevel(1);
           }
//--- Draw an extended limited level
         if(CUtilites::GetCurrentOperationChar(Long_Level_Key) == lparam)
           {
            m_graphics.DrawHorizontalLevel(Long_Level_Multiplicator);
           }
// ...
Como resultado, si el parámetro Short_Level_Length_In_Pixels es verdadero (true), presionando la tecla S (Short) el programa dibujará un palo horizontal con la longitud en píxeles especificada en el parámetro Short_Level_Length_Pix.
Si Short_Level_Length_In_Pixels == false, la longitud del nivel se medirá en velas y se tomará del parámetro Short_Level_Length.
Si presionamos la tecla "L" (Long), la longitud de la línea se duplicará (más concretamente, se multiplicará por el número especificado en el parámetro Long_Level_Multiplicator).
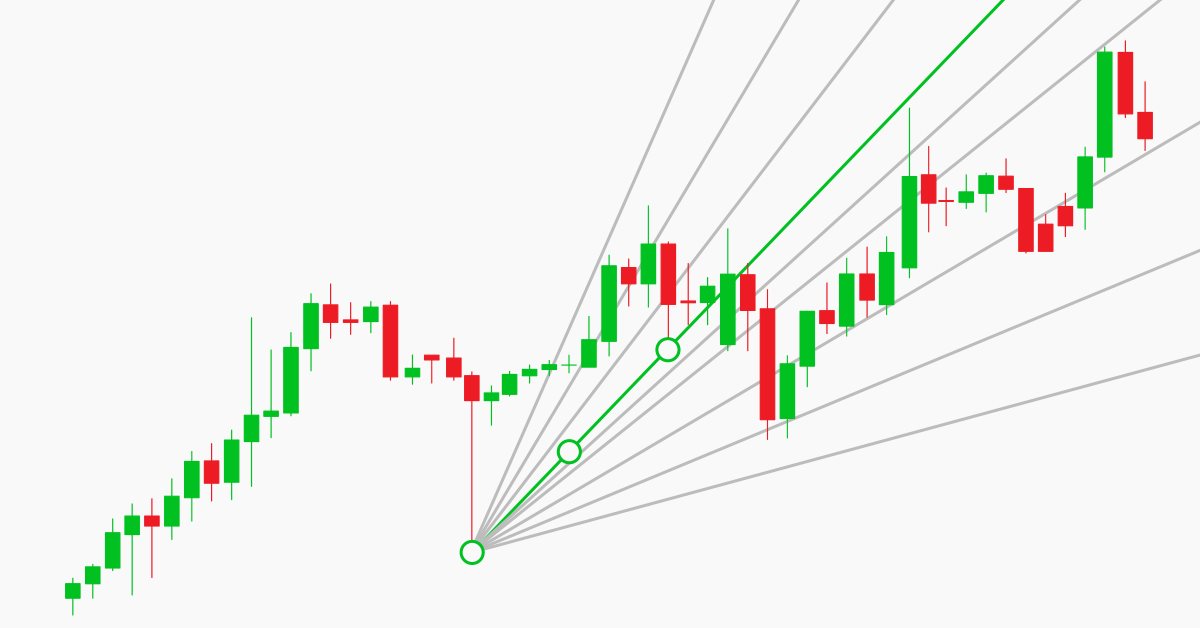
Línea de tendencia limitada
En nuestra opinión, la línea de tendencia puede tener una doble carga.
Por un lado, muestra el límite en la velocidad de cambio del precio ("no más rápido" - si el precio está por debajo de la línea, o "no más lento" - si está por encima).
Por otro lado, si la línea recta está limitada en cuanto a precio y tiempo (es decir, no es un rayo), entonces puede indicar muy bien los niveles (tanto de precio como de tiempo). Obviamente, podríamos utilizar un rectángulo o algo más para estos propósitos, pero, a nuestro juicio, la línea diagonal resulta aún más clara.
Por consiguiente, hemos modificado la función CGraphics::DrawTrendLine. En primer lugar, la línea ahora continúa en el futuro por un periodo de tiempo limitado, lo cual indica el precio estimado. En segundo lugar, y para mayor claridad, hemos añadido los niveles habituales: horizontal y vertical.
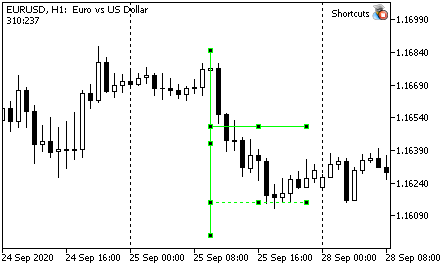
Tienen aproximadamente el aspecto que sigue:

Claro está, la longitud de la línea (cuántas veces mayor es la longitud total respecto a la distancia entre los puntos iniciales), el número de barras para los valores extremos y otras características de la línea recta se configuran en los parámetros del asesor.
//+------------------------------------------------------------------+
//|                                                     Graphics.mqh |
//+------------------------------------------------------------------+

//+------------------------------------------------------------------+
//| Draws a trend line using two nearest extreme points.             |
//|   Extremum length (number of bars on left and right) is set      |
//|   by parameters Fractal_Size_Left and Fractal_Size_Right         |
//|                                                                  |
//| There is a "Trend_Points" variable in the global parameters.     |
//|                                                                  |
//| If the variable value is equal to "TREND_DOTS_EXTREMUMS",        |
//|   end points of the straight line will lie strictly at extrema.  |
//| If the values is "TREND_DOTS_HALF", the line will be             |
//|   extended into the future by a distance of                      |
//|   (p2-p1)*Trend_Length_Coefficient                               |
//+------------------------------------------------------------------+
void              CGraphics::DrawTrendLine(void)
  {
   int dropped_bar_number=CMouse::Bar(); // candlestick number under the mouse
   int p1=0,p2=0;                        // numbers of the first and seconds points
   string trend_name =                   // trend line name
      CUtilites::GetCurrentObjectName(allPrefixes[0],OBJ_TREND);
   double
      price1=0,   // price of the first point
      price2=0,   // price of the second point
      tmp_price;  // variable for temporary storing of the price
   datetime
      time1=0,    // time of the first point
      time2=0,    // time of the second point
      tmp_time;   // a variable to store time


//--- Setting initial parameters
   if(CMouse::Below()) // If a mouse cursor is below the candlestick Low
     {
      //--- Find two extreme points below
      CUtilites::SetExtremumsBarsNumbers(false,p1,p2);

      //--- Determine point prices by Low
      price1=iLow(Symbol(),PERIOD_CURRENT,p1);
      price2=iLow(Symbol(),PERIOD_CURRENT,p2);
     }
   else // otherwise
      if(CMouse::Above()) // If a mouse cursor is below the candlestick High
        {
         //--- Find two extreme points above
         CUtilites::SetExtremumsBarsNumbers(true,p1,p2);

         //--- Determine point prices by High
         price1=iHigh(Symbol(),PERIOD_CURRENT,p1);
         price2=iHigh(Symbol(),PERIOD_CURRENT,p2);
        }
      else
        {
         return;
        }
//--- The time of the first and second points does not depend on the direction
   time1=iTime(Symbol(),PERIOD_CURRENT,p1);
   time2=iTime(Symbol(),PERIOD_CURRENT,p2);

//--- If the line should be extended to the right
   if(Trend_Points == TREND_POINTS_HALF)
     {
      //--- Temporarily save the coordinates of point 2
      tmp_price = price2;
      tmp_time = time2;

      //--- Calculate the time of the second point
      time2 = CUtilites::GetTimeInFuture(time1,(p1-p2)*Trend_Length_Coefficient);

      //--- Calculate the price of the second point
      price2 = NormalizeDouble(price1 + (tmp_price - price1)*Trend_Length_Coefficient,Digits());

      //--- Draw boundary levels by price and time
      DrawSimple(OBJ_HLINE,time2,price2);
      DrawSimple(OBJ_VLINE,time2,price2);
     }

//--- Draw the line
   TrendCreate(0,trend_name,0,
               time1,price1,time2,price2,
               CUtilites::GetTimeFrameColor(CUtilites::GetAllLowerTimeframes()),
               0,Trend_Line_Width,false,true,m_Is_Trend_Ray
              );

//--- Redrawing the chart
   ChartRedraw(0);
  }
Hemos resaltado en color amarillo los principales cambios en el código.
Bueno, y después, todo es simple. El número de barras entre los puntos es igual (р1-р2) (recordemos que los números de las barras se incrementan hacia la derecha); el coeficiente permite calcular cuánto necesitamos prolongar el intervalo, después, simplemente llamamos a la función de utilidad, incluso sin el tercer parámetro, ya que permite por defecto contar las barras.
Luego calculamos el precio, dibujamos los niveles utilizando la función DrawSimple descrita anteriormente (que se encuentra en la misma clase), y dibujamos la línea principal.
Tras leer un código similar, los principiantes a veces quieren saber cómo la función "sabe" dónde añadir el precio: ¿hacia arriba o hacia abajo? Si la línea va de arriba hacia abajo, se debe restar el precio, y si va de abajo hacia arriba, se debe sumar...
Nótese que, como no nos importa si estamos vinculados a los mínimos o los máximos (ya lo verificamos al inicio de la función), la dirección viene determinada exclusivamente por la expresión price1 + (tmp_price - price1).
Si la línea viene de arriba, price1 será mayor que el precio del segundo punto y, por consiguiente, la expresión (tmp_price - price1) será negativa. Entonces, restaremos del precio inicial la distancia que necesitamos.
Si la línea viene de abajo hacia arriba, el precio que define el segundo punto será superior al primero y, por consiguiente, la expresión entre paréntesis será positiva, y la distancia se sumará al precio inicial.
El último matiz de esta función que desearíamos destacar es también una explicación para principiantes. Si los precios se calculan en la función, entonces los datos deberán estar normalizados, es decir, deberemos asegurarnos de que el número que obtengamos contenga el mismo número de decimales que las cotizaciones en el gráfico. De lo contrario, en la mayoría de los casos, el terminal no podrá vender ni comprar. Para esta normalización se usa la función NormalizeDouble.
No será necesario introducir cambios en el archivo Shortcuts.mqh. La línea se sigue dibujando con la tecla "T" (Trend), y para dibujarla, solo necesitamos llamar a la función anterior.
//+------------------------------------------------------------------+
//|                                                    Shortcuts.mqh |
//+------------------------------------------------------------------+

//...
//--- Draw a trend line
         if(CUtilites::GetCurrentOperationChar(Trend_Line_Key) == lparam)
           {
            m_graphics.DrawTrendLine();
           }
//...
Dibujar niveles verticales
Como los mercados son propensos a mostrar tendencias, y el movimiento de precios no es del todo accidental, la mayoría de las veces, podemos utilizar para el comercio la norma que dice que el precio siempre tiende a recorrer la misma distancia que ya ha superado... En qué dirección ya es una cuestión aparte, y para este artículo resulta insignificante. Con frecuencia, rompiendo, digamos, el borde de una barra pin o una vela grande, el precio se mueve la misma distancia que ha sido medida por esta barra, y luego se invierte.
Sin embargo, muchos grandes tráders (que en última instancia determinan la dirección) prefieren salir de una posición un poco antes de que se alcance el nivel del 100%. De esta forma, el precio con frecuencia no alcanza los niveles conocidos por la mayoría, pocas veces, pero aún así...
Por eso, también utilizamos niveles fraccionarios para comerciar. Los niveles 7/8 resultan de ayuda, el resto los usamos mucho menos... Para ver estos niveles en la pantalla, hemos creado la última herramienta analizada en el artículo.
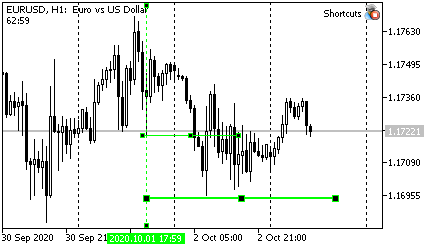
Después de todo esto, la función para dibujar niveles parece completamente trivial.
//+------------------------------------------------------------------+
//|                                                     Graphics.mqh |
//+------------------------------------------------------------------+

//+------------------------------------------------------------------+
//| Draws a vertical line at levels 7/8 and 14/8 of the              |
//|   current candlestick size                                       |
//+------------------------------------------------------------------+
void CGraphics::DrawVerticalLevels(void)
  {
//--- Description of variables
   string
   Current_Vertical_Name =   // The name of the basic vertical line
      CUtilites::GetCurrentObjectName(allPrefixes[5]),
      Current_Level_Name =          // The name of the current level
         CUtilites::GetCurrentObjectName(allPrefixes[5]+"7_8_");
   double
   Current_Line_Lenth,           // The length of the current line (level or vertical)
   Current_Extremum,             // Working extremum (High or Low, depending on the mouse position
   Level_Price,                  // Level price
   High = iHigh(Symbol(),PERIOD_CURRENT,CMouse::Bar()), // The High price of the current candlestick
   Low =  iLow(Symbol(),PERIOD_CURRENT,CMouse::Bar());  // The Low price of the current candlestick
   int
   direction=0;                  // Price increment sign
   long timeframes;                 // List of working timeframes
   datetime
   Current_Date =                // Time of the current bar
      iTime(Symbol(),PERIOD_CURRENT,CMouse::Bar()),
      Right_End_Time =              // Time of the right border of the level
         CUtilites::GetTimeInFuture(Current_Date,Short_Level_Length);

//--- Calculating candlestick length
   Current_Line_Lenth = (High-Low)*2;

//--- Initialization of the main variables depending on the desired drawing direction
   if(CMouse::Above()) // If the mouse is above
     {
      Current_Extremum = High;   // The main price is High
      direction = -1;            // Drawing direction - downward
     }
   else              // Otherwise
     {
      if(CMouse::Below()) // If the mouse is below
        {
         Current_Extremum = Low; // The main price is Low
         direction = 1;          // Drawing direction is upward
        }
      else         // If the mouse is in the middle of the candlestick, exit
        {
         return;
        }
     }

//--- Vertical line
   TrendCreate(0,
               Current_Vertical_Name,
               0,
               Current_Date,
               Current_Extremum,
               Current_Date,
               Current_Extremum+(Current_Line_Lenth*2)*direction,
               CUtilites::GetTimeFrameColor(CUtilites::GetAllLowerTimeframes()),
               Vertical_With_Short_Levels_Style,
               Vertical_With_Short_Levels_Width
              );
//--- First level (7/8)
   Level_Price = Current_Extremum+(Current_Line_Lenth*Vertical_Short_Level_Coefficient)*direction;
   TrendCreate(0,
               Current_Level_Name,
               0,
               Current_Date,
               Level_Price,
               Right_End_Time,
               Level_Price,
               CUtilites::GetTimeFrameColor(CUtilites::GetAllLowerTimeframes()),
               Short_Level_7_8_Style,
               Short_Level_7_8_Width
              );
//--- Second level (14/8)
   Current_Level_Name = CUtilites::GetCurrentObjectName(allPrefixes[5]+"14_8_");
   Level_Price = Current_Extremum+(Current_Line_Lenth*2*Vertical_Short_Level_Coefficient)*direction;
   TrendCreate(0,
               Current_Level_Name,
               0,
               Current_Date,
               Level_Price,
               Right_End_Time,
               Level_Price,
               CUtilites::GetTimeFrameColor(CUtilites::GetAllLowerTimeframes()),
               Short_Level_14_8_Style,
               Short_Level_14_8_Width
              );
  }
Prestaremos atención a dos puntos. En primer lugar, siempre calculamos el tiempo de estos niveles por barras. El número requerido de barras se toma de la variable Short_Level_Length, por consiguiente, siempre sabremos cuántas barras se medirán.
En segundo lugar, aquí tenemos que calcular el precio usando un solo punto como base. Por ello, es necesario establecer parámetros específicos de dirección, para que no debamos comprobar y escribir cada vez el doble de código. En concreto, especificaremos el parámetro direction por el que es multiplicado cada término, excepto el primer punto. De esta manera, nos las arreglaremos nuevamente con una expresión que describe el comportamiento de la línea, pero el signo de los términos en esta expresión dependerá de dónde se encuentre el ratón: por encima o por debajo de la vela...
La forma final se parece a la mostrada en la figura.
En el archivo Shortcuts.mqh, añadimos la estructura de control:
//+------------------------------------------------------------------+
//|                                                    Shortcuts.mqh |
//+------------------------------------------------------------------+

//...
//--- Draw a vertical line with 7/8 levels
         if(CUtilites::GetCurrentOperationChar(Vertical_With_Short_Levels_Key)  == lparam)
           {
            m_graphics.DrawVerticalLevels();
           }
         break;
Tecla para el dibujado - V (Vertical).
Teclas utilizadas en la actual implementación de la biblioteca
| Acción | Tecla | De la palabra en inglés |
|---|---|---|
| Ir al marco temporal superior por los periodos principales (del panel de periodos) | U | Up |
| Ir al marco temporal inferior | D | Down |
| Alternar el nivel Z del gráfico (gráfico encima o debajo de los objetos) | Z | Z-order |
| Dibujar una línea de tendencia inclinada según los dos extremos unidireccionales más próximos al ratón | T | Trend line |
| Alternar el modo de rayo para las nuevas rectas | R | Ray |
| Dibujar una línea vertical simple | I(i) | [Only visual vertical] |
| Dibujar una línea horizontal simple | H | Horizontal |
| Dibujar un conjunto de tridentes de Andrews | P | Pitchfork |
| Dibujar un abanico de Fibonacci (VFun) | F | Fun |
| Dibujar un nivel horizontal corto | S | Short |
| Dibujar un nivel horizontal largo | L | Long |
| Dibujar una línea vertical con las marcas de los niveles | V | Vertical |
Conclusión
Como muchos otros, esperamos que el artículo le sea útil al lector, pero no podemos garantizar nada en absoluto :-) La herramienta ha resultado muy flexible, adecuada para trabajar en cualquier mercado con el que hayamos topado personalmente, pero si todos los lectores lo usan con la configuración predeterminada, probablemente algunos mercados puedan cambiar... Probablemente no lo hagan de una forma demasiado significativa, porque el cambio es la esencia del mercado...
Escriba comentarios y mensajes personales, no quedarán sin leer; no obstante, nuevamente, el autor no garantiza que lo haga de inmediato.
¡Que obtenga usted beneficios estables!
Traducción del ruso hecha por MetaQuotes Ltd.
Artículo original: https://www.mql5.com/ru/articles/7908
Advertencia: todos los derechos de estos materiales pertenecen a MetaQuotes Ltd. Queda totalmente prohibido el copiado total o parcial.
Este artículo ha sido escrito por un usuario del sitio web y refleja su punto de vista personal. MetaQuotes Ltd. no se responsabiliza de la exactitud de la información ofrecida, ni de las posibles consecuencias del uso de las soluciones, estrategias o recomendaciones descritas.

 Enfoque ideal sobre el desarrollo y el análisis de sistemas comerciales
 Redes neuronales: así de sencillo (Parte 6): Experimentos con la tasa de aprendizaje de la red neuronal
 Aplicación práctica de las redes neuronales en el trading. Python (Parte I)
 Cuadrícula y martingale: ¿qué son y cómo usarlos?
- Aplicaciones de trading gratuitas
- 8 000+ señales para copiar
- Noticias económicas para analizar los mercados financieros
Usted acepta la política del sitio web y las condiciones de uso
Hay algunos problemas con los símbolos de espacio en los comentarios... Intenta eliminar los espacios entre variables y comentarios en aquellas cadenas donde el compilador escribe "Declaración sin tipo". La versión correcta del archivo fue enviada al moderador, así que supongo que la adjuntará al artículo tan pronto como pueda.
compilado despues de quitar espacios/comentarios - gracias
Hola Oleh
parece que esto es lo que estaba buscando
pero no puede instalar los archivos
he insertado los archivos de la carpeta de accesos directos a las carpetas de secuencias de comandos, expertos e incluyen
y no funciona todavía.
¿hay alguna instrucción sobre cómo instalarlos correctamente?
Hola Oleh
...¿hay alguna instrucción sobre cómo instalarlos correctamente?
No hay nada especial.
En el archivo hay dos carpetas: MQL4 y MQL5.
Como de costumbre, copie uno dependiendo de su versión en su carpeta de datos MQL (Archivo -> Abrir carpeta de datos) y luego reinicie el terminal (o seleccione Herramientas -> MetaQuotes Languge Editor y compile el archivo Experts\Shortcuts\Shortcuts.mq*).
Vuelva a la terminal y poner experto en el gráfico necesario.
P.S. Si utiliza scripts del primer artículo y prefiere compilar expert "a mano", necesita compilar cada script también.
¡Hola!
Cambio los parámetros para los colores de las líneas en el archivo GlobalVariables, lo compilo, ejecuto el EA, pero los colores siguen siendo los mismos al crear una nueva línea. ¿Qué estoy haciendo mal?
¡Hola!
Cambio los parámetros para los colores de las líneas en el archivo GlobalVariables, lo compilo, ejecuto el EA, pero los colores siguen siendo los mismos al crear una nueva línea. ¿Qué estoy haciendo mal?