Bandas Moveis Trianguladas

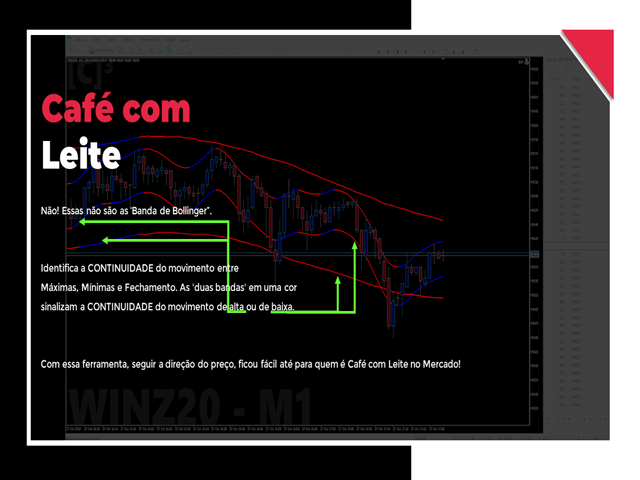
No! These are not the 'Bollinger Band'.

Identifies the CONTINUITY of the movement between High, Low and Closing. The 'two bands' in one color signal the CONTINUITY of bull or bear movement. With this tool, following the price direction, it was easy even for those who are Café com Leite in the Market!

Remember if:
All our tools work together, exclusive indicators and risk management robot.

They automatically identify the different patterns in the Mini-Index dynamics as well as manage our operations. And based on them, we calculate the future movements of the Mini-Index and apply our capital management.
Recommended products
place a vwap line starting from the line placed on the chart parameters: tick_mode: enable to use ticks instead of bars. this uses a lot more cpu processing power prefix: prefix to add for line created by indicator line_color: set the color of the line created line_style: set the line style of the line created applied_price: set the price of bar to use of the bar std_dev_ratio: set the multiplier for the std dev channel
The indicator determines the state of the market: trend or flat. The state of the market is determined by taking into account volatility. The flat (trading corridor)is displayed in yellow. The green color shows the upward trend. The red color shows the downward trend. The height of the label corresponds to the volatility in the market. The indicator does not redraw . Settings History_Size   - the amount of history for calculation. Period_Candles  - the number of candles to calculate the indicat
HV Models
Andrey Azatskiy
HV Models is an Indicator that containes 4 methods for calculating historical volatility of the selected asset. Volatility is one of the fundamental values ​​describing changes in the underlying asset. In statistics, it usualy describes as a standard deviation. The price chart has 4 values ​​(Open High Low Close) when we calculate volatility using a standard indicator, only one of these values ​​is used as a result we get one-sided volatility picture. The presented indicator uses 4 volatility ca
Delta B3 ATR Renko Scalper é um robô especialista para negociação na Bolsa Brasileira B3 , em contratos de mini índice WIN e mini dólar WDO. O robô é programado para utilizar os cálculos Renko como análise de tendência e também como sinal de entrada, podendo operar como scalper , emitindo diversas ordens ( CUIDADO com os lotes e número de ordens!). O tamanho do Renko pode ser fixo ou variável de acordo com o indicador ATR (Average True Range) , possibilitando maior dinamismo ao robô. Os stops (
Trading Guide — Heatmap Volume BarColor What Is This Indicator? Group support:  https://www.mql5.com/en/channels/vuongphamtrading Heatmap Volume BarColor is a companion indicator that paints your candlesticks directly on the main chart based on volume intensity. It uses the exact same logic as the Heatmap Volume indicator (separate window) but applies the color-coding to the candles themselves. Instead of looking down at the volume window, you can read volume strength at a glance right on the pr
FREE
"Pattern 123" is an indicator-a trading system built on a popular pattern, pattern 123. This is the moment when we expect a reversal on the older trend and enter the continuation of the small trend, its 3rd impulse. The indicator displays signals and markings on an open chart. You can enable/disable graphical constructions in the settings. The indicator has a built-in notification system   (email, mobile terminal, standard terminal alert). "Pattern 123" has a table that displays signals from se
This is Gekko's Bollinger Bands indicator. It extends the use of the famous Bollinger Bands and calculates strong entry and exit signals using price action on the edge and on the middle bands. You can set it up in many different ways, eg: pullback, pullback against trend, middle band crossing and middle band crossing against trend. Inputs Number of Bars to Plot Indicator:  number of historical bars to plot the indicator, keep it low for better performance; Produces Signal Only When a Bar Closes:
Three Candles Pattern
Edson Cavalca Junior
5 (1)
The patterns of 3 (three) Candles: Three White Soldiers; Three Black Crows; These are reversal patterns widely used by traders, as they have a high probability of showing the inversion of the current market movement. For example, if in a bullish trend there are three black crows, there is a high probability of reversing the current bullish movement. The Three White Soldiers have the following characteristics: There are 3 consecutive candles with a good body, that is, the difference between th
This Simple Smart Money Concepts indicator displays real-time market structure (internal & swing BOS / CHoCH), order blocks, premium & discount zones, equal highs & lows, and much more...allowing traders to automatically mark up their charts with widely used price action methodologies. "Smart Money Concepts" (SMC) is used term amongst price action traders looking to more accurately navigate liquidity & find more optimal points of interest in the market. Trying to determine where institutional
This Indicator adding power to traditional zigzag indicator. With High-Low numbers in vision it will be easier to estimate change of trend by knowing the depth of each wave. Information including points, pips, percentage%, and #bars can be displayed based on configuration. All information is real-time update. This indicator is especially useful in sideway market to buy low sell high.
This product is designed for the MT5 platform and offers two key features: VWAP (Volume Weighted Average Price) calculation and Volume Profile analysis. Advantages: VWAP Calculation: The product calculates the VWAP, which is a popular indicator used by traders to determine the average price of a security based on its trading volume. It helps identify potential buying or selling opportunities by comparing the current price to the average price weighted by volume. Volume Profile Analysis: The prod
The Range Filtered AlgoAlpha is a technical analysis tool designed to help identify potential trading opportunities by analyzing market volatility. This Metatrader adaptation of AlgoAlpha's original TradingView indicator combines several analytical methods to provide visual market assessments. Technical Features Utilizes Kalman filtering for price smoothing Incorporates ATR-based bands for volatility measurement Includes Supertrend elements for trend analysis Provides visual signals through col
RAD CRITICAL LEVES RAD indicator tracks “Relevant Volume” in real time, identifying accumulation and distribution processes, projecting them in the chart as SUPPORT or RESISTANCE zones. Natural   support   and resistance levels are generated by Volume Accumulation and Distribution processes. As these processes evolve, levels at which the relevant volume in the market place is positioned, become difficult areas to cross upwards or downwards. By using this information, traders can identify very s
**Volume Trend Navigator** is a modern volume-based trend indicator that spots when market momentum is accelerating or fading by analyzing volume and recent price swings over three bars: * **Bullish acceleration**: Draws an ↑ arrow when the current bar’s volume exceeds that of the two preceding bars **and** price closes above the previous bar’s high—signaling a strengthened up-trend. * **Bearish acceleration**: Draws a ↓ arrow when the current bar’s volume exceeds that of the two preceding bar
1. Description (The Sales Pitch) Never miss a trade setup again!   Timing is everything in forex and stock trading. The   Precision Candle Timer   for MT5 is a lightweight, professional-grade tool designed to show you exactly how much time is left before the current candle closes. Unlike other clunky timers that clutter your screen, this indicator sits elegantly right next to the current price action, ensuring your eyes stay on the market. Key Features: Real-time Countdown:   High-precision cou
FREE
QuantumLogic AI
Silvano Cesar Silva Vieira
QuantumLogic AI QuantumLogic AI is a highly sophisticated Expert Advisor designed for institutional-grade algorithmic trading. It utilizes a dynamic cost-averaging strategy (Grid) combined with an ultra-fast asynchronous block closing system (Basket). Developed for traders who demand absolute control over market exposure, it incorporates advanced time management and dynamic risk containment protocols. STRATEGY OVERVIEW The EA filters market direction using a Moving Average baseline and execute
MT4 version -   https://www.mql5.com/ru/market/product/69932 Unlike other indicators of this type, this version has: The ability to display data from smaller timeframes on the current chart. For example, displaying data from the M1 period on the H1 chart. Calculation of values ​​using the Gaussian formula (normal distribution formula). Flexible system of settings. Settings: basePeriod   - base period. indicatorMode  - display mode. Sets the value of each interval:   by4h   (4 hours),   by6h  
Keltner Channels (ou   Canais de Keltner ) é mais um indicador de   volatilidade   utilizado pela   análise técnica. Também chamado de   envelope , esse canal foi criado por Chester Keltner para monitorar os seus investimentos no mercado futuro de café na década de 1960. Porém, com o passar do tempo, passou também a ser utilizado para outros ativos e, atualmente, é uma das ferramentas mais utilizadas pelos traders. Nesta versão customizada foram adicionados novas opções de método de média movel
Smart Candle
Wanchai Phonphromchot
Introduction This EA is designed to survive the one-year testing period with a low drawdown and a high Sharpe ratio. The calculation concepts are new, but they are easily understood. Here are the best results. On the test period of 1 year (Jan 2023 - Jan 2024), the profit at the end is about 900% of the initial deposit with a maximum drawdown of 22%, and the Sharpe ratio is greater than 3.74. (Results tested on version V1.4) Note that the 22% drawdown mentioned above is the result from the stra
Yawabeh SD Pro –  Professional Supply and Demand Indicator Trade Smarter with Volume-Confirmed Supply/Demand Zones Our institutional-grade algorithm identifies high-probability reversal zones before price reacts, giving you the edge in Forex, Crypto, and Stocks. Key Features Multi-Timeframe Confirmation – View trend strength across multiple timeframes simultaneously – Align your trades with higher timeframe momentum Smart Alert System – Real-time notifications for: – Strong demand/supply zone
Daily Volume Profile - See Where Smart Money Trades Stop guessing support and resistance. Start seeing where REAL volume is. The Daily Volume Profile indicator reveals the hidden structure of the market by showing exactly where trading activity concentrates at each price level. While most traders use lagging indicators, you'll see where institutional money positions itself - BEFORE the move happens. What You Get: → POC (Point of Control) - The most powerful S/R level of each day, shown as a cle
Extremums Hybrid
Tatiana Savkevych
Extremums Hybrid — High-Precision Structural Analysis Tool Extremums Hybrid is a professional-grade analytical indicator designed to identify key market reversal points and structural shifts with institutional precision. Unlike standard zigzag indicators, it utilizes a hybrid filtering logic that combines price action , volatility (ATR) , and volume (VSA) . Key Features Adaptive Extremum Detection: Uses a dynamic lookback period to filter out market noise and focus on significant highs and lows.
Phantom Edge SMC
Nattapon Chuekamhod
Phantom Edge SMC — The Ultimate Smart Money Indicator for MT5 Tired of manually drawing structures while trading SMC or ICT concepts? Let Phantom Edge SMC do the heavy lifting for you. Key Features Internal & Swing Structure: Automatically detects BOS and CHoCH across two structural levels. Order Blocks (OB): Identifies Internal and Swing OBs with automated mitigation tracking. Equal Highs / Lows: Highlights EQH / EQL to pinpoint Liquidity pools. Fair Value Gaps (FVG): Displays FVGs with
WAPV Box Effort x Result
Eduardo Da Costa Custodio Santos
WA_PV_BOX_EFFORT X RESULT for MT5 The WAPV Box Effort x Result Indicator is part of the Package Indicators group (Wyckoff Academy Wave Market). The WAPV Box Effort x Result Indicator for MT5 helps you in reading price and volume. Its reading consists of assisting in the identification of effort x result in waves created by the graph. The WAPV Box Effort x Result Indicator for MT5 when the box is green means that the volume is in favor of the demand and when the box is red volume is in favor of s
Marcon s Deviation
Luiz Antonio De Sousa Marcon
DESVIO DE MARCON  (Desvio Dinâmico de VWAP) O Desvio de Marcon é um indicador desenvolvido com o intuito de fornecer ao TRADER uma ferramenta capaz de antecipar pontos relevantes de suporte e resistência através de canais de desvios de VWAP traçados no gráfico.  Mas qual a diferença entre o Desvio de Marcon e os canais de desvio padrão da VWAP já existentes? O Desvio de Marcon utiliza um algoritmo estatístico desenvolvido por Luiz Antonio de Sousa Marcon, que lhe dá a capacidade de se auto calib
Trend change detector is an indicator for Metatrader 5.It can help you determine the change in a local trend to open a correct position. It has 2 parameters. Period and mistake offset percent. You can change the period parameter to capture little changes in trend.  There are two lines: the red one and the green one. You can use them as a local support and resistance level. Arrows show the change in a trend. Up arrow the price will go down and Down arrow the price will go up. Also, by changing m
Multi-Timeframe Money Flow Index (MTF MFI) with Smart Divergence and Dashboard Unlock the flow of institutional money across every timeframe. Are you tired of guessing the trend only to be trapped by a sudden reversal? The Multi-Timeframe Money Flow Index (MTF MFI) is a professional-grade trading tool designed to provide a bird's-eye view of market liquidity and momentum. By aggregating volume-weighted data from W1 down to M1, this indicator eliminates noise and highlights high-probability tra
FuTuRe 01 Phi Cubic Fractals Pack1
Claudio De Carvalho Aguiar
5 (1)
This product contains following indicators: (Lines + LineSAR + Channels + BTL + Ladder) Phi Lines  - special EMAs, similar to MIMAs from Phicube; Phi LineSAR  - erase and highlight Phi Lines in support or resistance. Similart to MIMASAR from Phicube; Phi Channels  - show support and resistance, similar to Phibo from Phicube (Green and Read Lines); Phi BTL  - candles color following Phi Lines alignment; Phi LADDER  - Indicator that allow you to visualize possible targets.  FUTURO Tool Future too
The most important price level in any "Volume profile" is the "Point of Control" . This is the price level with the highest trading volume. It is primarily the level where large players initiate their positions, making it the accumulation/distribution level for the "Smart money" . The idea of the indicator arose after the "MR Volume Profile 5" indicator was made. When creating the "MR Volume Profile 5" indicator, we spent a lot of time comparing the volumes with those from the volume profile in
Overview Donchian Long Edge is a modern take on Richard Donchian’s classic channel breakout strategy — adapted specifically for long-only momentum and reversal entries. It combines the proven logic of Donchian breakouts with ATR-based buffers, rearm logic, and session-aware filters. The indicator highlights buy signals only , designed for trend-following and range-reversal trading approaches. This version introduces session start/end markers and time-based signal filtering , making it especially
Buyers of this product also purchase
SignalTech MT5 is a trading system for EURUSD, USDCHF, USDJPY, AUDUSD, NZDUSD, EURJPY, AUDJPY, NZDJPY, CADJPY H2 and H3 Timeframe.  All the winning trades with chart setups are published on the comments page. 2025-12 1174 Pips 2026-01 2624 Pips 2026-02 2937 Pips 2026-03 2165 Pips 2026-04 2243 Pips It can generate signals with Buy/Sell Arrows and Pop-Up/Sound Alerts. Each signal has clear Entry and Stop Loss levels, which should be automatically flagged on the chart, as well as potential Targets
Divergence Bomber
Ihor Otkydach
4.9 (87)
Each buyer of this indicator also receives the following for free: The custom utility "Bomber Utility", which automatically manages every trade, sets Stop Loss and Take Profit levels, and closes trades according to the rules of this strategy Set files for configuring the indicator for various assets Set files for configuring Bomber Utility in the following modes: "Minimum Risk", "Balanced Risk", and "Wait-and-See Strategy" A step-by-step video manual to help you quickly install, configure, and s
Grabber System MT5
Ihor Otkydach
4.83 (23)
Let me introduce you to an excellent technical indicator – Grabber, which works as a ready-to-use "All-Inclusive" trading strategy. Within a single code, it integrates powerful tools for technical market analysis, trading signals (arrows), alert functions, and push notifications. Every buyer of this indicator also receives the following for free: Grabber Utility for automatic management of open orders Step-by-step video guide: how to install, configure, and trade with the indicator Custom set fi
Btmm state engine pro
Garry James Goodchild
5 (4)
BTMM State Engine Pro is a MetaTrader 5 indicator for traders who use the Beat The Market Maker approach: Asian session context, kill zone timing, level progression, peak formation detection, and a multi-pair scanner from a single chart. It combines cycle state logic with a built-in scanner dashboard so you do not need the same tool on many charts at once. What it does Draws the Asian session range; session times can follow broker server offset or be set in inputs. Tracks level progression (L
Quantum TrendPulse
Bogdan Ion Puscasu
5 (23)
Introducing Quantum TrendPulse , the ultimate trading tool that combines the power of SuperTrend , RSI , and Stochastic into one comprehensive indicator to maximize your trading potential. Designed for traders who seek precision and efficiency, this indicator helps you identify market trends, momentum shifts, and optimal entry and exit points with confidence. Key Features: SuperTrend Integration: Easily follow the prevailing market trend and ride the wave of profitability. RSI Precision: Detect
Meridian Pro
Ottaviano De Cicco
5 (1)
Meridian Pro 2.00: Professional Multi-Timeframe Trend Matrix for MT5 Meridian Pro 2.00 is a professional adaptive trend matrix for MetaTrader 5. It combines the original Meridian trend engine, a clean chart ribbon, closed-bar signal arrows, an 8-timeframe dashboard, Fuel momentum, weighted consensus, synthetic HTF processing and chart-native higher-timeframe context lines. The goal is simple: read current trend, multi-timeframe structure, strength, momentum and EA-ready state from one discipline
Introducing   Quantum Breakout PRO , the groundbreaking MQL5 Indicator that's transforming the way you trade Breakout Zones! Developed by a team of experienced traders with trading experience of over 13 years,   Quantum Breakout PRO   is designed to propel your trading journey to new heights with its innovative and dynamic breakout zone strategy. Quantum Breakout Indicator will give you signal arrows on breakout zones with 5 profit target zones and stop loss suggestion based on the breakout b
Azimuth Pro
Ottaviano De Cicco
5 (7)
Azimuth Pro V2: Synthetic Fractal Structure and Confirmed Entries for MT5 Overview Azimuth Pro is a multi-level swing structure indicator by Merkava Labs . Four nested swing layers, swing-anchored VWAP, ABC pattern detection, three-timeframe structural filtering, and closed-bar confirmed entries — one chart, one workflow from micro-swings to macro-cycles. This is not a blind signal product. It is a structure-first workflow for traders who care about location, context, and timing. V2 Launch Offe
First of all Its worth emphasizing here that this Trading Tool is Non Repainting , Non Redrawing and Non Lagging Indicator , Which makes it ideal for professional trading . [Online course] ,   and   [manual] The Smart Price Action Concepts Indicator is a very powerful tool for both new and experienced traders . It packs more than 20 useful indicators into one , combining advanced trading ideas like Inner Circle Trader Analysis and Smart Money Concepts Trading Strategies . This indicator focuses
OmniSync Projection
Antonio-alin Teculescu
5 (1)
Chronos Fractal Engine is an innovative price projection indicator for MetaTrader 5, designed to transform your technical analysis by intelligently identifying and projecting historical price patterns. Built upon an advanced correlation algorithm and the fractal principles of the market, this powerful tool visualizes potential future price movements, giving you a unique edge in your trading decisions. What is Chronos Fractal Engine? At its core, the Chronos Fractal Engine employs a sophisticat
RelicusRoad Pro: Quantitative Market Operating System 70% OFF LIFETIME ACCESS (LIMITED TIME) - JOIN 2,000+ TRADERS Why do most traders fail even with "perfect" indicators? Because they trade Single Concepts in a vacuum. A signal without context is a gamble. To win consistently, you need CONFLUENCE . RelicusRoad Pro is not a simple arrow indicator. It is a complete Quantitative Market Ecosystem . It maps the "Fair Value Road" price travels on, distinguishing between random noise and true structur
Top indicator for MT5   providing accurate signals to enter a trade without repainting! It can be applied to any financial assets:   forex, cryptocurrencies, metals, stocks, indices .  Watch  the video  (6:22) with an example of processing only one signal that paid off the indicator! MT4 version is here It will provide pretty accurate trading signals and tell you when it's best to open a trade and close it. Most traders improve their trading results during the first trading week with the help of
ARICoins
Temirlan Kdyrkhan
ARICoin is a powerful trading companion designed to generate high-probability entry signals with dynamic TP/SL/DP levels based on volatility. Built-in performance tracking shows win/loss stats, PP1/PP2 hits, and success rates all updated live. Key Features: Buy/Sell signals with adaptive volatility bands Real-time TP/SL/DP levels based on ATR Built-in MA Filter with optional ATR/StdDev volatility Performance stats panel (Success, Profit/Loss, PP1/PP2) Alerts via popup, sound, push, or email Cust
KT Alpha Hunter Arrows MT5
KEENBASE SOFTWARE SOLUTIONS
Most arrow indicators give you a signal and leave you to figure out the rest. KT Alpha Hunter Arrows gives you the full trading plan. Every signal arrow prints with a full plan already drawn: entry line, stop-loss, four take-profit levels, and a live edge verdict telling you whether this symbol and time-frame is worth trading right now. An included Trade Manager EA handles the execution after you enter, so discipline stays intact when the market gets loud. Non-repaint. Closed-bar signals only. B
Advanced Supply Demand MT5
Bernhard Schweigert
4.53 (15)
Best Solution for any Newbie or Expert Trader! This indicator is a unique, high quality and affordable trading tool because we have incorporated a number of proprietary features and a new formula. With this update, you will be able to show double timeframe zones. You will not only be able to show a higher TF but to show both, the chart TF, PLUS the higher TF: SHOWING NESTED ZONES. All Supply Demand traders will love it. :) Important Information Revealed Maximize the potential of Advanced Supply
Current event:  https://c.mql5.com/1/326/A2SR2025_NoMusic.gif A2SR for MT5 Automated Actual Support & Resistance + Trading Instruments. --   Guidance   : -- at   https://www.mql5.com/en/blogs/post/734748/page4#comment_16532516 -- and  https://www.mql5.com/en/users/yohana/blog    Powerful, Genuine, and Time-Saving For Smarter Trading Decision     +  EA-Compatible Objects . Key Advantages Leading Actual SR Levels (Not Lagging, Not Repainting) After years of proven reliability on MT4 since 20
Trend Lines PRO MT5
Roman Podpora
5 (1)
TREND LINES PRO  -   helps understand where the market is truly changing direction. The indicator shows real trend reversals and points where major players re-enter. You see   BOS lines   Trend changes and key levels on higher timeframes — without complex settings or unnecessary noise. Signals don't repaint and remain on the chart after the bar closes. MT4 VERSION   - Reveals its maximum potential when combined with the   RFI LEVELS PRO   indicator What the indicator shows: Real shifts   trend
Bill Williams Advanced
Siarhei Vashchylka
5 (11)
Bill Williams Advanced is designed for automatic chart analysis using Bill Williams' "Profitunity" system. The indicator analyzes four timeframes at once. Manual (Be sure to read before purchasing) Advantages 1. Analyzes the chart using Bill Williams' "Profitunity" system. Signals are displayed in a table in the corner of the screen and on the price chart. 2. Finds all known AO and AC signals, as well as zone signals. Equipped with a trend filter based on the Alligator. 3. Finds "Divergence Bar
Meravith MT5
Ivan Stefanov
5 (1)
MERAVITH provides complete liquidity map of the analyzed market. Hedge funds tool. It performs all calculations automatically using a proprietary volume-weighted average price methodology, eliminating subjective interpretation entirely. Meravith will: Analyze all timeframes and display the current trend in force. Highlight liquidity zones (volume equilibrium) where bullish and bearish volumes are equal. Display all liquidity levels across different timeframes directly on your chart. Generate an
Fusion Monthly Levels + PinBar + Marubozu Description This unique indicator merges three powerful technical analysis tools into one: Monthly Levels (High, Low, Open, Close) – to identify key support and resistance zones. PinBar Detection – a reliable reversal candlestick pattern signaling price rejections. Marubozu Detection – strong trending candles that indicate directional momentum. Thanks to this fusion, you get a visual, comprehensive, and responsive tool to anticipate market moves.
Berma Bands
Muhammad Elbermawi
5 (8)
The Berma Bands (BBs) indicator is a valuable tool for traders seeking to identify and capitalize on market trends. By analyzing the relationship between the price and the BBs, traders can discern whether a market is in a trending or ranging phase. Visit the [ Berma Home Blog ] to know more. Berma Bands are composed of three distinct lines: the Upper Berma Band, the Middle Berma Band, and the Lower Berma Band. These lines are plotted around the price, creating a visual representation of the pric
Gartley Hunter Multi
Siarhei Vashchylka
5 (11)
Gartley Hunter Multi - An indicator for searching for harmonic patterns simultaneously on dozens of trading instruments and on all possible timeframes. Manual (Be sure to read before purchasing) | Version for MT4 Advantages 1. Patterns: Gartley, Butterfly, Shark, Crab. Bat, Alternate Bat, Deep Crab, Cypher 2. Simultaneous search for patterns on dozens of trading instruments and on all possible timeframes 3. Search for patterns of all possible sizes. From the smallest to the largest 4. All fou
Weltrade Spike Sentinel
Batsirayi L Marango
5 (1)
Introducing Indicator for PainX and GainX Indices Traders on Weltrade Get ready to experience the power of trading with our indicator, specifically designed for Weltrade   broker's PainX and GainX Indices.  Advanced Strategies for Unbeatable Insights Our indicator employs sophisticated strategies to analyze market trends, pinpointing optimal entry and exit points.  Optimized for Maximum Performance To ensure optimal results, our indicator is carefully calibrated for 5-minute timeframe charts on
CRT Multi-Timeframe Market Structure & Liquidity Sweep Indicator Non-Repainting | Multi-Asset | MT4 Version Available MT4 Version: https://www.mql5.com/en/market/product/162556 Full Setup Guide: https://www.mql5.com/en/blogs/post/767525 Indicator Overview CRT Ghost Candle HTF Fractal is a complete institutional-grade market structure toolkit for MetaTrader 5. It projects higher-timeframe candle structure, CRT trap levels, session levels, previous period highs and lows, pivot points, and a real
CGE Trading Suite
Carl Gustav Johan Ekstrom
5 (2)
Institutional-Grade Analytics for MT5 C GE Trading Suite delivers the analytical edge typically reserved for professional trading desks. The platform integrates a full suite of analytical tools into one seamless workflow: dynamic grid mapping, liquidity behavior analysis, ECM, trend lines, MIDAS, trade cycles, and directional channel projections. Together, these provide a unified view of market structure and momentum. Directional clarity is further enhanced by the capital flow index, which meas
AriX
Temirlan Kdyrkhan
1 (4)
AriX Indicator for MT5 A powerful trend-following and signal-evaluation tool AriX is a custom MT5 indicator that combines Moving Averages and ATR-based risk/reward logic to generate clear buy/sell signals. It visualizes dynamic SL/TP levels, evaluates past trade outcomes, and displays win/loss statistics in a clean on-chart panel. Key features include: Buy/Sell signals based on MA crossovers ATR-based SL/TP1/TP2/TP3 levels with visual lines and labels Signal outcome tracking with real-time stat
The Propfolio Master Suite is the ultimate all-in-one analytical workstation for professional traders. Combining the power of the Beat The Market Maker (BTMM) methodology, Smart Money Concepts (SND/Liquidity), and Advanced Volume Profile, this suite replaces a dozen different indicators with one heavily optimized, beautifully designed engine. Monitor up to 14 pairs simultaneously from a single chart, instantly identify market cycles, and seamlessly map institutional footprints with the click of
The " Dynamic Scalper System MT5 " indicator is designed for the scalping method of trading within trend waves. Tested on major currency pairs and gold, compatibility with other trading instruments is possible. Provides signals for short-term opening of positions along the trend with additional price movement support. The principle of the indicator. Large arrows determine the trend direction. An algorithm for generating signals for scalping in the form of small arrows operates within trend wav
Daily Zone Breaker
Alex Amuyunzu Raymond
5 (1)
Daily Zone Breaker - MT5 Indicator  Overview Daily Zone Breaker is an advanced multi-kernel regression indicator that identifies critical price zones and breakthrough moments with surgical precision. Using sophisticated kernel smoothing algorithms, it filters out market noise to reveal true directional momentum and key trading zones where price is most likely to break through resistance or support levels.  What It Does Core Functionality Daily Zone Breaker analyzes price action through 17 differ
RFI levels PRO MT5
Roman Podpora
3.67 (3)
The indicator accurately shows the reversal points and price return zones where the   Major players . You see where new trends are forming and make decisions with maximum precision, maintaining control over every trade. VERSION MT4     -    Reveals its maximum potential when combined with the   TREND LINES PRO   indicator What the indicator shows: Reversal structures and reversal levels with activation at the beginning of a new trend. Display of   TAKE PROFIT   and   STOP LOSS   levels with min
More from author
Volume Breakout
Fernando Sanches
The Complete Solution for Volume Analysis in the WIN Market The #C3 - [volume] indicator was developed specifically for traders operating in the Brazilian Stock Market . If you are a trader seeking precise and effective strategies for the WIN asset, this indicator becomes an essential tool in your arsenal. By leveraging in-depth volume flow analysis , it allows you to identify reversal points or trend continuations based on significant volumes. Analyzing volume is one of the most powerful
OHLC Candle
Fernando Sanches
This tool draws candles at different TIMEFRAME from the 'pattern' displayed on the screen... ...In the 'Standard Chart' M1, he draws the Candles in M15. For example: The 'Standard Chart' in M1, the 'OHLC' in M15 are drawn the Candles (boxes) of M15 behind the candles of M1. Download the demo version... ...see how it can help you notice Support/Resistance points as well as good moves with highs and lows in the 15M.
Counts the lifetime of Candle Extra until its closing. It is used to assist in the entry of operations... ...We operate at the close of one-minute Candles, that is, when the timer is at 00:xx:01. We open an order, and the value of that operation is also displayed by the tool. Extra: To 'unlock' the price scale. Double click on the scale and the graph will be 'horizontally centered'. In addition to allowing the expansion and contraction of the price scale, we can navigate the chart by draggin
Quando você abrir uma operação, mover o Stop Loss para o ponto de entrada (Break-Even) sempre que a operação andar favoravelmente 75 pontos, é uma obrigação! Isto significa que, quando sua operação atingir 75pts você moverá o Stop Loss para 10pts do ponto de entrada, desta forma, basicamente você vai colocar o Stop Loss em um preço 'melhor' que o preço de entrada (Break Even), ou seja, no lucro. Na pior das hipóteses, você sairá no “zero a zero”. A ideia é não deixar que uma operação parcialment
Automatically plots the 'Golden Fibonacci Ratio’ between the High and Low of the previous day... ...Highs and Lows are great Support and Resistance zones. Breakouts of Fibonacci levels are key points for entry and exit of trades. Pink lines indicate that the previous day's Candle closed lower. Blue colored lines indicate that the previous day's Candle closed higher.
Filter:
No reviews
Reply to review