Bandas Moveis Trianguladas
- Indikatoren
- Version: 8.21
- Aktivierungen: 5

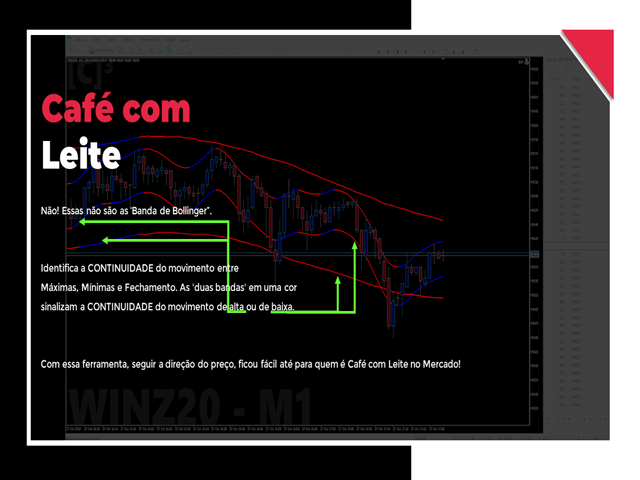
Nein! Es handelt sich nicht um das "Bollinger Band".
Zeigt die KONTINUITÄT der Bewegung zwischen Hoch, Tief und Schluss an. Die "zwei Bänder" in einer Farbe signalisieren die KONTINUITÄT der Bullen- oder Bärenbewegung. Mit diesem Tool, nach dem Preis Richtung, es war einfach, auch für diejenigen, die Café com Leite in den Markt!
Denken Sie daran, wenn:
Alle unsere Tools arbeiten zusammen, exklusive Indikatoren und Risiko-Management-Roboter.
Sie identifizieren automatisch die verschiedenen Muster in der Mini-Index Dynamik sowie unsere Operationen zu verwalten. Und basierend auf ihnen, berechnen wir die zukünftigen Bewegungen des Mini-Index und gelten unser Kapital-Management.