Bandas Moveis Trianguladas
- Indicadores
- Versión: 8.21
- Activaciones: 5

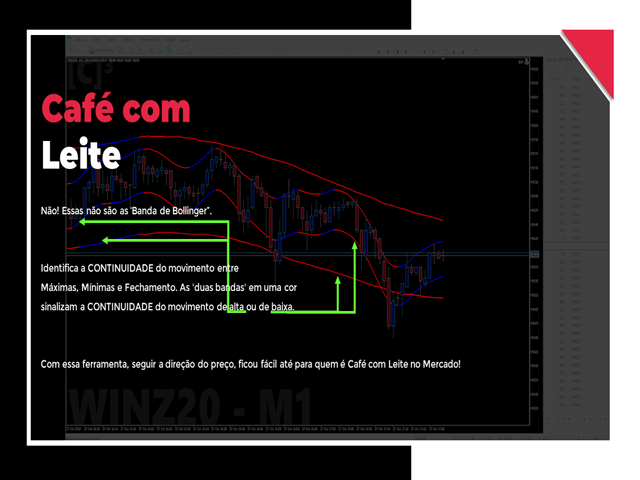
¡No! No son las "Bandas de Bollinger".
Identifica la CONTINUIDAD del movimiento entre Máximo, Mínimo y Cierre. Las 'dos bandas' de un mismo color señalan la CONTINUIDAD del movimiento alcista o bajista. ¡Con esta herramienta, siguiendo la dirección del precio, fue fácil incluso para aquellos que son Café com Leite en el Mercado!
Recuerde que si:
Todas nuestras herramientas trabajan juntos, indicadores exclusivos y robot de gestión de riesgos.
Identificam automaticamente os diferentes padrões na dinâmica do Mini-Index, bem como gerem as nossas operações. E com base em eles, calculamos os movimentos futuros do Mini-Index e aplicamos nossa gestão de capital.