Multi Timeframe Support Resistance Drawing
- Indicators
- Version: 1.3
- Updated: 30 December 2021
- Activations: 5

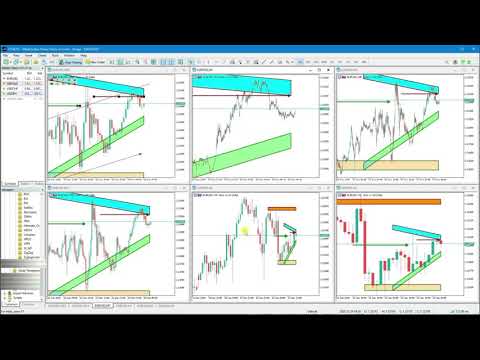
Are you tired of drawing Support & Resistance levels for all charts of the same Symbol while doing Multi-Timeframe analysis?
Well, if you are a Price Action trader then this indicator will solve your problem. Draw on 1 Timeframe and it will auto-sync with other charts of the same Symbol.
You can draw rectangles, lines, and eclipse.
It will give an alert when touched/break on line. It work's on all Timeframes.
Major Update
Added::
1}triangle
2}Fibonacci Retracement
3}Text Lable
4}Up/Down Arrow
5}Each Button Has Show Option
6}All Object Hide/Un-hide
I am not happy at all with such product. There are many problems wit it: 1) you dont have overall control on the number of activations, for example you cannot remove a licence from an account to another, once a demo account expires for example you lose your licence. Other developers found systems to avoid this issue. 2) The indicator itself does not work well. for some reason once when i open a a new chart or the terminal it removes itself and I have to plot the indicator agaian and again. All the work you do on the lines remove itself once you close the terminal, you cannot save the lines , not even if you save them as a template. 3) the customer support is not good, I have asked many times the developer to support me to understand some of the functions and he has never been willing to help me out with share screen softwares. 4) Only the MT5 version is more stable but you need to purchase two softwares of the developer in order to make it work properly. Probably the main issue is with the MQL code base, indeed it does not help with professionalim