Multi Timeframe Drawing Support Resistance
- Indicators
- Version: 1.7
- Updated: 30 December 2021
- Activations: 5

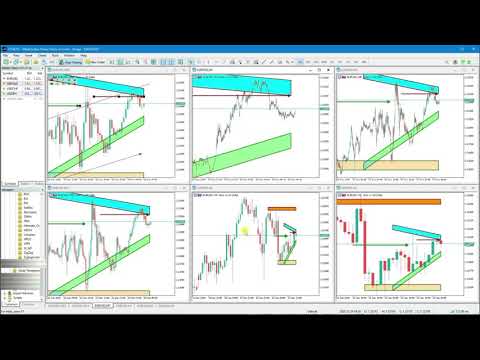
Are you tired of drawing Support & Resistance levels for all charts of the same Symbol while doing Multi-Timeframe analysis?
Well, if you are Price Action trader then this indicator will solve your problem.
Draw on 1 Timeframe and it will auto-sync with other charts of the same Symbol.
You can draw rectangles, lines, arrows, and eclipse.
It will give an alert when touched/break on line and arrow.
It work's on all Timeframe.
Major Update
Added::
1}Triangle
2}Fibonacci Retracement
3}Text Label
4}Up/Down Arrow
5}Each Button Has Show Option
6}All Object Hide/Un-hide