Universal Indicator Scanner and Alert

  • Indicators
  • Kazuma Uezono
    Kazuma Uezono
    • MQL5 / MQL4 / Pine Script Developer at  KuHero
    • Japan
    • 5504
    5 (1)
    MQL5 / MQL4 / Pine Script v6 developer and active trader.
    Seller on the MQL5 Market (indicators for MT4/MT5).
    Services:
    - TradingView Pine Script to MT5/MT4 conversion (bar-by-bar matching, with tester report)
    - MT4 to MT5 migration
  • Version: 1.3
  • Activations: 5
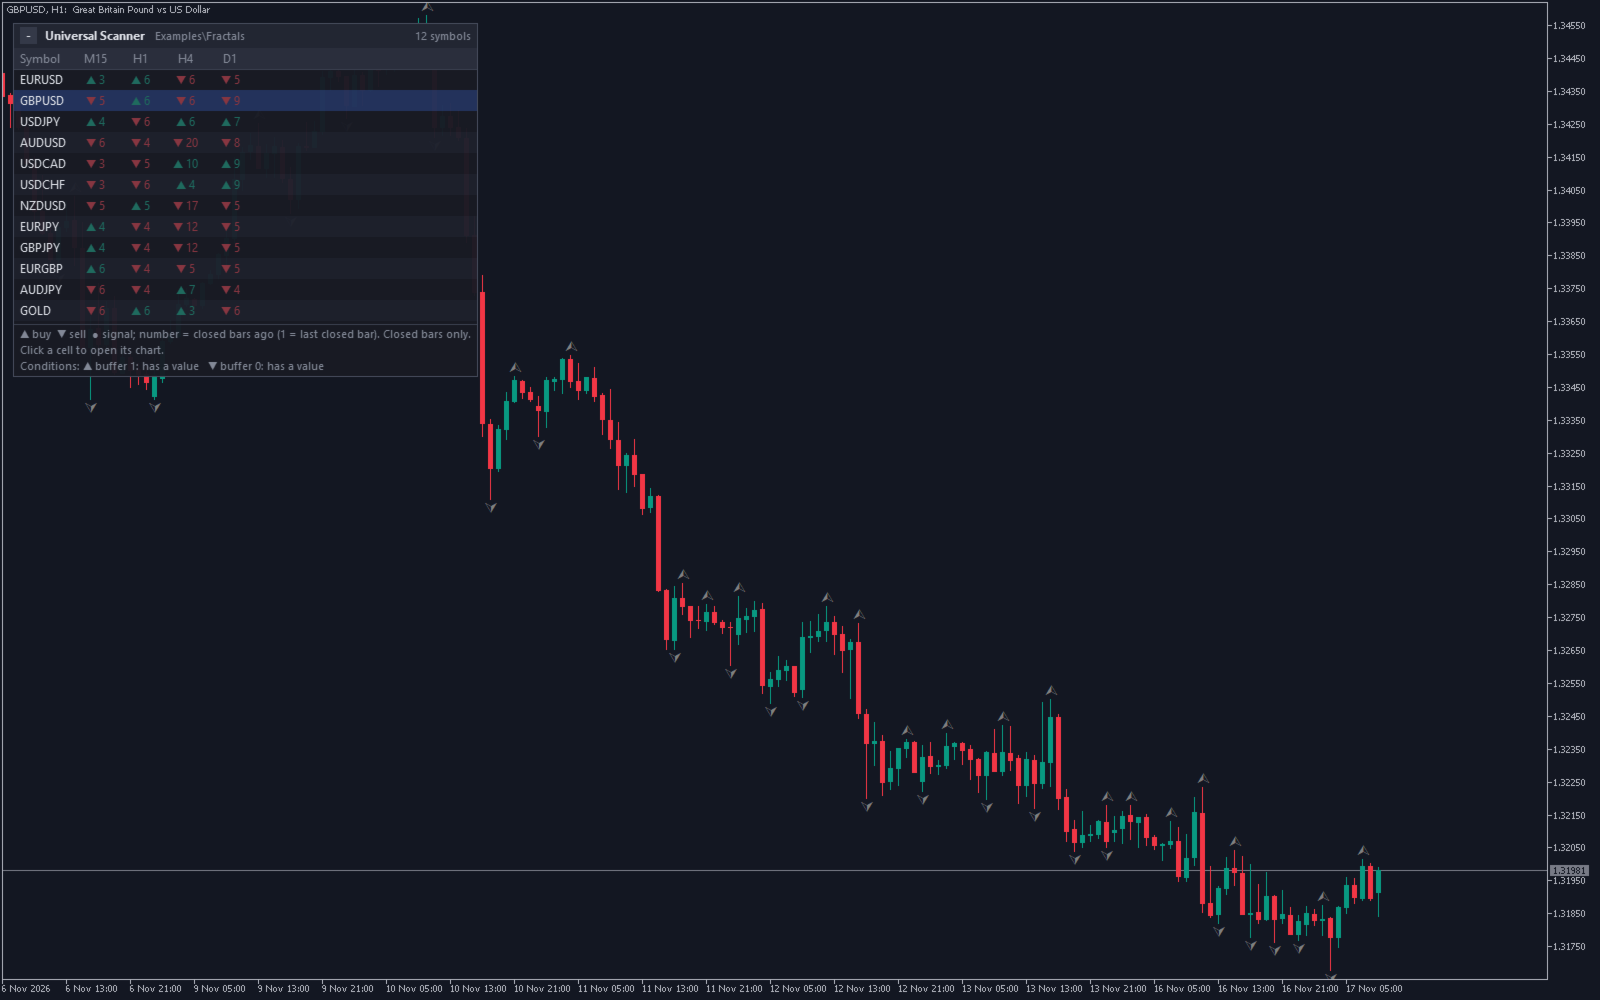
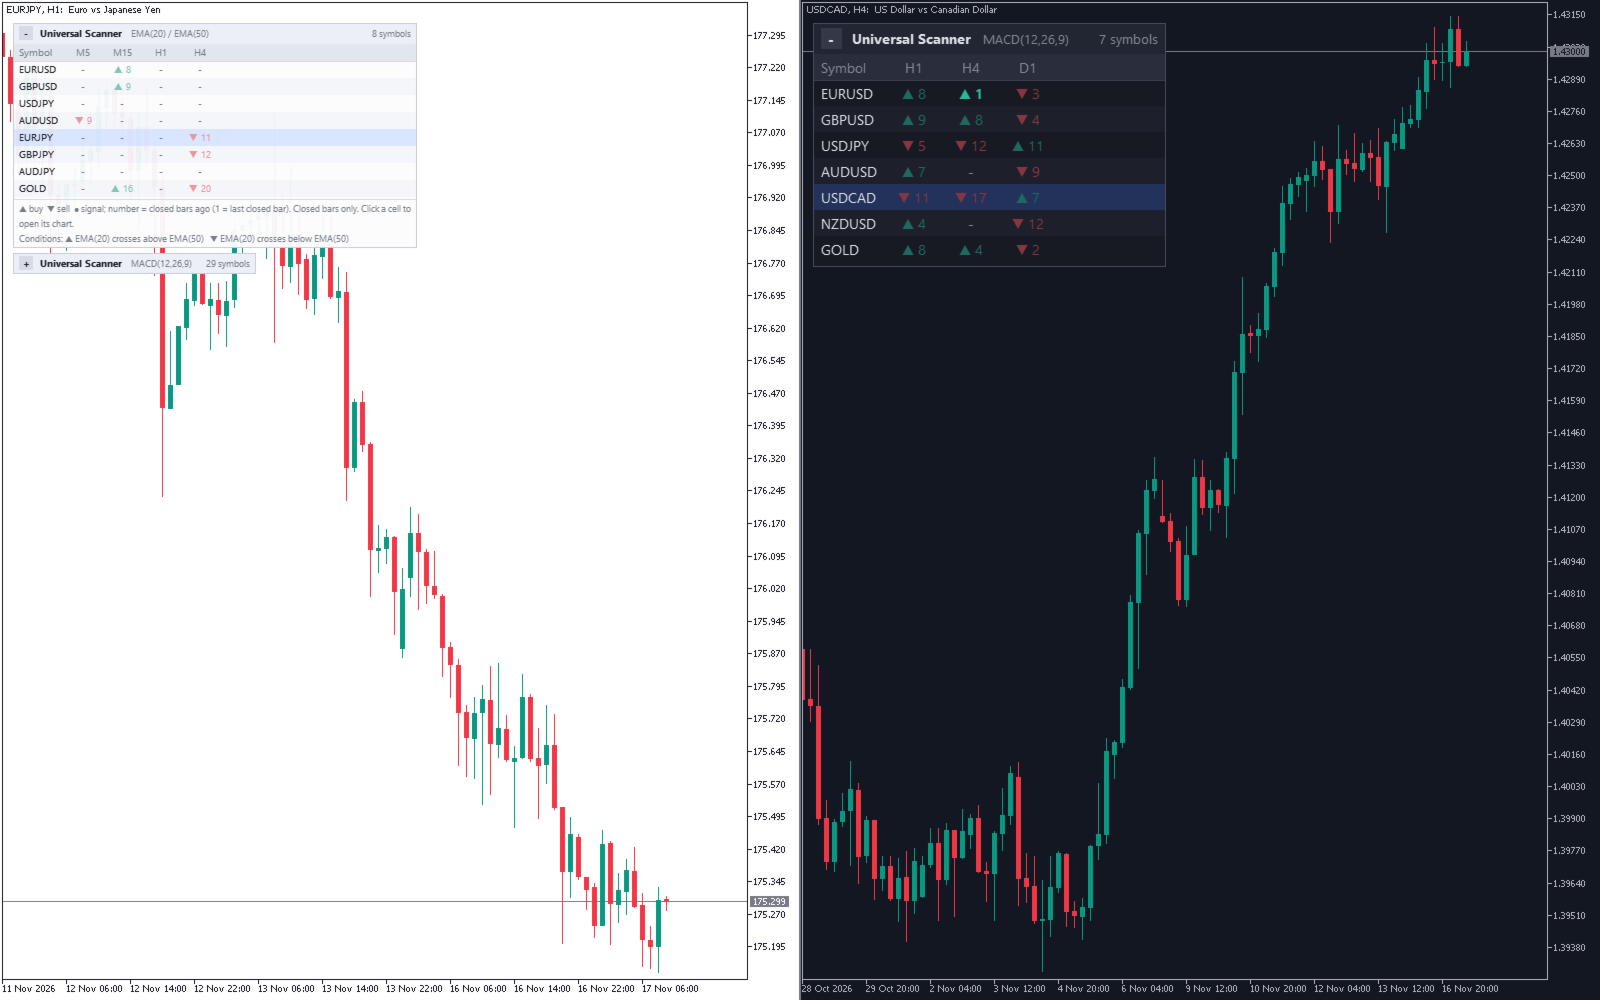
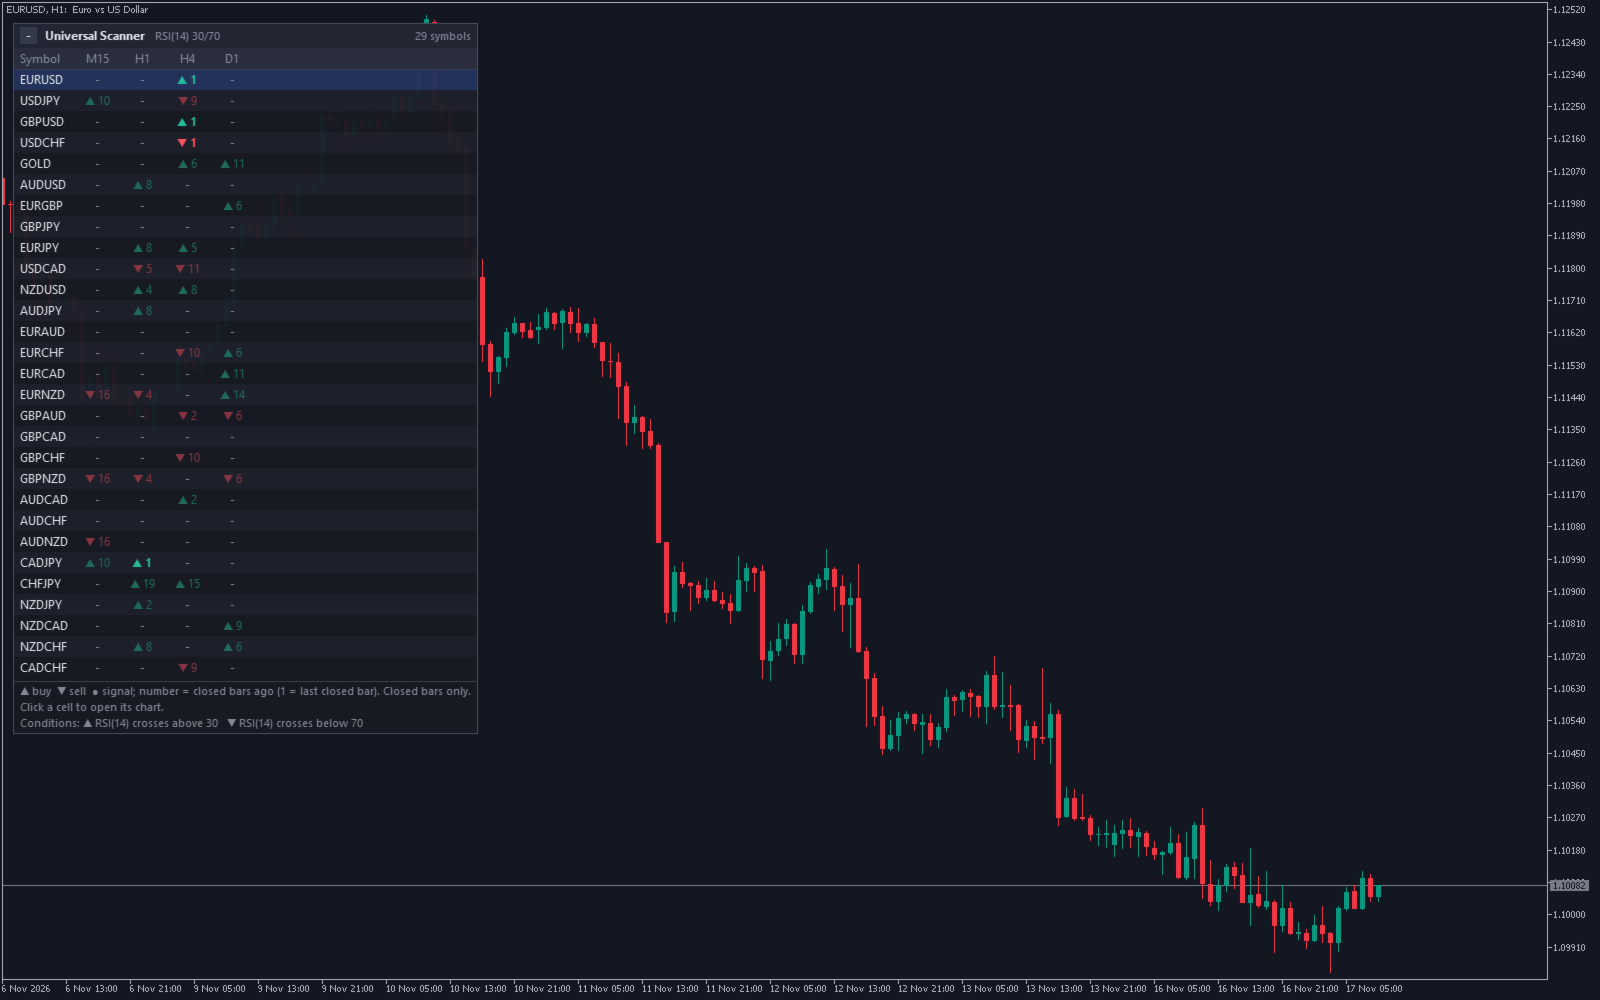
Universal Indicator Scanner and Alert reads the buffers of an indicator on up to 30 symbols and up to 8 timeframes and shows the latest signal of each symbol and timeframe in one table. It can also watch the arrows and other objects that indicators draw on your open charts, and alert you when a new one appears.
It is meant for traders who already use an indicator and want to follow it on many symbols without opening many charts. The scanner only reads values. It does not create signals of its own, does not judge whether a signal is good and never places orders.

Features
- Buffer mode: a built-in preset (RSI crosses its low or high level, fast EMA crosses slow EMA, MACD crosses its signal line) or your own custom indicator (.ex5 file, no source code needed).
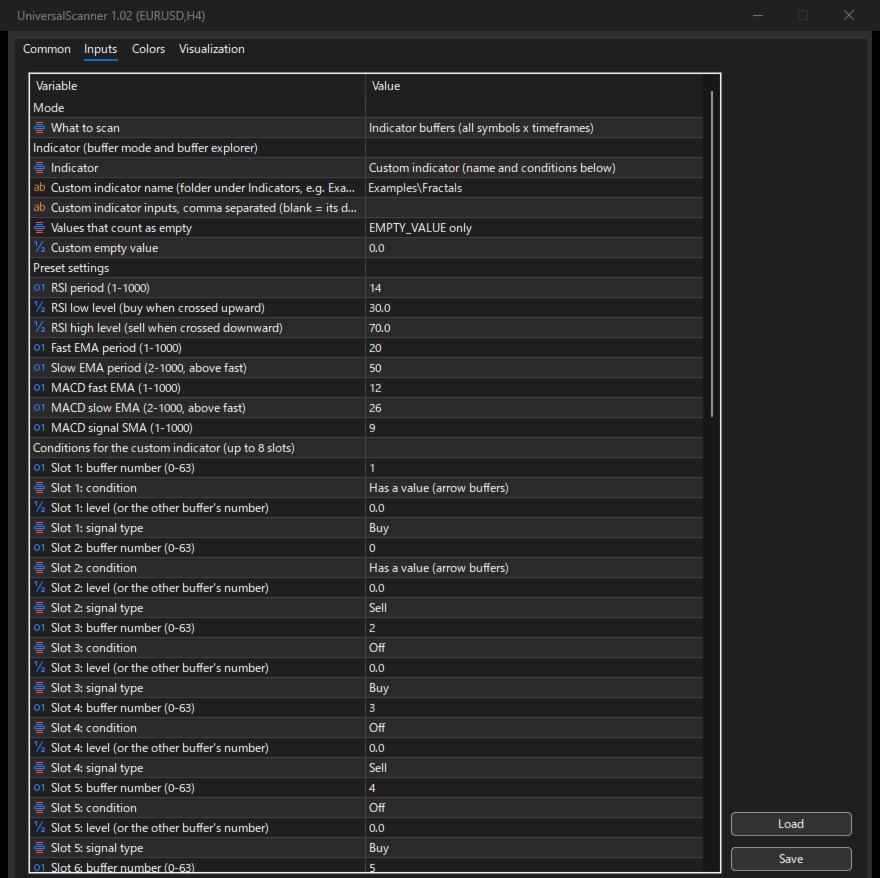
- Up to 8 conditions (slots) per indicator. Each slot reads one buffer number (0-63) and has one of 8 conditions: has a value (arrow buffers), above or below a level, crosses above or below a level, crosses above or below another buffer, value changed from the previous bar. Each slot is marked buy, sell or neutral.
- Up to 16 inputs can be passed to the custom indicator as text (numbers, true/false, text, colors, dates). Blank = the indicator's own defaults.
- "Values that count as empty": EMPTY_VALUE only, EMPTY_VALUE and 0, or EMPTY_VALUE and a value you enter.
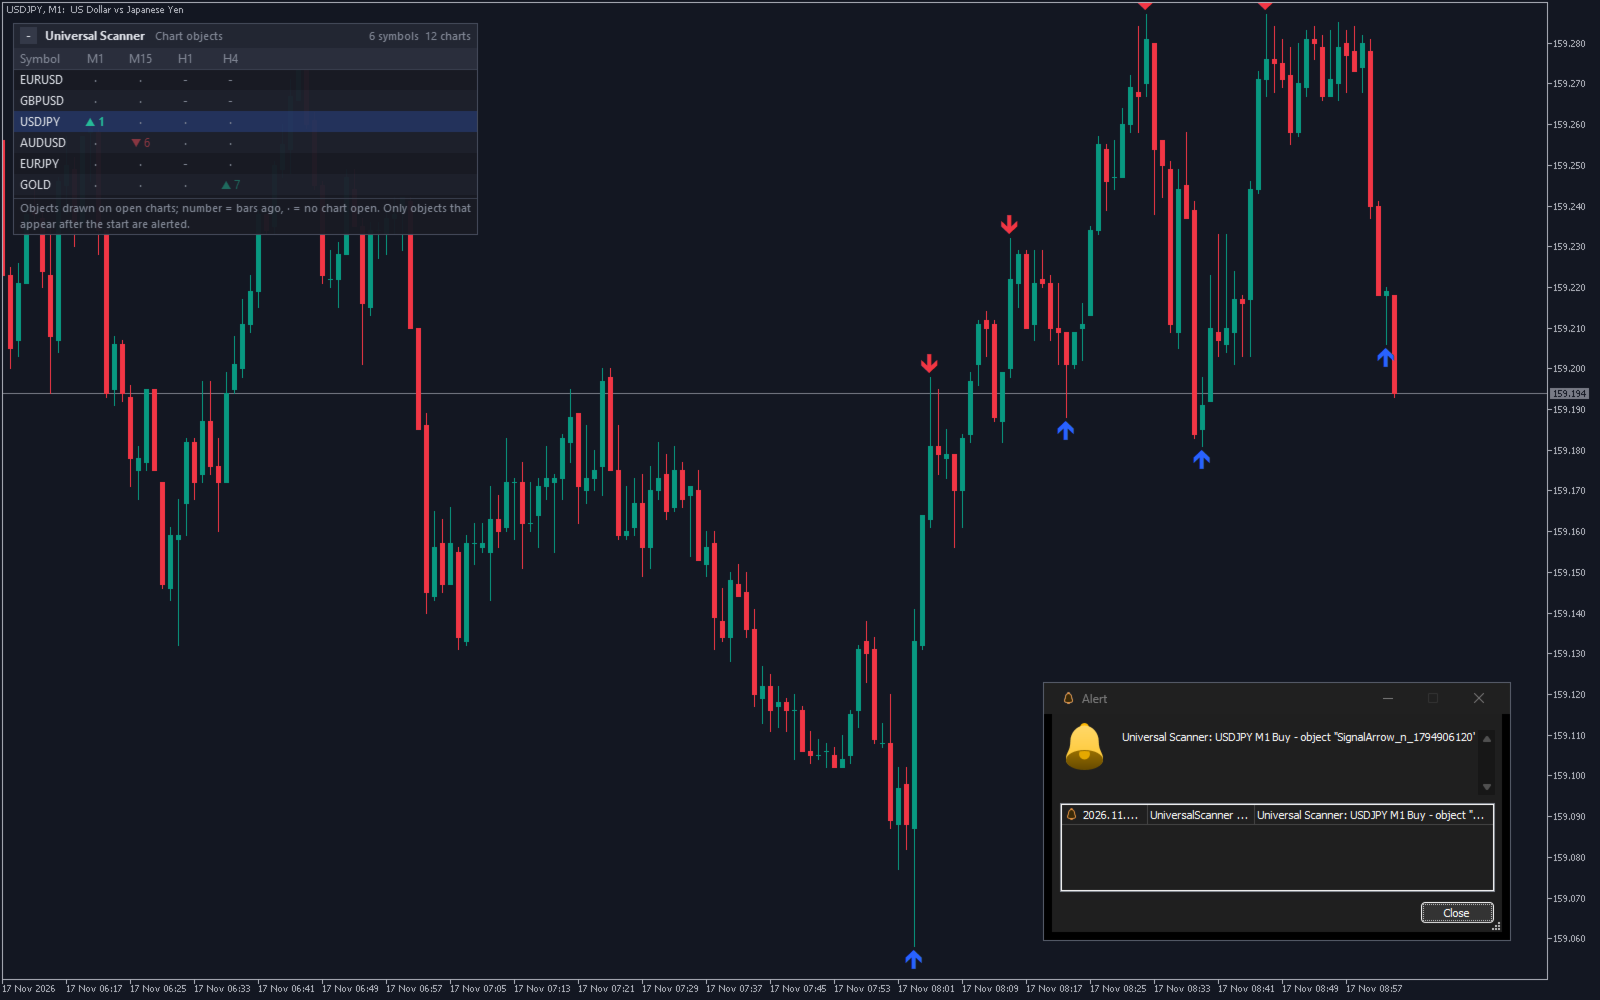
- Objects mode: watches the objects drawn on all open charts (up to 100) and filters them by part of the name, object type (arrows, arrows and text, lines and rectangles, any) and color. The direction comes from the buy and sell colors you set, or from the arrow type and arrow code. The terminal's own trade arrows are ignored by default.
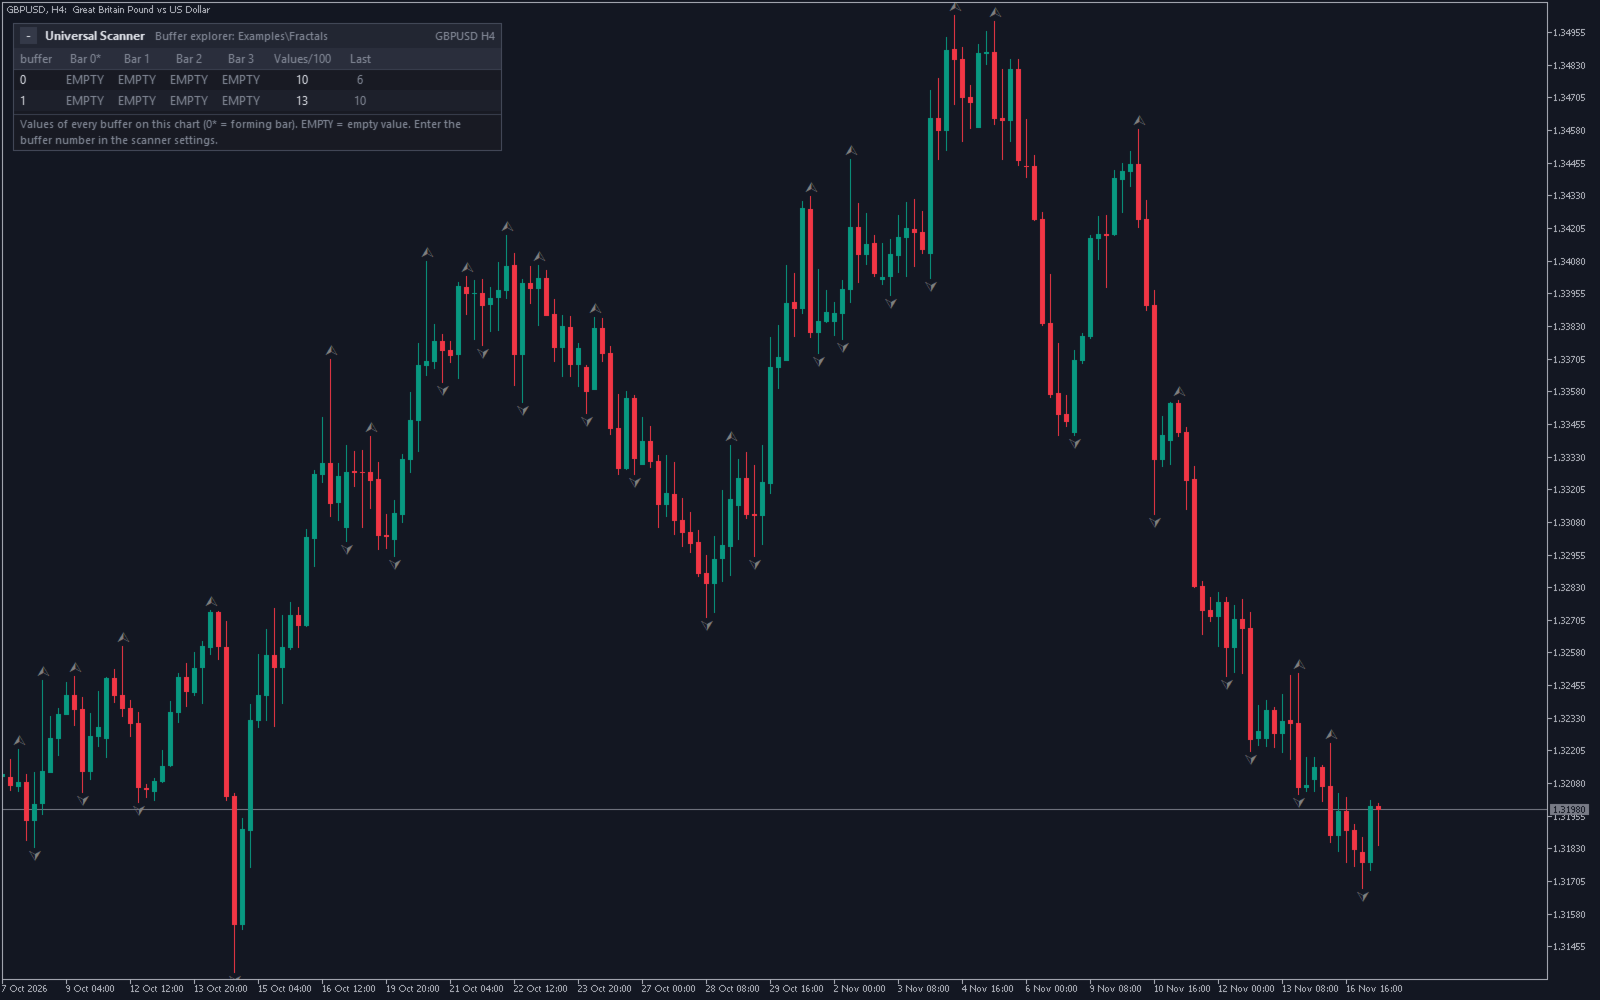
- Buffer explorer: shows the values of every buffer of an indicator on the current chart, so you can find which buffer number to use.
- Table: rows are the Market Watch symbols or your own list (up to 30), columns are your timeframes (up to 8, default M15, H1, H4, D1). A cell shows the last signal and how many closed bars ago it happened, or the value of the first slot's buffer. Click a cell to open that chart.
- Alerts by pop-up, sound, push notification and e-mail. No repeated alerts for the same bar, also after a terminal restart.
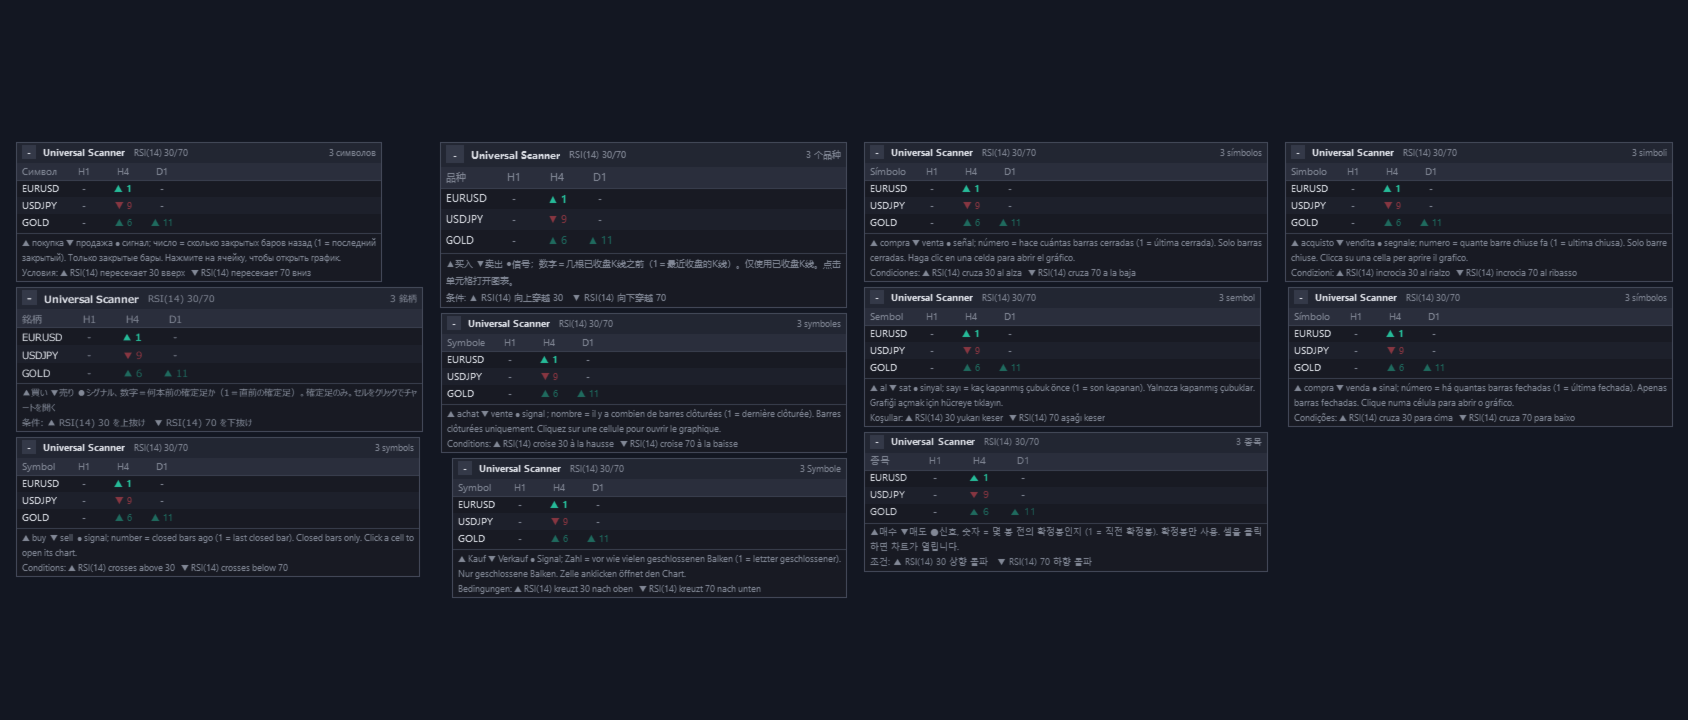
- 11 panel languages (Auto follows the terminal), three sizes, light or dark colors, collapse button, four corners.

Main Inputs
- Mode: indicator buffers, objects on open charts, or buffer explorer.
- Indicator: preset or custom, custom indicator name (path under the Indicators folder, for example Examples\ZigZag), its inputs separated by commas, values that count as empty.
- Preset settings: RSI period and levels (default 14, 30 / 70), fast and slow EMA (default 20 / 50), MACD (default 12, 26, 9).
- Slots 1-8: buffer number, condition, level (or the other buffer's number), signal type.
- Signals: how many closed bars back a signal still counts as new (default 1), bars searched for the last signal shown in a cell (default 20), cell content, recheck interval for late signals (default 10 seconds).
- Objects mode: object types, name contains, buy color, sell color, only these colors, only objects on the last N bars (default 3), wait until the bar has closed, ignore trade arrows.
- Symbols and timeframes, panel, alerts.

How It Is Calculated
- Only closed bars are read. Bar 1 = the last closed bar.
- Crosses use the last two closed bars: crosses above = the previous bar was at or below the level and the newer bar is above it.
- "Above" and "below" are states. While a state lasts, the signal is the bar on which it started.
- When a buy slot and a sell slot hit on the same bar, the cell shows a neutral mark.
- The first time a symbol and timeframe is scanned, its current signal is only recorded, not alerted. This avoids a burst of alerts at start. In objects mode, objects that already exist on a chart when it is first seen are not alerted.
- The last alerted bar of each symbol and timeframe is kept in terminal global variables (names starting with "UISb_" and "UISo_"), so a restart does not repeat alerts.

Notes and Limits
- The scanner reads values. It does not test or improve the indicator you connect, and it says nothing about that indicator's accuracy or results. A signal in the table is that indicator's output, not a recommendation. Trade decisions are your own.
- "Has a value" is for arrow buffers that are empty on most bars. On a line buffer it is true on every bar.
- If the connected indicator repaints or changes past values, the table and alerts follow those changes. The scanner rereads closed bars every 10 seconds by default to catch late arrows.
- Objects mode can only see charts that are open. If you change a chart's timeframe and later change it back, arrows on the last N bars that are newer than the last alert for that chart are alerted (by design).
- An indicator that needs an input which cannot be expressed as text cannot be fully set; it runs with its defaults for the inputs you leave out. Inputs are passed in order from the first one.
- Each symbol and timeframe uses one copy of the connected indicator. Heavy indicators on 30 symbols x 8 timeframes need more CPU and memory. Use fewer rows or timeframes if the terminal slows down.
- In the Strategy Tester the panel is calculated only in visual mode, and alerts are not sent there. Push notifications and e-mail need the terminal's settings.

Compatibility and Support
- MetaTrader 5 only. The MetaTrader 4 version is a separate product.
- No DLLs, no internet access.
- A PDF user guide (English or Japanese) is sent on request through MQL5 messages after purchase.
- Support through MQL5 messages, reply within 3 business days, for installation, settings and bug reports. We can help you find the buffer numbers of an indicator you own, but we cannot answer questions about market views, trade decisions or how good another indicator's signals are.
Recommended products
Caicai L&S Yield Histogram Important Notice: This indicator is an integral tool of the automated EA Caicai Long and Short Pair Trading . This indicator visually displays the percentage deviation (Yield %) of a pair's current spread relative to its own historical mean. It is an excellent tool for quickly visualizing the gross financial potential of a market distortion in Long & Short operations. Main Features: Percentage Visualization: Understand the size of the distortion in palpable percentage
PZ Mean Reversion MT5
PZ TRADING SLU
1 (1)
Outperform traditional strategies: effective mean reversion for savvy traders Unique indicator that implements a professional and quantitative approach to mean reversion trading. It capitalizes on the fact that the price diverts and returns to the mean in a predictable and measurable fashion, which allows for clear entry and exit rules that vastly outperform non-quantitative trading strategies. [ Installation Guide | Update Guide | Troubleshooting | FAQ | All Products ] Clear trading signals Ama
A clearer view of momentum, with the tools to follow more than one market. WaveTrend SuperSmoother Signals PRO brings a smoothed WaveTrend oscillator, filtered Buy/Sell signals and a clickable market scanner to MetaTrader 5. Review momentum on your chart, align signals with a higher timeframe and move directly to the markets that need your attention. PRO uses the same signal engine as WaveTrend SuperSmoother Signals IRABC and adds two practical tools: a higher-timeframe trend filter and a multi
VWAP Analytics Advanced Suite for MetaTrader 5 Gain institutional-grade market insight with the VWAP Analytics Advanced Suite , a professional Volume Weighted Average Price indicator built exclusively for MetaTrader 5. This tool goes beyond a simple VWAP line; it is a complete analytical ecosystem designed to identify trend bias, measure market deviation, and provide high-probability entry and exit signals with precision timing. Whether you are a day trader, scalper, or swing trader, this su
RBreaker
Zhong Long Wu
RBreaker Gold Indicators is a short-term intraday trading strategy for gold futures that combines trend following and intraday reversal approaches. It not only captures profits during trending markets but also enables timely profit-taking and counter-trend trading during market reversals. This strategy has been ranked among the top ten most profitable trading strategies by the American magazine   Futures Truth   for 15 consecutive years. It boasts a long lifecycle and remains widely used and st
- All of my indicators are just 30$ !! Limited offer. Contact me for extra bonus   indicator, instruction or any questions! - Lifetime update free - Non-repaint - Plus Free Filtering Indicator  - Related product: Gann Gold EA - I just sell my products in Elif Kaya Profile, any other websites are stolen old versions, So no any new updates or support. Advantages of  M1 Scalper Pro  Profitability: M1 Scalper Pro is highly profitable with a strict exit strategy. Frequent Opportunities: M1 Scalper
Structure King AI Signal Structure King AI Signal is a professional MetaTrader 5 trading indicator designed to help traders analyze market structure, trend direction, multi-timeframe confirmation and trade management from one clean dashboard. Key Features • Market Structure & Trend Analysis • BUY / SELL Signals • Multi-Timeframe (HTF) Confirmation • Entry Price Levels • Dynamic Stop Loss (SL) • TP1 / TP2 / TP3 Levels • ATR Volatility Analysis • ADX Trend Strength Filter • Adaptive Market Filter
Max Min Delta Indicator - Market Volume Imbalance Analysis Gain Deeper Insights into Market Volume Imbalance with Delta Analysis What is the Max Min Delta Indicator? The Max Min Delta Indicator is a powerful market volume analysis tool that visually represents maximum and minimum delta values using a histogram. It helps traders identify market strength, weakness, absorption, and aggressive buying/selling activity with precision. Key Features Histogram Visualization: Displays Max Delta (Green) an
SMC Smart Flow Pro
Thitipong Nookhunthod
Short Description: SMC Smart Flow Pro is an advanced Smart Money Concept indicator that automatically detects Break of Structure (BOS), Change of Character (CHoCH), and projects precise TP/SL target levels on all timeframes — built for serious traders who trade with institutional flow. Full Description: SMC Smart Flow Pro is a premium Smart Money Concept (SMC) indicator for MetaTrader 5, engineered for traders who want to trade alongside institutional order flow. By automatically mapping m
Your Trend Friend
Luigi Nunes Labigalini
5 (1)
The trend is your friend! Look at the color of the indicator and trade on that direction. It does not  repaint. After each candle is closed, that's the color of the trend. You can focus on shorter faster trends or major trends, just test what's most suitable for the symbol and timeframe you trade. Simply change the "Length" parameter and the indicator will automatically adapt. You can also change the color, thickness and style of the lines. Download and give it a try! There are big movements w
Crash 1000 Scalping Indicator for the Crash 1000 Deriv Synthetic Index. Introduction The Crash 1000 Scalping Indicator is a specialized tool designed for the Crash 1000 index on the Deriv Synthetic market. This indicator is particularly useful for scalping on the M1 timeframe, helping traders to identify precise entry and exit points for buy positions. It is designed to be non-repainting, providing clear signals with audible alerts and push notifications, and is compatible with mobile devices th
CosmiCLab SMC FIBO CosmiCLab SMC FIBO is a professional trading indicator designed for traders who use Smart Money Concepts (SMC), market structure analysis and Fibonacci retracement levels. The indicator automatically detects market swings and builds Fibonacci levels based on the latest impulse movement. It also identifies market structure changes such as BOS (Break of Structure) and CHOCH (Change of Character), helping traders understand the current market direction. CosmiCLab SMC FIBO also pr
Noize Absorption Index - is the manual trading system that measures the difference of pressure between bears forces and bulls forces. Green line - is a noize free index that showing curent situation. Zero value of index shows totally choppy/flat market.Values above zero level shows how powerfull bullish wave is and values below zero measures bearish forces.Up arrow appears on bearish market when it's ready to reverse, dn arrow appears on weak bullish market, as a result of reverse expectation.
Trend Master V2
Oratile Pitsoane
What Is Trend Master Pro? Trend Master Pro   is a professional-grade trend trading indicator built for MetaTrader 5. It was designed with one goal in mind — to keep you on the right side of the market at all times by combining three powerful technical tools into a single, clean, easy-to-read display directly on your price chart. Instead of cluttering your screen with multiple separate indicators, Trend Master Pro fuses an   EMA Ribbon trend filter , a   ZigZag swing point engine , and a   breako
Onnyx Indicator is a non-repainting supply and demand analysis indicator for MetaTrader 5. It identifies confirmed swing-based zones, scores their quality, and displays clear BUY and SELL signals directly on the chart. MAIN FEATURES • Supply and demand zones based on confirmed price swings • ATR-adaptive zone width for changing market volatility • Zone quality displayed as a percentage inside each zone • Clear BUY and SELL arrows with enlarged signal markers • Closed-candle signal logic designed
NQX Range Edge Hook Weekly Bias is a signal indicator for MetaTrader 5: range edge hook signals (it only signals in the direction of the weekly bias). Proprietary NQX logic that detects price leaving the edge of its recent range, confirmed by the candle. It only signals in the direction of the weekly bias. It draws the suggested entry, a short stop and long targets (3:1, 5:1, 10:1, up to 20:1 on swing); you decide. What it draws on the chart - An arrow on the closed signal candle (it never repai
Professional Renko Chart MT5 Professional Renko Chart MT5 is a clean MetaTrader 5 Renko chart indicator designed to display Renko bricks in a separate indicator window, with optional Renko box visualization directly on the main price chart. The indicator is built for traders who want a familiar Renko chart style inside MetaTrader 5, similar to the Renko chart visualization available on popular modern charting platforms such as TradingView. It converts normal time-based candles into Renko bricks
Passband Filter Pro Passband Filter Pro is a trend and cycle oscillator for MetaTrader 5. It is built on the Ehlers Super Passband Filter, a band pass filter that removes long term trend drift and short term noise so that only the dominant market cycle remains. The result is a clean oscillator with a color cloud that shows overbought and oversold conditions, cycle turns, and momentum on forex, gold, indices, stocks and crypto. Most traders enter too early or too late. Simple moving averages la
Premium level is a unique indicator with more than 80% accuracy of correct predictions! This indicator has been tested for more than two months by the best Trading Specialists! The author's indicator you will not find anywhere else! From the screenshots you can see for yourself the accuracy of this tool! 1 is great for trading binary options with an expiration time of 1 candle. 2 works on all currency pairs, stocks, commodities, cryptocurrencies Instructions: As soon as the red arrow app
C88 Projected Candle See the Bigger Picture Before the Candle Closes C88 Projected Candle is a professional market visualization indicator that projects the current higher timeframe candle directly onto your active chart. It helps traders understand the evolving market structure without constantly switching between timeframes. Whether you trade Price Action, ICT, Smart Money Concepts (SMC), or Volume Profile, this indicator provides a cleaner and more intuitive way to read market context. Key Fe
Was: $249  Now: $99   Market Profile defines a number of day types that can help the trader to determine market behaviour. A key feature is the Value Area, representing the range of price action where 70% of trading took place. Understanding the Value Area can give traders valuable insight into market direction and establish the higher odds trade. It is an excellent addition to any system you may be using. Inspired by Jim Dalton’s book “Mind Over Markets”, this indicator is designed to suit the
Visual CrossPulse Dynamics Indicator
AL MOOSAWI ABDULLAH JAFFER BAQER
Visual CrossPulse Dynamics: Trade with the Market's True Rhythm Unlock a new level of market insight with Visual CrossPulse Dynamics, a sophisticated trading indicator designed to adapt to ever-changing volatility and reveal the true direction of the trend. Are you tired of indicators that lag in fast-moving markets or give false signals during consolidation? The Visual CrossPulse Dynamics indicator solves this problem by using an advanced, adaptive algorithm that intelligently adjusts to the m
SMC Indicator BOS & CHoCH analyze market structure using Smart Money Concepts The indicator combines BOS (Break of Structure), CHoCH (Change of Character), Fair Value Gaps (FVG), Liquidity Sweep logic and ATR filtering to provide a structured view of market movements and potential trading opportunities. The indicator automatically identifies swing highs and swing lows and monitors structural breaks in the market. BOS (Break of Structure) identifies potential continuation of the current market st
Launch Pad GOLD Indicator v1.7 Launch Pad GOLD Indicator is a multi-timeframe technical analysis tool for MetaTrader 5. The indicator uses EMA-based market structure analysis together with momentum monitoring, trend alignment tools, and configurable filtering functions. The system is designed to assist with chart analysis across multiple timeframes. Features EMA Trend Analysis The indicator uses EMA calculations to display trend structure and directional movement. Functions include: Buy and sel
Price Magnet — Price Density and Attraction Levels Indicator Price Magnet is a professional analytical tool designed to identify key support and resistance levels based on statistical Price Density. The indicator analyzes a specified historical period and detects price levels where the market spent the most time. These zones act as “magnets,” attracting price action or forming a structural base for potential reversals. Unlike traditional Volume Profile tools, Price Magnet focuses on price-time d
One of the number sequences is called "Forest Fire Sequence". It has been recognized as one of the most beautiful new sequences. Its main feature is that this sequence avoids linear trends, even the shortest ones. It is this property that formed the basis of this indicator. When analyzing a financial time series, this indicator tries to reject all possible trend options. And only if he fails, then he recognizes the presence of a trend and gives the appropriate signal. This approach allows one t
STRICTLY FOR BOOM INDEX ONLY!!!!! Here I bring the Maximum Trend Arrows OT1.0 MT5 indicator. This indicator is made up of a combination of different trend indicators for entries and exits, for entries an orange arrow will paint on the chart below the current market and a red flag for closing of trades and it produces buy arrows only. When the orange arrow appears, it will appear along with it's sound to notify you. The 1H timeframe is recommended, don't use it anywhere else than on the 1H timefr
Introduction to the Manual Backtesting Indicator on MQL5 The MetaTrader platform provides an excellent backtesting tool for evaluating Expert Advisors (EAs). However, when it comes to manually backtesting a strategy to assess its effectiveness, this tool has some limitations: You cannot manually draw zones or trend lines while in backtesting mode. You cannot switch timeframes to check time alignment. For example, if my strategy requires additional confirmation from a higher timeframe (HTF), this
Fibonacci Sniper XAUUSD
Luis Paulo de Oliveira
GOLD FIBONACCI SNIPER M5 Description GOLD FIBONACCI SNIPER M5 is a professional MetaTrader 5 indicator specially developed for XAUUSD (Gold) on the M5 timeframe. The indicator uses Fibonacci retracements combined with trend analysis, volatility filters, candle rejection patterns, and market strength confirmation to identify high-probability entry opportunities. The system automatically detects retracement zones between the 38.2, 50, and 61.8 Fibonacci levels, which are commonly considered instit
WBS SMC Without Repaint – Ultimate XAUUSD Scalping Engine (M5 Timeframe) Take your Gold trading to the institutional level with "WBS SMC Without Repaint", a highly advanced premium indicator engineered specifically for XAUUSD (Gold) on the M5 (5-Minute) timeframe.  Built upon the core pillars of Smart Money Concepts (SMC) combined with precise algorithmic candle pattern recognition, this tool identifies high-probability institutional footprints in real-time. Best of all: 100% ABSOLUTELY
Buyers of this product also purchase
Trend Sniper X
Sarvarbek Abduvoxobov
4.87 (46)
Trend Sniper X is a multi-timeframe trend-following indicator for MetaTrader 5 that helps traders identify trend direction and potential reversal points with clarity and precision. for MT4: https://www.mql5.com/en/market/product/193245 Price Information: The current price is promotional and is subject to change as upcoming updates and new features are released. Bonus Offer: To get the FREE Auto-Trade Assistant EA for this indicator, please message the author after purchasing. Code2Profit Channe
A new King in town - Indicator + Order management indications(tp1+tp2+tp3) + Optional Telegram Signal sender   INCLUDED (FREE) + Bonus EA Robot ( FULL TRADING  and SIGNAL SYSTEM ) Our best EA for Gold: Gold Slayer TRY > Reversion Queen  Expert advisor >JOIN Community Channel < NEW Free Automation EA link < click here ( disclaimer: this is new and still on testing and phase , use at your risk on demo) Free Telegram Bridge < click here  This indicator includes an advanced Strategy, a trading sys
Entry Points Pro shows you where to enter, where to put the stop and what lot to trade — before you place the order. PRICE Now 199 USD: 4 copies at this price, then 249 USD. The final price is 349 USD. I make my money trading the markets, and I show it, so I don't need to sell this indicator to everyone. It is a tool for traders who think for themselves, not a magic button. No breakout, no trade. A gray arrow is a cancelled signal: price did not break the signal candle, so there was no entry
Gann Made Easy   is a professional and easy to use Forex trading system which is based on the best principles of trading using the theory of W.D. Gann. The indicator provides accurate BUY and SELL signals including Stop Loss and Take Profit levels. You can trade even on the go using PUSH notifications. PLEASE CONTACT ME AFTER PURCHASE TO GET TRADING  INSTRUCTIONS   AND GREAT EXTRA INDICATORS  FOR FREE! Probably you already heard about the Gann trading methods before. Usually the Gann theory is a
SuperScalp Pro
Van Minh Nguyen
4.54 (37)
SuperScalp Pro - Professional Multi-Layer Confluence Scalping System SuperScalp Pro is an advanced scalping indicator that upgrades the classic Supertrend with multiple intelligent confirmation filters. It helps you identify higher-probability Buy/Sell opportunities while significantly reducing false signals. Clear Buy and Sell arrows appear directly on the chart, along with automatic ATR-based Stop Loss and Take Profit levels calculated in real time. After purchase, please message me on MQL5 to
M5 Sniper
MeanFX
5 (4)
Get your trading edge in the line of sight M5 Sniper   is a new indicator by MeanFX. It combines   precise trading signals   with   adaptive TP/SL levels   - creating best possible statistical trades as a result! The price increases every 5 purchases, the next price is 79$ Message me after purchase to receive tips/guide and bonus EA plus trading methodology Auto Optimisation only works on LIVE chart , needs data feed >JOIN Community Channel < What makes it stand out?   Proven statistical per
SMC Intraday Formula
VividMind Digital Solutions
5 (26)
Secure the Lowest Price Today. After purchase, contact via   MQL5 inbox   to receive your buyer kit and bonus. Let's be honest first. No indicator will make you profitable on its own. If someone tells you otherwise, they're selling you a dream. Every indicator that shows perfect buy/sell arrows can be made to look flawless — just zoom into the right window of history and screenshot the winners. We won't do that. SMC Intraday Formula is a tool. It reads the market structure for you, maps the hig
Ultra Indicator
Ihor Otkydach
5 (1)
ULTRA is a technical indicator that operates on an “all-in-one” basis—it independently analyzes the market, generates trading signals, displays levels for setting stop-loss orders, and suggests when to close trades to lock in profits or minimize losses. In other words, it doesn't matter if you don't know how to analyze the market, determine levels—where to set your stop-loss—or struggle with money management. ULTRA will do all of that for you! BUYER BONUS: After purchasing the ULTRA indicator, s
Gold Trend Coach MT5
Cristhian Alexander Gaibor Cuasquer
4.27 (11)
Non-repainting buy and sell signals for gold (XAUUSD) on MetaTrader 5. Every signal comes with a stop loss and three take profits. A Smart Money Concepts filter with BOS and CHoCH, so you trade with the structure, not against it. A live Mentor on your panel that guides every step from the entry to TP3. And alerts straight to your phone and your own Telegram channel. That is Gold Trend Coach. Never trade alone again. FREE BUYER KIT with your purchase: 1. Telegram Alert Bridge: your signals go to
Boba Analysis Suite
Trade Ready Solutions LLC
5 (2)
Boba Analysis Suite Boba Analysis Suite is an analytical indicator for MetaTrader 5. It brings market structure, relevant price zones and broader market context together in a single chart view. Developed through practical experience as a trader and trading coach, it supports a structured analysis process: assessing market direction, identifying important levels and considering multiple timeframes together. Analysis in Context Individual signals gain meaning through context. Boba Analysis Suite h
FX Power MT5 NG
Daniel Stein
5 (33)
FX Power: Analyze Currency Strength for Smarter Trading Decisions Overview FX Power is your go-to tool for understanding the real strength of currencies and Gold in any market condition. By identifying strong currencies to buy and weak ones to sell, FX Power simplifies trading decisions and uncovers high-probability opportunities. Whether you’re looking to follow trends or anticipate reversals using extreme delta values, this tool adapts seamlessly to your trading style. Don’t just trade—trade
Power Candles MT5
Daniel Stein
4.58 (12)
Power Candles - Self-Optimizing Strength Indicator Strength usually lives in a sub-window. The line runs below, the candle above, and your eye keeps connecting the two. Power Candles puts the strength into the candle itself, colored from dark red to dark green, so the chart reads at a glance and the sub-window stays closed. The indicator also finds its own settings for the symbol and timeframe in front of you. One click on [ Apply Best ] draws entry, Stop Loss and Take Profit at the exact prices
M1 Sniper MT5
Oleg Rodin
5 (7)
M1 SNIPER  is an easy to use trading indicator system. It is an arrow indicator which is designed for M1 time frame. The indicator can be used as a standalone system for scalping on M1 time frame and it can be used as a part of your existing trading system. Though this trading system was designed specifically for short-term trading, it still can be helpful for all traders. This trading system can be used with any forex pair and time frame, though lower time frames are recommended from M1 up to M
Auto Optimized SpeedAngle is an institutional-grade momentum vectoring system that eliminates curve-fitting through continuous Walk-Forward Optimization (WFO). Rather than relying on static inputs that degrade when market regimes shift, the indicator dynamically recalibrates its parameters using Out-of-Sample (OOS) validation, ensuring the displayed signals represent genuine statistical edges rather than historical anomalies. By shifting the focus from subjective visual angles to normalized, qua
Azimuth Pro
Ottaviano De Cicco
5 (7)
Azimuth Pro V2: Synthetic Fractal Structure and Confirmed Entries for MT5 Overview Azimuth Pro is a multi-level swing structure indicator by Merkava Labs . Four nested swing layers, swing-anchored VWAP, ABC pattern detection, three-timeframe structural filtering, and closed-bar confirmed entries — one chart, one workflow from micro-swings to macro-cycles. This is not a blind signal product. It is a structure-first workflow for traders who care about location, context, and timing. 1. What Change
Gold Entry Sniper
Tahir Mehmood
5 (23)
Gold Entry Sniper – Professional Multi-Timeframe ATR Dashboard for Gold Scalping & Swing Trading Gold Entry Sniper is a cutting-edge MetaTrader 5 indicator designed to give traders precise buy/sell signals for XAUUSD and other symbols, powered by ATR Trailing Stop logic and a multi-timeframe analysis dashboard . Built for both scalpers and swing traders, it combines real-time market direction , dynamic stop levels , and professional visual dashboards to help you identify high-probability gold en
Apex Patterns PRO Buy Indicator - Get Expert Advisor Based on it for FREE. Self-Optimizing Chart Pattern & Breakout Intelligence Traditional pattern scanners rely on fixed inputs, often underperforming when market volatility and structures shift. Apex Patterns PRO is designed to adapt to changing market conditions by combining structural chart pattern recognition, momentum filtering, and statistical self-optimization into one analytical framework. Adaptive Scanning Engine Self-Optimizing Patter
Meridian Pro
Ottaviano De Cicco
4 (3)
Meridian Pro 2.00: Professional Multi-Timeframe Trend Matrix for MT5 Meridian Pro 2.00 is a professional adaptive trend matrix for MetaTrader 5. It combines the original Meridian trend engine, a clean chart ribbon, closed-bar signal arrows, an 8-timeframe dashboard, Fuel momentum, weighted consensus, synthetic HTF processing and chart-native higher-timeframe context lines. The goal is simple: read current trend, multi-timeframe structure, strength, momentum and EA-ready state from one discipline
Welcome to Entry In The Zone & SMC Multi Timeframe Entry In The Zone & SMC Multi Timeframe An indicator designed for market analysis based on Smart Money Concepts (SMC), displaying Market Structure, Key Zones (Order Blocks, Supply & Demand Zones, and Fair Value Gaps), Liquidity, and real-time BUY / SELL signals. It supports both Single-Timeframe and Multi-Timeframe analysis, along with the Confluence at Zone feature, which helps you evaluate supporting factors when price enters a key zone. Real-
Divergence Bomber
Ihor Otkydach
4.89 (94)
Each buyer of this indicator also receives the following for free: The custom utility "Bomber Utility", which automatically manages every trade, sets Stop Loss and Take Profit levels, and closes trades according to the rules of this strategy Set files for configuring the indicator for various assets Set files for configuring Bomber Utility in the following modes: "Minimum Risk", "Balanced Risk", and "Wait-and-See Strategy" A step-by-step video manual to help you quickly install, configure, and
Adaptive Price Action Engine Buy Indicator- Get EA Based on it for FREE. Self-Optimizing Multi-Timeframe Trend & Candlestick Intelligence Markets do not behave the same way all the time—and not every price-action pattern has the same value in every market regime. Adaptive Price Action Engine is designed to adapt to changing market conditions by combining trend structure, multi-timeframe analysis, candlestick patterns, and statistical optimization into one analytical framework. Two Adaptive Mode
Currency Strength Wizard   is a very powerful indicator that provides you with all-in-one solution for successful trading. The indicator calculates the power of this or that forex pair using the data of all currencies on multiple time frames. This data is represented in a form of easy to use currency index and currency power lines which you can use to see the power of this or that currency. All you need is attach the indicator to the chart you want to trade and the indicator will show you real s
Crystal Heikin Ashi Signals
Muhammad Jawad Shabir
5 (5)
Crystal Heikin Ashi Signals—Professional Trend & Signal Detection Indicator Advanced Heikin Ashi Visualization with Intelligent Signal System for Manual & Automated Trading Final Price: $149 ---------> Price goes up $10 after every 10 sales . Limited slots available — act fast . Overview User Guide PDF Crystal Heikin Ashi Signals is a professional-grade MetaTrader 5 indicator that combines pure Heikin Ashi candle visualization with an advanced momentum-shift detection system. Designed for both m
Naked Forex Tweezer Pro Indicator Tweezer Pro Indicator is a pattern recognition indicator for Forex, Stocks, Indices, Futures, Commodities and Cryptos. The standard Tweezer is a two bar pattern. Our enhanced version is a multi-bar pattern. We filter the patterns for you so that you only get the     best and most effective patterns   and ignore the noise. The Tweezer pattern is a simple and effective pattern to trade. The strategy that comes with the Tweezer is based on price action. The Twe
FiboSniper Pro
Van Minh Nguyen
5 (4)
FiboSniper Pro - Multi-Filter Fibonacci System with Auto SL/TP and Control Panel FiboSniper Pro is a technical indicator that combines dynamic Fibonacci Envelopes with multiple confirmation filters to generate selective Buy and Sell signals. Fibonacci levels are calculated from Moving Average and ATR, then filtered by ADX, EMA, RSI, ATR, Volume, Time and Candle structure. The indicator displays automatic ATR-based Stop Loss and Take Profit levels directly on the chart, along with an interactive
Advanced Supply Demand MT5
Bernhard Schweigert
4.53 (15)
BLACK FRIDAY – 30% OFF Best Solution for any Newbie or Expert Trader! This indicator is a unique, high quality and affordable trading tool because we have incorporated a number of proprietary features and a new formula. With this update, you will be able to show double timeframe zones. You will not only be able to show a higher TF but to show both, the chart TF, PLUS the higher TF: SHOWING NESTED ZONES. All Supply Demand traders will love it. :) Important Information Revealed Maximize the pote
Fx Levels Premium Indicator Support and Resistance are important concepts in trading. Fx Levels Premium was created to easily draw important levels of support and resistance for the active trader. The indicator will give you all important levels (support/resistance) to watch for a wide range of assets. Trading without these levels on your chart is like driving a car for a long journey without a roadmap. You would be confused and blind. Support and resistance levels should be used as guideline
Apollo SR Master is a Support/Resistance indicator with special features which make trading with Support/Resistance zones easier and more reliable. The indicator calculates Support/Resistance zones in real-time without any time lag by detecting local price tops and bottoms. Then to confirm the newly formed SR area, the indicator shows special signal which signalizes that the SR zone can be taken into consideration and used as an actual SELL or BUY signal. In this case the strength of the SR zone
Tokyo mt5 Indicator
Vasiliy Strukov
5 (15)
Tokyo Indicator provides a clear visual overview of trend direction, potential trading signals, and market conditions. Its colour-coded, stepped trend line distinguishes bullish phases in blue from bearish phases in magenta. Matching directional arrows highlight potential buying and selling opportunities when the displayed trend changes. An integrated dashboard brings together the current signal, market bias, momentum, volatility, and signal quality in one convenient view. This allows traders t
Astral Volume
Ottaviano De Cicco
Astral Volume Read volume-weighted momentum in its wider context. Launch Special — $78 · Save 35% · $120 after launch. A strong local move can look different on a higher timeframe. For traders who use volume alongside price, Astral Volume brings the local reading and the wider picture together before they assess a directional change. Judge the move in context. See tick-volume-weighted momentum and how its intensity compares with recent history. Spot agreement and disagreement. Keep two higher-ti
More from author
Supply & Demand Zones marks supply and demand zones on a MetaTrader 5 chart with one fixed, fully published rule: a strong bar (body at least X times ATR) that leaves a short "base" of small-body bars behind it. The base becomes a demand zone when the strong bar is bullish and closes above it, or a supply zone when the strong bar is bearish and closes below it. Each zone shows its state: fresh, touched with a count, or broken. It is meant for traders who draw these zones by hand and want them d
FREE
Elliott Wave Auto Count labels Elliott waves automatically on four degrees at the same time: the base degree and the three degrees above it. It follows the rules and guidelines of "Elliott Wave Principle" (Frost & Prechter). For the current wave it also shows a price x time guideline zone and an invalidation level. This is the MetaTrader 4 version; the counting logic is the same as in the MetaTrader 5 version (sold separately). HOW IT WORKS 1. Swings: five ATR(100)-based zigzags. Each higher d
Fibo Price Time Zones combines Fibonacci price levels with Fibonacci time targets and draws them on the chart as boxes (price x time zones). Where boxes from several waves and from up to two higher timeframes overlap, the area is emphasized in three levels. It is meant for traders who already use Fibonacci retracements and extensions and also want to see roughly when a level is worth watching, without drawing every tool by hand. It is a display tool only: it gives no buy or sell signals and doe
VWAP Band Fills with Anchored VWAP is a TV-compatible VWAP for MetaTrader 5. It uses the same formula as the built-in "VWAP" indicator of TradingView (Pine ta.vwap), offers the same inputs - anchor period, source, offset, standard deviation or percentage bands #1 to #3 - and draws it the same way: a blue VWAP line, green / olive / teal bands and light fills between them. An optional anchored VWAP starts from a vertical line that you drag to any bar. HOW IT IS CALCULATED For every bar of the cu
FREE
RSI AutoScale is a clean, lightweight RSI for traders who use both TradingView and MetaTrader 5 and want the two charts to look the same. WHAT IT SHOWS - RSI (Wilder smoothing): the same values as the standard RSI, with any applied price. - Signal line on the RSI: SMA, EMA, SMMA or LWMA, with its own period. - Levels: upper, middle and lower lines (70 / 50 / 30 by default). They use MT5's native levels, so they reach the right edge and their values appear on the scale. - Zone fills: the middle
FREE
Candle Countdown Tag with Spread shows how long the current candle has left, in a small colored tag right next to the last candle - the way TradingView shows its bar countdown. The same tag can also show the current spread, the time left of up to two more timeframes and the open time of the next candle. It is a display tool for MetaTrader 5: no alerts, no signals, no trading. WHAT IT SHOWS - Time left of the chart timeframe: mm:ss under one hour, hh:mm:ss under one day, "2d 04:15:30" for longe
FREE
Stoch RSI Band Fill is a Stochastic RSI indicator for MetaTrader 5. MT5 does not include a built-in Stoch RSI, so this indicator adds one. It follows the same calculation steps as the built-in Stoch RSI on TradingView and uses the same layout: K and D lines, 80 / 50 / 20 levels and a shaded band between the upper and lower levels. CALCULATION, STEP BY STEP 1. RSI of the selected price (default: close, length 14), smoothed with Wilder's method (RMA). The first average is the simple average of the
FREE
Supertrend Trend Fill with Change Alerts is a TV-compatible Supertrend for MetaTrader 5. It uses the same calculation as the "Supertrend" indicator built into TradingView and draws it the same way: a green line below price in an up trend, a red line above price in a down trend, and a light fill between the line and the middle of each candle body. Supertrend shows the direction of the trend. It is a charting aid, not a buy or sell signal, and it does not predict where price will go. HOW IT IS C
FREE
Prior Day Week Month Levels with Touch Alerts draws the previous day, week and month high and low on your MetaTrader 5 chart as clean horizontal lines with labels at the right edge, in the style of TradingView. It can also show the previous day's close and today's open. LEVELS - PDH / PDL: previous day high and low (blue #2962FF, solid) - PWH / PWL: previous week high and low (orange #FF9800, dashed) - PMH / PML: previous month high and low (purple #9C27B0, dash-dot) - PDC: previous day close (
FREE
Do you mark supply and demand zones by hand and get a slightly different result every time? This free MetaTrader 4 indicator draws them with one fixed rule that is written out in full below, so you can check every zone yourself. The idea: a strong candle (body at least X times ATR) leaves a "base" of 1 to 10 small candles right before it. A bullish strong candle that closes above the base turns it into a demand zone; a bearish one that closes below it turns it into a supply zone. The indicator
FREE
Pivot Points Six Types with Level Alerts is a TV-compatible pivot point indicator for MetaTrader 5. It uses the same formulas and the same period boundaries as the "Pivot Points Standard" indicator that comes with TradingView, and it draws the levels the same way: short horizontal lines that start at the first bar of each period, with "R1 (price)" style labels in orange (#FB8C00). SIX CALCULATION TYPES The levels are calculated from the high, low and close of the previous period. - Traditional
FREE
MACD Four Color Histogram is a MACD for MetaTrader 5 that uses the same formula and the same look as the built-in MACD on TradingView. It is made for traders who use both platforms and want the MACD on each chart to read the same way. HOW IT DIFFERS FROM THE MT5 STANDARD MACD - MT5 standard MACD: the histogram is the MACD line itself, and the signal line is an SMA. - This indicator: three parts, as on TradingView. MACD line, signal line, and histogram = MACD - signal. The histogram has 4 colors.
FREE
This is the MetaTrader 4 edition of RSI AutoScale. It draws the standard Wilder RSI with a signal line, a shaded band between the levels, colored areas where the RSI leaves that band, and a choice of three scales. It is meant for traders who use TradingView and MetaTrader 4 side by side and want the RSI pane to look much the same on both. HOW IT LOOKS ON MT4 - RSI line: the same values as MT4's built-in RSI for the same period and applied price. - Signal line: a moving average of the RSI (SMA, E
FREE
Supertrend Trend Fill with Change Alerts MT4 brings a TV-compatible Supertrend to MetaTrader 4. If you also use TradingView, you know its built-in "Supertrend": a green line under price while the trend is up, a red line over price while it is down, and a soft colored band between the line and the candles. This MT4 indicator reproduces that calculation and that look. What it is for: seeing the current trend direction and where it would flip. What it is not: a buy or sell signal or a forecast. A
FREE
VWAP Band Fills with Anchored VWAP MT4 brings the VWAP of TradingView to MetaTrader 4. If you use TradingView's built-in "VWAP", you will find the same inputs here (Anchor Period, Source, Offset, Bands Calculation Mode, Bands Multiplier #1 to #3, Hide VWAP on 1D or Above), the same formula (Pine ta.vwap) and the same colors - plus an anchored VWAP that starts wherever you drag a vertical line. THE FORMULA Within each anchor period, bar by bar: VWAP = sum(source x tick volume) / sum(tick volume
FREE
A MetaTrader 4 MACD built to read like the MACD you see on TradingView: a MACD line, a signal line, and a histogram of the gap between them, colored in four shades. If you switch between the two platforms during the day, the MACD pane on your MT4 chart will look and behave the way you are used to. WHY NOT THE MT4 BUILT-IN MACD? MT4's own MACD draws the MACD line as gray bars and smooths the signal line with an SMA. There is no separate histogram and no color change. This indicator calculates the
FREE
Prior Day Week Month Levels with Touch Alerts MT4 puts yesterday's, last week's and last month's high and low on your MetaTrader 4 chart, drawn the way TradingView users are used to seeing them: thin horizontal lines with a short label and price at the right edge. Optional extras: previous day close and today's open, and an alert when price touches a line. WHAT YOU SEE Line | Meaning | Default look PDH | previous day high | blue #2962FF, solid PDL | previous day low | blue #2962FF, solid PWH |
FREE
MetaTrader 4 ships with a Stochastic and an RSI, but not with a Stochastic RSI. This indicator fills that gap for MT4 users and is built to be TV-compatible: it follows the calculation of the Stoch RSI that comes with TradingView, and the pane looks the way TradingView users expect - a blue K line, an orange D line, dashed 80 and 20 levels, a dotted 50 line and a light band between 80 and 20. WHAT APPEARS IN THE SUBWINDOW - K and D lines. The Data Window lists only K and D. - Upper band (80) a
FREE
Directional Movement DMI with Cross Alerts MT4 brings a TV-compatible DMI to MetaTrader 4. If you also chart on TradingView, you know its built-in "Directional Movement Index": a pink ADX line, a blue +DI line and an orange -DI line in a panel under the price. This MT4 indicator uses the same formula, the same defaults and the same colors. What it is for: reading how strong the recent movement has been (ADX) and whether upward (+DI) or downward (-DI) movement has been larger. What it is not: a
FREE
Pivot Points Six Types with Level Alerts MT4 brings TV-compatible pivot points to MetaTrader 4. If you also chart on TradingView, you know its built-in "Pivot Points Standard". This MT4 indicator reproduces it: the same six calculation methods, the same period choices from one day to ten years, and the same look - an orange (#FB8C00) line for each level, starting at the beginning of each period, labelled like "S2 (1.08345)". WHICH LEVELS EACH METHOD GIVES Method | Levels drawn | Note Tradition
FREE
Ichimoku Cloud Fill with Cross Alerts MT4 brings a TV-compatible Ichimoku Cloud to MetaTrader 4. If you also chart on TradingView, you know its built-in "Ichimoku Cloud": five lines and a soft green or red cloud. This MT4 indicator reproduces that calculation, the same defaults and the same placement of the spans, and fills the cloud with solid color bars instead of hatching. What it is for: seeing where price stands against the middle of recent ranges and how the cloud ahead is shaped. What it
FREE
Candle Countdown Tag with Spread MT4 puts a TradingView-style countdown on your MT4 chart: a small tag beside the last candle that tells you when the bar closes, together with the current spread. Optional extra lines show the time left of two more timeframes and when the next candle opens. Nothing else - it does not trade, alert or give signals. ONE TAG, UP TO FIVE LINES Line | Example | Setting Chart timeframe | 12:41 | on by default Extra timeframe 1 | H4 02:12:41 | off (choose a timeframe t
FREE
Dow Structure MTF shows the Dow theory trend of five timeframes at once in MetaTrader 4, using the pullback low / rally high method that is common among Japanese traders. For each timeframe it shows whether the trend is up, down or range, which price would change it, and how far the current price is from that price. Only closed bars are used, so a confirmed result does not change afterwards (no repaint). It is meant for traders who check the trend structure of several timeframes by hand and wan
Fibo Price Time Zones for MetaTrader 4 combines Fibonacci price levels with Fibonacci time targets and draws them on the chart as boxes (price x time zones). Where boxes from several waves and from up to two higher timeframes overlap, the area is emphasized in three levels. It is meant for MT4 traders who already use Fibonacci retracements and extensions and also want to see roughly when a level is worth watching. It is a display tool only: it gives no buy or sell signals and does not place ord
Time Average Lines draws four averages measured by time, not by the number of bars, so each line keeps the same length of time when you switch timeframes: a time moving average, a TWAP, a same-time-of-day average and a time-based EMA. For the same-time average, the rest of today is shown as a dotted path that joins the past averages; the path is a summary of the past, not a forecast. It is meant for intraday traders who want averages that mean the same thing on M1 and on M15, and who want to co
Auto Trendline Channel MTF draws trendlines, parallel channels and horizontal support / resistance automatically from confirmed swing highs and lows in MetaTrader 4, and records for each line the touch count, close breaks, wick breaks and retests. A table shows, for the chart timeframe and two higher timeframes, the nearest line above and below the price, the distance to it and the Dow theory direction. It is meant for traders who draw trendlines and levels by hand and want them drawn by fixed,
Currency Strength Meter for MetaTrader 4 combines the 28 pairs of the 8 major currencies (USD, EUR, JPY, GBP, AUD, NZD, CAD, CHF) into one strength line per currency, with a ranking table for the chart timeframe, M15, H1, H4 and D1. The full formula is published below. It is meant for MT4 traders who compare currencies before choosing which pair to look at, and who want to know exactly how the numbers are made. It is an analysis aid: it does not tell you when to buy or sell and does not show fu
Trade History Stats Panel for MetaTrader 4 reads the closed trades in your own account history and sums them up in a panel on the chart: number of trades, win rate, profit factor, average P/L per trade, drawdown of the closed-trade curve, holding time, buy / sell, and tables by month, symbol, weekday and hour. It is meant for traders who want to look back at their own past trades, like a trading journal that fills itself in, and to check the numbers by period, symbol or magic number. It never p
Prop Challenge Loss Tracker for MetaTrader 4 shows, in a panel on the chart, how much room is left before the daily loss limit and the maximum loss limit of a funded-account (prop) challenge are reached, and sends staged alerts as the limits are used up. It is meant for traders taking a prop challenge who want to see their remaining loss room at a glance, set to the rules of their own program. It is a display and alert tool only: it never opens, modifies or closes any order. Whether a limit is
Market Structure Liquidity Map for MetaTrader 4 draws smart money concepts (SMC) style market structure on the chart: swing labels, break of structure (BOS), change of character (CHoCH), equal highs and lows, previous day and week levels, liquidity sweeps and unfilled fair value gaps (FVG), with a small table for the chart timeframe and two higher timeframes. It is meant for MT4 traders who read structure and liquidity by hand and want the same levels drawn the same way every time. It is a disp
Filter:
No reviews
Reply to review