Alpha Regime Meter
- Indicators
- Version: 1.0
- Activations: 5

Is the market trending up or down, quiet or volatile? Alpha Regime Meter answers that for every bar with one of four colours, and shows it for M15, H1, H4 and D1 at once. A built-in cost check tells you when the spread eats too much of a typical bar to trade that timeframe. No repaint.
Most strategies work in one kind of market and lose in another. A breakout system likes a volatile trend; a scalper suffers when the spread is a big slice of the bar. Alpha Regime Meter does not give buy or sell signals. It tells you which market you are in, so you can decide whether your strategy belongs there.
THE FOUR REGIMES
- UP quiet (green): price above its long average, volatility normal or low
- UP volatile (gold): price above its average, volatility in the top part of its own history
- DOWN quiet (red): price below its average, volatility normal or low
- DOWN volatile (purple): price below its average, volatility high
HOW IT DECIDES
- Direction: close against a long moving average (200 by default). To flip, price must clear the average by a band of 0.5 x ATR, so a market chopping around the average does not flip every bar.
- Volatility: ATR as a percentage of price, ranked against its own last 250 bars. At the 70th percentile or above the market is volatile, and it stays volatile until the rank falls 10 points below that, so the colour does not flicker.
WHAT YOU SEE
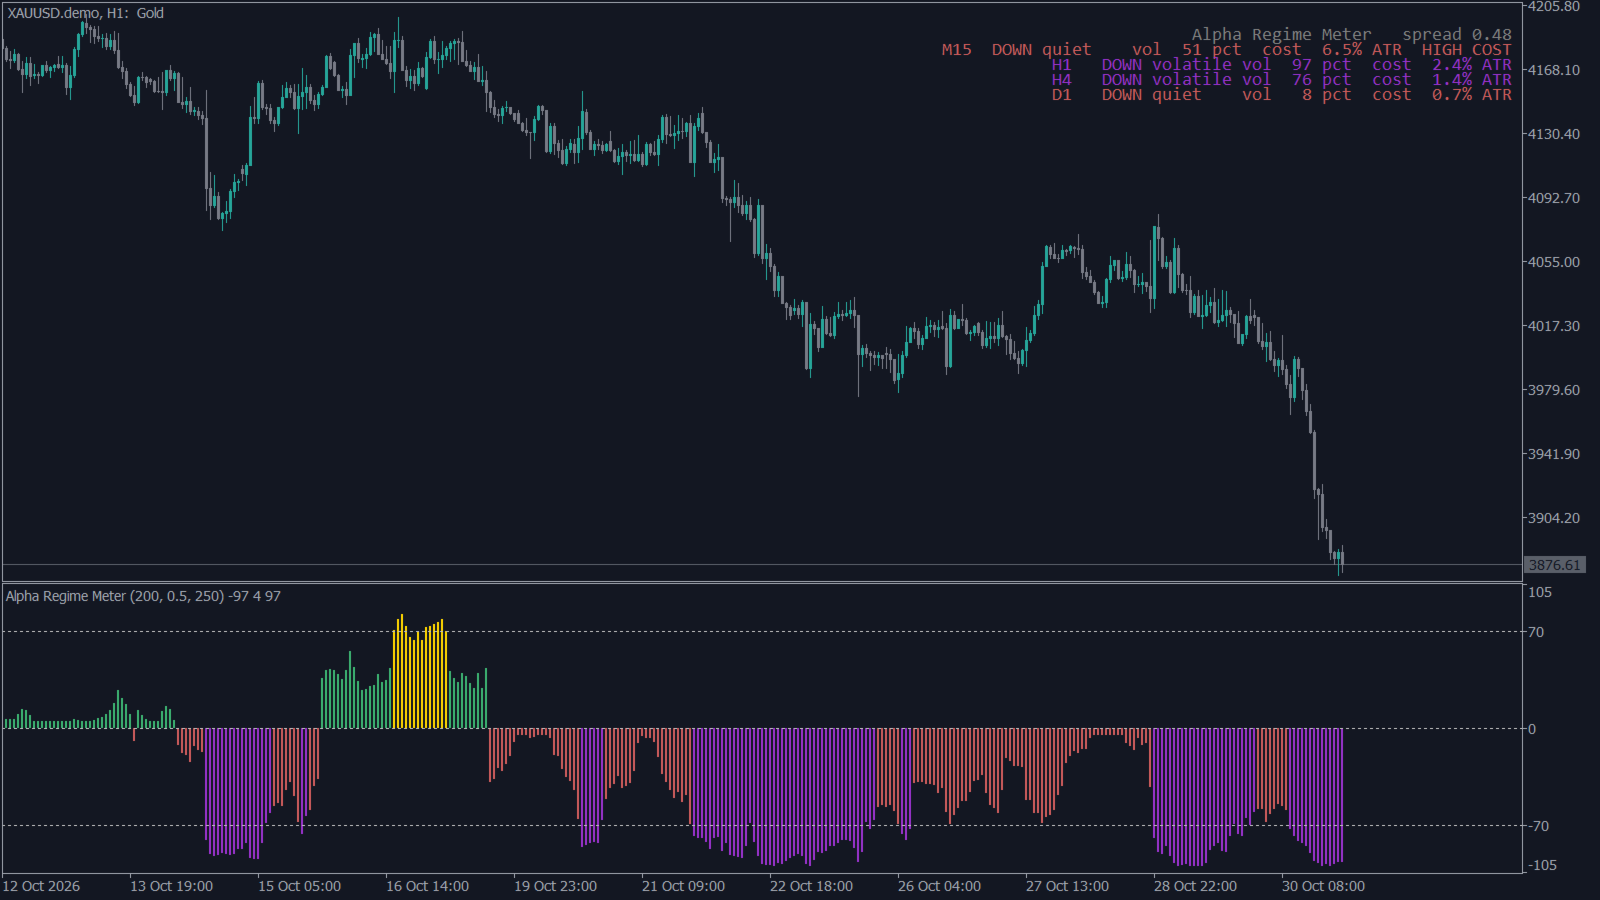
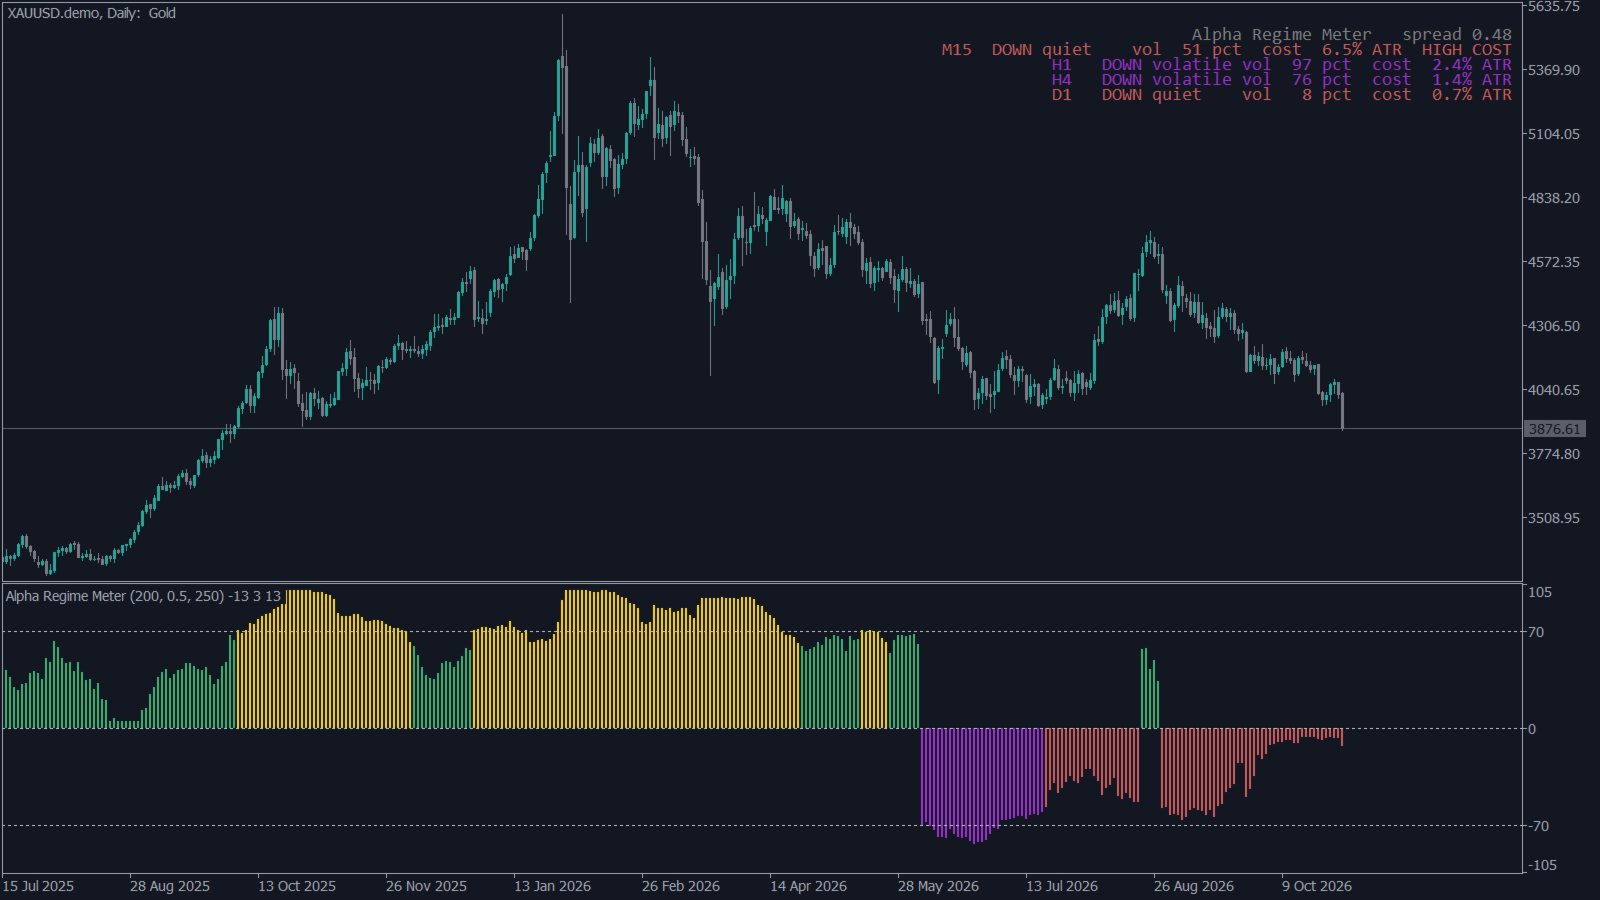
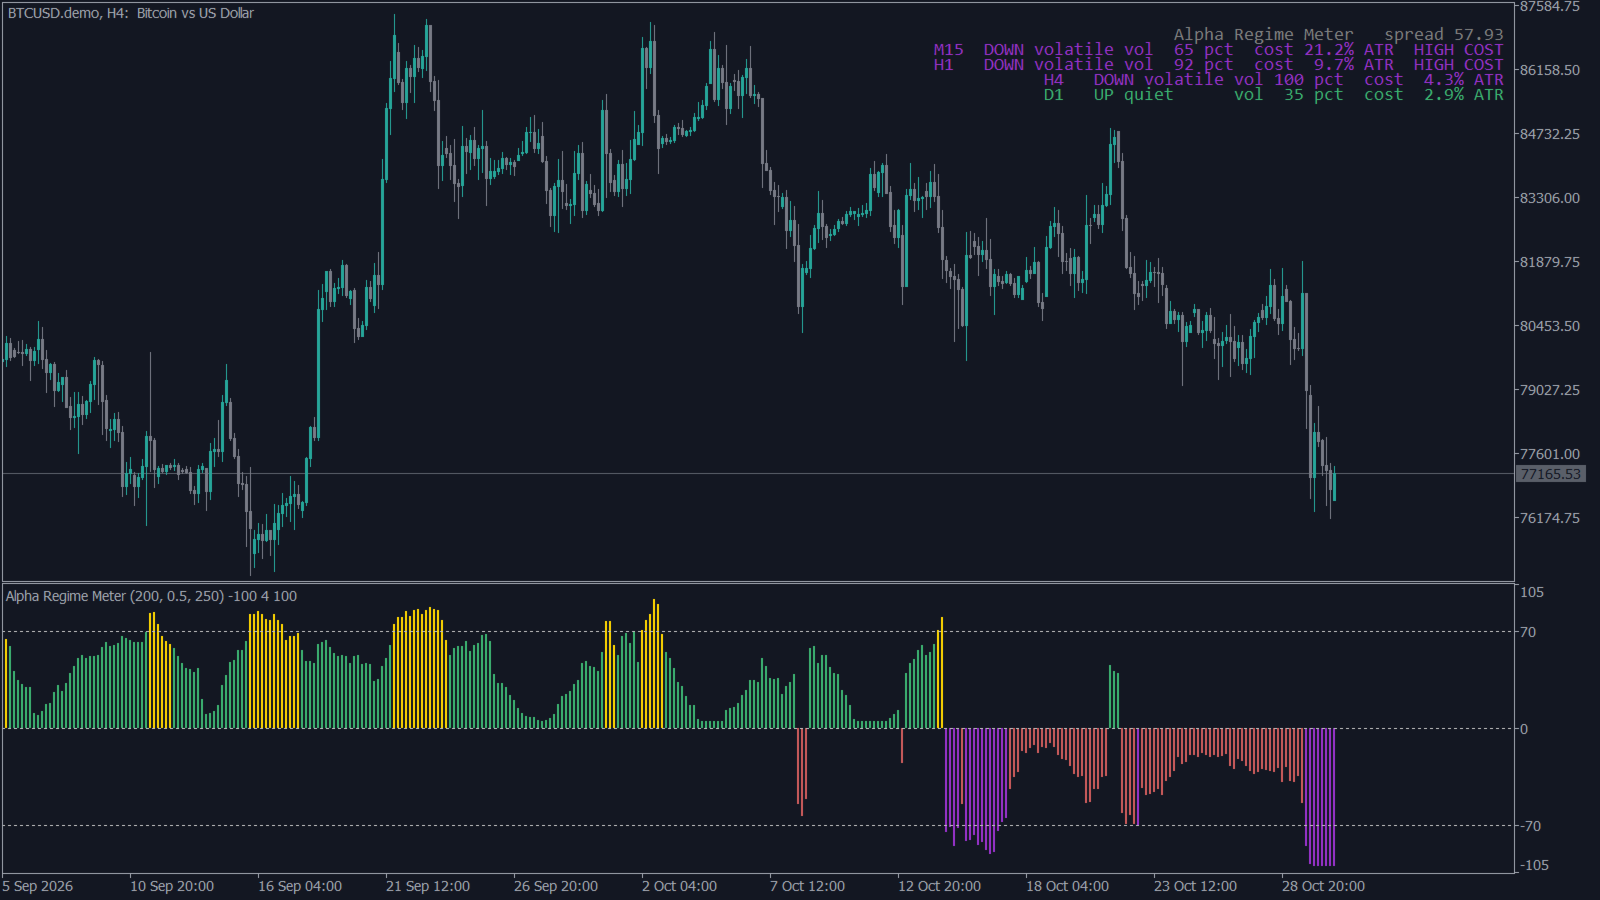
- Histogram in its own window: bar height = volatility percentile, above zero for up, below zero for down, coloured by regime
- Panel on the main chart: regime, volatility percentile and trading cost for each timeframe you list
- Cost check: spread as % of each timeframe's ATR, with a HIGH COST flag above your limit (5% by default)
HOW TRADERS USE IT
- Direction filter: take buys only in UP regimes and sells only in DOWN regimes, or stand aside
- Position size: trade smaller when the regime is volatile
- Timeframe choice: avoid timeframes flagged HIGH COST, where the spread takes too much of each bar
- Multi-timeframe view: see at a glance whether M15, H1, H4 and D1 agree
TESTED, NOT PROMISED
In our tests (gold H1, gold D1 2020-2025, EURUSD M5), bars marked volatile were followed by 25-63% higher average volatility over the next 20 bars than bars marked quiet. The regime describes the market you are in. It is not a forecast of direction.
SETTINGS
- Trend moving average period (200)
- Anti-whipsaw band, x ATR (0.5)
- Volatility lookback, bars (250)
- Volatile percentile (70)
- Panel timeframes ("M15,H1,H4,D1", empty = no panel)
- Cost warning, % of ATR (5)
- Alerts on a regime change: off, popup, push to phone, email
- Colours for each regime
FOR EA DEVELOPERS
iCustom buffers: 0 histogram value, 1 colour index, 2 regime code 1-4, 3 ATR percentile 0-100. Values on closed bars never change.
Works on any symbol and timeframe. Needs about 450 bars of history (200 for the average + 250 for the volatility rank).
Pairs well with Alpha Swing Levels: let the regime decide the direction, and use the swing levels for stops and trailing.