MTF Pivot Projection
- Indicators
- Version: 3.0
- Activations: 20

Multi-Timeframe Market Structure and Forward Pivot Analysis
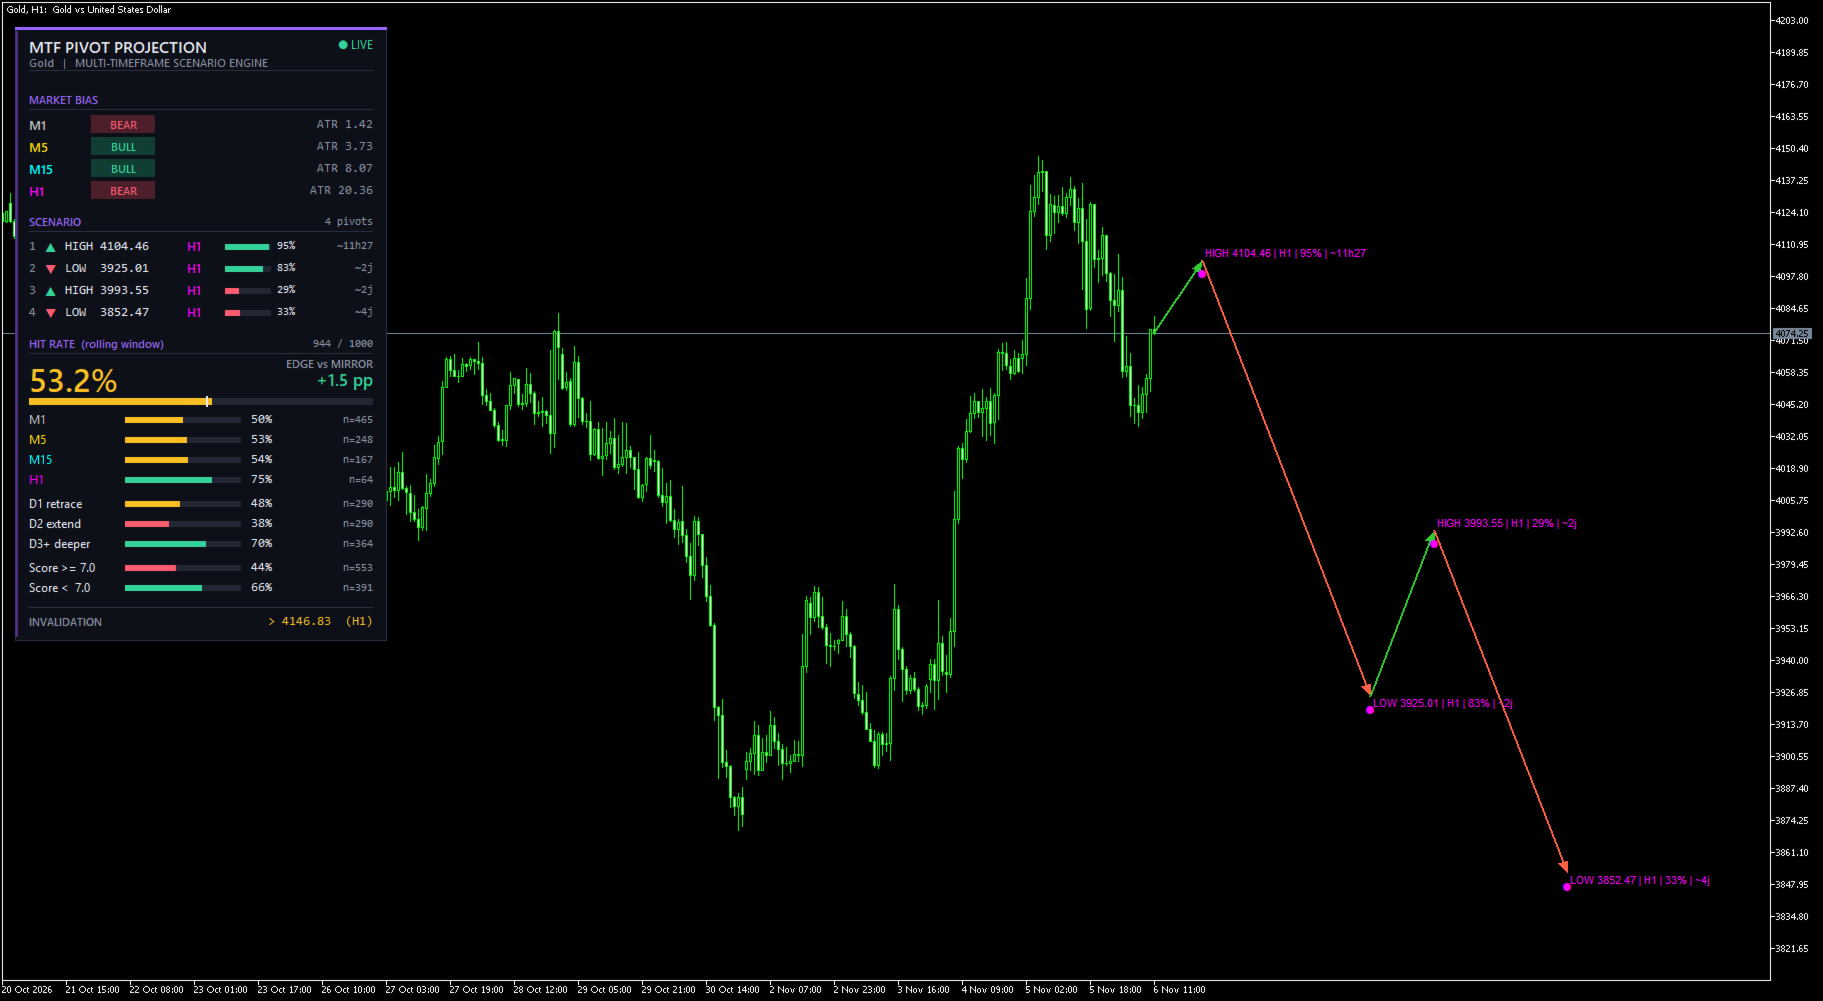
MTF Pivot Projection is a technical analysis indicator designed to combine multi-timeframe market structure, Fibonacci levels, Order Blocks and Fair Value Gaps into a single projected price path.
Instead of displaying independent pivot levels from multiple timeframes, the indicator builds one continuous sequence of potential future swing highs and lows, from the nearest projected retracement to subsequent extension targets.
The indicator also includes a performance tracking system that evaluates whether previously projected target zones were reached and compares the results with a mirrored reference target.
Main Features
1. Multi-Timeframe Pivot Analysis
Analyze four independently configurable timeframes simultaneously. The default configuration uses M1, M5, M15 and H1.
Each timeframe contributes its own market structure and projection candidates.
2. Unified Projected ZigZag
The indicator combines the projections from all selected timeframes into a single chronological path.
The projected path alternates between potential swing highs and swing lows, providing a visual representation of possible future price movements.
3. Fibonacci Retracements and Extensions
Retracement levels are used to calculate potential pullback targets.
Extension levels are used to estimate possible continuation targets.
The Fibonacci levels can be customized through the indicator settings.
4. Order Blocks and Fair Value Gaps
The indicator identifies unmitigated bullish and bearish Order Blocks and Fair Value Gaps.
These zones contribute to the confluence score and can be displayed directly on the chart.
5. Confluence Scoring
Each projected pivot receives a score based on several factors:
-
Fibonacci level weighting.
-
Order Block confluence.
-
Fair Value Gap confluence.
-
Market bias on the originating timeframe.
-
Higher-timeframe directional bias.
-
Distance from the current market price.
The displayed percentage is a normalized visual score. It is not a statistical probability of success.
6. Historical Performance Tracking
The indicator records the outcome of projected pivots over a rolling observation window.
A target is considered reached when price enters its configured tolerance zone before the projection expires or its invalidation condition occurs.
A mirrored reference target is also tracked to provide a comparison baseline.
The dashboard displays overall performance and additional statistics by timeframe, projection depth and score category.
7. Historical Backfill and Persistent Statistics
The indicator can reconstruct historical projection outcomes when first initialized.
Statistical records are saved locally and reused when the indicator is loaded again.
8. Integrated Dark Dashboard
A modern dashboard provides a compact overview of projected pivots and historical statistics without requiring separate windows.
Recommended Usage
MTF Pivot Projection is intended as an analytical tool for traders who use market structure, Fibonacci analysis and Smart Money Concepts.
It can be used on different chart timeframes. The analysis timeframes are configured independently from the chart timeframe.
The default M1, M5, M15 and H1 configuration is suitable as a starting point for intraday analysis.
Important Information
This indicator does not execute trades or provide guaranteed trading signals.
Projected pivots are analytical estimates based on the latest available market structure and selected confluences. They may change when new market data becomes available.
The displayed historical hit rate describes the indicator's own target-touch evaluation methodology. It does not represent a trading win rate or guarantee future performance.
Always use independent risk management and evaluate the indicator on your preferred instrument and trading conditions.
1. Installation
-
Download and install the indicator through the MetaTrader 5 Market.
-
Open MetaTrader 5.
-
Open the Navigator window.
-
Locate MTF Pivot Projection under Indicators.
-
Drag the indicator onto the desired chart.
-
Allow the indicator to load the required historical data.
The indicator can be attached to different chart timeframes. Its analysis timeframes are configured independently.
2. Understanding the Chart
Projected ZigZag
The projected path starts from the current market price and connects the estimated future pivot points.
-
Green segments represent upward projected movements.
-
Red segments represent downward projected movements.
-
Each projected pivot is marked with its estimated price.
-
Labels display the pivot type, source timeframe, score and estimated time.
The projections are estimates and may change as market conditions evolve.
Timeframe Colors
Each timeframe has its own marker and label color.
Default configuration:
-
M1: Silver
-
M5: Gold
-
M15: Aqua
-
H1: Magenta
Order Blocks
Order Blocks are displayed as colored chart zones.
-
Bullish Order Blocks represent potential demand areas.
-
Bearish Order Blocks represent potential supply areas.
Fair Value Gaps
Fair Value Gaps are displayed as separate colored zones.
-
Bullish FVG: blue.
-
Bearish FVG: purple.
Only zones meeting the indicator's detection and mitigation conditions are displayed.
3. Dashboard
The dashboard provides a summary of the current projected scenario and its historical evaluation.
The main statistics include:
Hit Rate
Percentage of resolved projected targets that reached their target zone before expiration or invalidation.
Baseline
A mirrored reference target is evaluated using the same tracking methodology. It provides a comparison against the original projected target.
Timeframe Statistics
Shows the historical results associated with each analysis timeframe.
Projection Depth
Separates statistics according to the position of the projected pivot in the scenario.
Score Categories
Compares projections with higher and lower confluence scores.
Important: the displayed score percentage is a normalized confluence score, not a probability of success.
4. Input Parameters
Analysis Timeframes
-
InpTF0: Lowest analysis timeframe. Default: M1.
-
InpTF1: Second analysis timeframe. Default: M5.
-
InpTF2: Third analysis timeframe. Default: M15.
-
InpTF3: Highest analysis timeframe. Default: H1.
-
InpBars: Number of historical candles analyzed per timeframe. Default: 800.
The selected timeframes should preferably be ordered from lowest to highest.
Market Structure
-
InpPivotStrength: Number of candles used on each side to confirm a pivot. Default: 5.
Higher values generally produce fewer, more selective pivots.
ATR
-
InpATRPeriod: ATR calculation period. Default: 14.
-
InpMaxDistATR: Maximum distance of the first projected pivot, expressed in ATR multiples. Default: 6.0.
Fair Value Gaps
-
InpFVGMinATR: Minimum FVG size relative to ATR. Default: 0.15.
-
InpMaxZones: Maximum number of detected zones per type and timeframe. Default: 5.
Order Blocks
-
InpOBDispATR: Minimum displacement candle body relative to ATR. Default: 1.2.
-
InpOBLookback: Number of candles searched for the opposing candle. Default: 5.
-
InpOBBodyOnly: Use only the candle body for the Order Block boundaries. Default: false.
Fibonacci
-
InpRetrLevels: Custom Fibonacci retracement levels. Default: 0.382;0.5;0.618;0.786.
-
InpExtLevels: Custom Fibonacci extension levels. Default: 1.0;1.272;1.618.
Separate multiple levels using semicolons.
Projected ZigZag
-
InpChainCycles: Number of projection cycles per timeframe. Default: 2.
-
InpMinScore: Minimum confluence score required for a projected pivot. Default: 4.0.
-
InpMaxNodes: Maximum number of projected pivots. Default: 14.
-
InpPathWidth: Projected path line width. Default: 2.
-
InpShowLabels: Show or hide projected pivot labels. Default: true.
Hit Rate Tracking
-
InpWindow: Rolling number of resolved projected pivots. Default: 1000.
-
InpHitTolATR: Target-zone tolerance relative to ATR. Default: 0.25.
-
InpTimeoutMult: Maximum tracking duration multiplier based on estimated time. Default: 3.0.
-
InpTimeoutMinBars: Minimum tracking duration in timeframe candles. Default: 5.
-
InpHiScore: Threshold separating higher-score and lower-score statistics. Default: 7.0.
-
InpMaxOpen: Maximum number of simultaneously tracked projections. Default: 600.
Historical Backfill
-
InpBackfill: Reconstruct historical statistics at initialization. Default: true.
-
InpForceBackfill: Force a complete reconstruction instead of loading saved history. Default: false.
-
InpBackfillBars: Number of lowest-timeframe candles used for reconstruction. Default: 5000.
-
InpBackfillStep: Number of candles between replay steps. Default: 10.
-
InpBackfillPerTick: Number of replay steps processed per timer cycle. Default: 3.
If the terminal becomes slow during reconstruction, reduce InpBackfillPerTick or increase InpBackfillStep.
Order Block and FVG Display
-
InpShowOB: Show or hide Order Blocks. Default: true.
-
InpShowFVG: Show or hide Fair Value Gaps. Default: true.
-
InpZoneDistATR: Maximum distance for displaying zones. Default: 4.0.
-
InpZoneExtend: Zone extension in chart candles. Default: 15.
-
InpHideLowerTF: Hide zones and structures from timeframes lower than the current chart timeframe. Default: true.
Dashboard
-
InpShowDashboard: Enable or disable the dashboard. Default: true.
-
InpDashX: Horizontal dashboard position. Default: 12.
-
InpDashY: Vertical dashboard position. Default: 24.
-
InpDashNodes: Number of projected pivots displayed in the dashboard. Default: 6.
-
InpDashDetails: Display detailed historical statistics. Default: true.
Additional Display Settings
-
InpShowStructure: Display the latest market structure leg for each timeframe. Default: false.
-
InpAutoShift: Automatically enable chart shift to provide space for projected movements. Default: true.
Timeframe and zone colors can also be customized.
5. Historical Statistics
When the indicator starts, it attempts to load previously saved statistical records.
If there is insufficient saved history and historical backfill is enabled, the indicator reconstructs historical projections using available market data.
The backfill process is an approximation based on closed higher-timeframe candles. Its results may differ from the live tracking process.
Statistics are maintained separately for the projected targets and mirrored reference targets.
6. Recommended Configuration
The default configuration is a suitable starting point for intraday analysis:
-
M1
-
M5
-
M15
-
H1
Allow the indicator to load sufficient historical data before interpreting its statistics.
For slower analysis, consider using higher timeframes and adjusting the number of historical candles accordingly.
7. Important Risk Notice
MTF Pivot Projection is a technical analysis indicator. It does not open, modify or close trading positions.
Projected prices, confluence scores and historical hit rates are analytical information only. They do not guarantee that future market movements will reach projected targets.
Market conditions can change rapidly. Always apply your own trading rules and risk management.
The indicator should be evaluated on the instrument, broker feed and timeframes on which it will be used.