MTF Pivot Projection

MTF Pivot Projection

Multi-Timeframe Market Structure and Forward Pivot Analysis

MTF Pivot Projection is a technical analysis indicator designed to combine multi-timeframe market structure, Fibonacci levels, Order Blocks and Fair Value Gaps into a single projected price path.

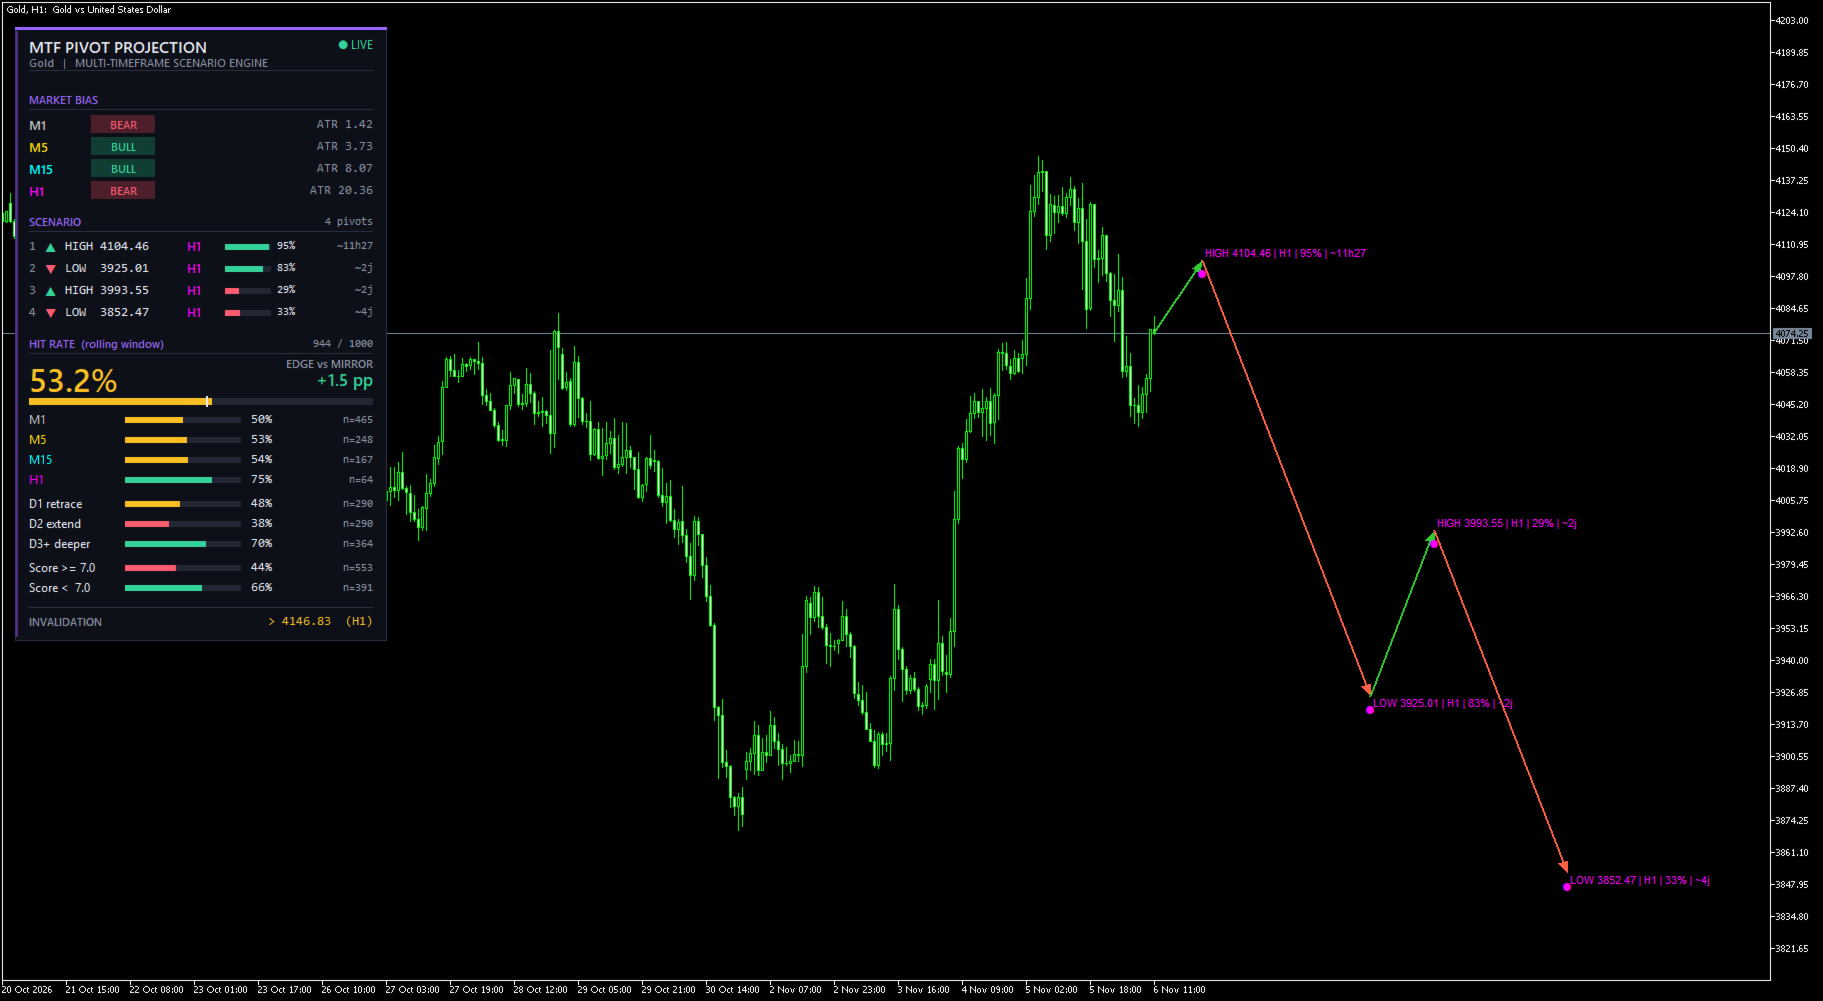
Instead of displaying independent pivot levels from multiple timeframes, the indicator builds one continuous sequence of potential future swing highs and lows, from the nearest projected retracement to subsequent extension targets.

The indicator also includes a performance tracking system that evaluates whether previously projected target zones were reached and compares the results with a mirrored reference target.

Main Features

1. Multi-Timeframe Pivot Analysis

Analyze four independently configurable timeframes simultaneously. The default configuration uses M1, M5, M15 and H1.

Each timeframe contributes its own market structure and projection candidates.

2. Unified Projected ZigZag

The indicator combines the projections from all selected timeframes into a single chronological path.

The projected path alternates between potential swing highs and swing lows, providing a visual representation of possible future price movements.

3. Fibonacci Retracements and Extensions

Retracement levels are used to calculate potential pullback targets.

Extension levels are used to estimate possible continuation targets.

The Fibonacci levels can be customized through the indicator settings.

4. Order Blocks and Fair Value Gaps

The indicator identifies unmitigated bullish and bearish Order Blocks and Fair Value Gaps.

These zones contribute to the confluence score and can be displayed directly on the chart.

5. Confluence Scoring

Each projected pivot receives a score based on several factors:

  • Fibonacci level weighting.

  • Order Block confluence.

  • Fair Value Gap confluence.

  • Market bias on the originating timeframe.

  • Higher-timeframe directional bias.

  • Distance from the current market price.

The displayed percentage is a normalized visual score. It is not a statistical probability of success.

6. Historical Performance Tracking

The indicator records the outcome of projected pivots over a rolling observation window.

A target is considered reached when price enters its configured tolerance zone before the projection expires or its invalidation condition occurs.

A mirrored reference target is also tracked to provide a comparison baseline.

The dashboard displays overall performance and additional statistics by timeframe, projection depth and score category.

7. Historical Backfill and Persistent Statistics

The indicator can reconstruct historical projection outcomes when first initialized.

Statistical records are saved locally and reused when the indicator is loaded again.

8. Integrated Dark Dashboard

A modern dashboard provides a compact overview of projected pivots and historical statistics without requiring separate windows.

Recommended Usage

MTF Pivot Projection is intended as an analytical tool for traders who use market structure, Fibonacci analysis and Smart Money Concepts.

It can be used on different chart timeframes. The analysis timeframes are configured independently from the chart timeframe.

The default M1, M5, M15 and H1 configuration is suitable as a starting point for intraday analysis.

Important Information

This indicator does not execute trades or provide guaranteed trading signals.

Projected pivots are analytical estimates based on the latest available market structure and selected confluences. They may change when new market data becomes available.

The displayed historical hit rate describes the indicator's own target-touch evaluation methodology. It does not represent a trading win rate or guarantee future performance.

Always use independent risk management and evaluate the indicator on your preferred instrument and trading conditions.


MTF Pivot Projection – User Guide

1. Installation

  1. Download and install the indicator through the MetaTrader 5 Market.

  2. Open MetaTrader 5.

  3. Open the Navigator window.

  4. Locate MTF Pivot Projection under Indicators.

  5. Drag the indicator onto the desired chart.

  6. Allow the indicator to load the required historical data.

The indicator can be attached to different chart timeframes. Its analysis timeframes are configured independently.

2. Understanding the Chart

Projected ZigZag

The projected path starts from the current market price and connects the estimated future pivot points.

  • Green segments represent upward projected movements.

  • Red segments represent downward projected movements.

  • Each projected pivot is marked with its estimated price.

  • Labels display the pivot type, source timeframe, score and estimated time.

The projections are estimates and may change as market conditions evolve.

Timeframe Colors

Each timeframe has its own marker and label color.

Default configuration:

  • M1: Silver

  • M5: Gold

  • M15: Aqua

  • H1: Magenta

Order Blocks

Order Blocks are displayed as colored chart zones.

  • Bullish Order Blocks represent potential demand areas.

  • Bearish Order Blocks represent potential supply areas.

Fair Value Gaps

Fair Value Gaps are displayed as separate colored zones.

  • Bullish FVG: blue.

  • Bearish FVG: purple.

Only zones meeting the indicator's detection and mitigation conditions are displayed.

3. Dashboard

The dashboard provides a summary of the current projected scenario and its historical evaluation.

The main statistics include:

Hit Rate

Percentage of resolved projected targets that reached their target zone before expiration or invalidation.

Baseline

A mirrored reference target is evaluated using the same tracking methodology. It provides a comparison against the original projected target.

Timeframe Statistics

Shows the historical results associated with each analysis timeframe.

Projection Depth

Separates statistics according to the position of the projected pivot in the scenario.

Score Categories

Compares projections with higher and lower confluence scores.

Important: the displayed score percentage is a normalized confluence score, not a probability of success.

4. Input Parameters

Analysis Timeframes

  • InpTF0: Lowest analysis timeframe. Default: M1.

  • InpTF1: Second analysis timeframe. Default: M5.

  • InpTF2: Third analysis timeframe. Default: M15.

  • InpTF3: Highest analysis timeframe. Default: H1.

  • InpBars: Number of historical candles analyzed per timeframe. Default: 800.

The selected timeframes should preferably be ordered from lowest to highest.

Market Structure

  • InpPivotStrength: Number of candles used on each side to confirm a pivot. Default: 5.

Higher values generally produce fewer, more selective pivots.

ATR

  • InpATRPeriod: ATR calculation period. Default: 14.

  • InpMaxDistATR: Maximum distance of the first projected pivot, expressed in ATR multiples. Default: 6.0.

Fair Value Gaps

  • InpFVGMinATR: Minimum FVG size relative to ATR. Default: 0.15.

  • InpMaxZones: Maximum number of detected zones per type and timeframe. Default: 5.

Order Blocks

  • InpOBDispATR: Minimum displacement candle body relative to ATR. Default: 1.2.

  • InpOBLookback: Number of candles searched for the opposing candle. Default: 5.

  • InpOBBodyOnly: Use only the candle body for the Order Block boundaries. Default: false.

Fibonacci

  • InpRetrLevels: Custom Fibonacci retracement levels. Default: 0.382;0.5;0.618;0.786.

  • InpExtLevels: Custom Fibonacci extension levels. Default: 1.0;1.272;1.618.

Separate multiple levels using semicolons.

Projected ZigZag

  • InpChainCycles: Number of projection cycles per timeframe. Default: 2.

  • InpMinScore: Minimum confluence score required for a projected pivot. Default: 4.0.

  • InpMaxNodes: Maximum number of projected pivots. Default: 14.

  • InpPathWidth: Projected path line width. Default: 2.

  • InpShowLabels: Show or hide projected pivot labels. Default: true.

Hit Rate Tracking

  • InpWindow: Rolling number of resolved projected pivots. Default: 1000.

  • InpHitTolATR: Target-zone tolerance relative to ATR. Default: 0.25.

  • InpTimeoutMult: Maximum tracking duration multiplier based on estimated time. Default: 3.0.

  • InpTimeoutMinBars: Minimum tracking duration in timeframe candles. Default: 5.

  • InpHiScore: Threshold separating higher-score and lower-score statistics. Default: 7.0.

  • InpMaxOpen: Maximum number of simultaneously tracked projections. Default: 600.

Historical Backfill

  • InpBackfill: Reconstruct historical statistics at initialization. Default: true.

  • InpForceBackfill: Force a complete reconstruction instead of loading saved history. Default: false.

  • InpBackfillBars: Number of lowest-timeframe candles used for reconstruction. Default: 5000.

  • InpBackfillStep: Number of candles between replay steps. Default: 10.

  • InpBackfillPerTick: Number of replay steps processed per timer cycle. Default: 3.

If the terminal becomes slow during reconstruction, reduce InpBackfillPerTick or increase InpBackfillStep.

Order Block and FVG Display

  • InpShowOB: Show or hide Order Blocks. Default: true.

  • InpShowFVG: Show or hide Fair Value Gaps. Default: true.

  • InpZoneDistATR: Maximum distance for displaying zones. Default: 4.0.

  • InpZoneExtend: Zone extension in chart candles. Default: 15.

  • InpHideLowerTF: Hide zones and structures from timeframes lower than the current chart timeframe. Default: true.

Dashboard

  • InpShowDashboard: Enable or disable the dashboard. Default: true.

  • InpDashX: Horizontal dashboard position. Default: 12.

  • InpDashY: Vertical dashboard position. Default: 24.

  • InpDashNodes: Number of projected pivots displayed in the dashboard. Default: 6.

  • InpDashDetails: Display detailed historical statistics. Default: true.

Additional Display Settings

  • InpShowStructure: Display the latest market structure leg for each timeframe. Default: false.

  • InpAutoShift: Automatically enable chart shift to provide space for projected movements. Default: true.

Timeframe and zone colors can also be customized.

5. Historical Statistics

When the indicator starts, it attempts to load previously saved statistical records.

If there is insufficient saved history and historical backfill is enabled, the indicator reconstructs historical projections using available market data.

The backfill process is an approximation based on closed higher-timeframe candles. Its results may differ from the live tracking process.

Statistics are maintained separately for the projected targets and mirrored reference targets.

6. Recommended Configuration

The default configuration is a suitable starting point for intraday analysis:

  • M1

  • M5

  • M15

  • H1

Allow the indicator to load sufficient historical data before interpreting its statistics.

For slower analysis, consider using higher timeframes and adjusting the number of historical candles accordingly.

7. Important Risk Notice

MTF Pivot Projection is a technical analysis indicator. It does not open, modify or close trading positions.

Projected prices, confluence scores and historical hit rates are analytical information only. They do not guarantee that future market movements will reach projected targets.

Market conditions can change rapidly. Always apply your own trading rules and risk management.

The indicator should be evaluated on the instrument, broker feed and timeframes on which it will be used.
추천 제품
SMC Workflow Auto EA
Choawana Malaikitsanachalee
English – Product Description (V1.42) SMC Workflow Auto EA — SR / OB / FVG with BOS–CHOCH Confirmation Smart-Money-Concepts Expert Advisor that trades only when a clean SMC setup appears: Order-Block retest after Break of Structure (BOS / CHOCH) confirmation, with optional SR and Fair Value Gap (FVG) confluence. The EA uses pending limit orders, fixed SL/TP or RR-based exits, step-lock trailing and strict risk-controls designed to pass broker validation. What it does Detects swing structure usi
FREE
Auto Fractal Support And Resistance is a powerful multi-timeframe indicator designed for traders who want to trade lower timeframes with higher timeframe accuracy. When your mouse cursor is on a line you can easily see fractal describtion and index of fractal candle  and timeframe of that fractal candle.  This indicator automatically detects H1 and D1 fractal levels and draws clean horizontal support and resistance lines on any lower timeframe chart (M1, M5, M15, M30). Now you can see where the
LT Support Resistance - 지지와 저항을 100% 자동으로 식별 수동으로 지지와 저항선을 그리느라 귀중한 시간을 낭비하는 데 지치셨나요? 아니면 매번 중요한 레벨을 놓쳐서 답답하셨나요? LT Support Resistance는 이러한 번거로운 작업을 없애기 위해 개발되었습니다. 여러 타임프레임(시간족)을 동시에 분석하여, 거래 중인 자산의 가장 중요한 구역을 자동으로 식별하고 차트에 표시해 줍니다. == 중요 레벨의 스마트 자동화 == 주관적이고 시간이 오래 걸리는 수동 라인 작도 대신, 본 지표는 과거 가격 데이터를 분석하여 유의미한 반전 포인트를 식별하고, 가격이 '실제'로 신뢰하고 반응하는 지지 및 저항선을 그려줍니다. 그 결과 데이터에 기반한 객관적이고 신속한 분석이 가능해집니다. == 주요 특징 == 100% 자동 감지: 수동 분석 없이도 지지/저항 레벨 식별 멀티 타임프레임(MTF): M5 차트에서 H1, H4, D1, W1 레벨을 동시에 시각화 스마트 알
Supply and Demand with Fibonacci and Classic Pivot What it does This indicator draws supply and demand zones on your chart from pivot points. Ordinary pivot indicators draw thin lines. This one draws zones (price areas), because price usually reacts to an area and rarely to one exact price. You can show up to 10 different periods at once (for example H1, H4, Daily and Weekly), and the indicator highlights the places where zones from different periods overlap. Main features Fibonacci pivots, Clas
Elliott Wave Pro X
Murtadha Majid Jeyad Al-Khuzaie
Elliott Wave Pro X Professional Automatic Elliott Wave Analysis for MetaTrader 5 Elliott Wave Pro X is an advanced automatic Elliott Wave indicator designed for traders who want to identify high-probability market structures with precision and confidence. The indicator continuously analyzes price action and applies Elliott Wave rules and guidelines to detect impulse waves, corrective patterns, diagonals, triangles, and complex market corrections. The indicator helps traders understand the cur
Forex Uncovered
Marian Beceanu
Forex Uncovered PRO v4.60 Professional Support & Resistance Breakout Indicator for MetaTrader 5 Overview Forex Uncovered PRO v4.60 is a professional Support & Resistance Breakout indicator built for MetaTrader 5. Unlike traditional trend indicators, Forex Uncovered focuses on Price Action by automatically identifying significant swing highs and swing lows, building dynamic support and resistance zones, and detecting confirmed breakout opportunities. To reduce false signals, the indicator combine
Caicai L&S Yield Histogram Important Notice: This indicator is an integral tool of the automated EA Caicai Long and Short Pair Trading . This indicator visually displays the percentage deviation (Yield %) of a pair's current spread relative to its own historical mean. It is an excellent tool for quickly visualizing the gross financial potential of a market distortion in Long & Short operations. Main Features: Percentage Visualization: Understand the size of the distortion in palpable percentage
这是一个基于前一个交易日的最高价、最低价和收盘价来计算的枢轴点指标,具体公式如下: 计算前一日的 Pivot Point (枢轴点): Pivot = (High + Low + Close) / 3 计算 Resistance 1 (R1) 、 Support 1 (S1) ​ 等: R1 = (2 * Pivot) - Low S1 = (2 * Pivot) - High R2 = Pivot + (High - Low) S2 = Pivot - (High - Low) 与市面上其他的枢轴点指标相比,该指标主要有以下4个特点: 1、可以修改交易日的开始时间; 2、可以设定支撑压力线的颜色; 3、可以设定是否显示各个支撑压力线对应的价格; 4、可以设定天数用以显示枢轴点的历史记录; 开发这个指标的最初目的是为了解决设定交易日开始时间的问题,接下来会进一步说明。基于计算公式,我们需要获得上一个交易日的最高价、最低价和收盘价,在夏令时,北京时间6点是开市时间,大多数交易平台服务器的0点对应的是北京时间的6点,但是香港的服务器6点才是对应的是北京时间的6点。如果你有多个平台,且存在
Unmask Institutional Market Shifts with Precision Institutional Divergence Reversal Pro Most divergence indicators fail because they are "noisy"—they find every tiny curve in the market, leading to false signals. Institutional Divergence Reversal Pro is engineered to filter out retail noise and identify high-probability reversal zones where "Smart Money" is active. By combining multi-timeframe monitoring with a proprietary Quality Scoring System , this tool ensures you only focus on the setups t
Larry Williams
Danrlei Hornke
Created by trader and journalist Larry Williams, Setup 9.1 is a simple strategy that is easy to understand and execute, which is why it is so well known and popular in the world of traders and technical analysis. It is a REVERSION setup, where operations are sought when the moving average changes direction. Setup Logic With the open candlestick chart, at any time chart, it is only necessary to add the 9-period Exponential Moving Average (MME9). That done, we look for assets in which the MME9
“상위 차트의 트렌드 방향을 확인하고 싶은데, 매번 차트 시간 프레임을 바꾸는 게 귀찮아요~” 그런 당신을 위해 이 상품이 존재합니다!! Trend Map 상품 개요 각 시간 프레임(또는 각 프랙탈 구조)에서 트렌드 방향을 기록하여 항상 차트 위에 표시할 수 있는 도구입니다. 시간 프레임을 변경해도 패널 표시가 그대로 유지되어, 자주 시간 프레임을 바꾸며 차트를 보는 분들께 추천합니다. 트레이드 시 빠르게 트렌드 방향을 확인할 수 있어 스트레스 없이 트레이드할 수 있습니다. 또한 각 시간 프레임(프랙탈 구조)의 고가와 저가를 인식하는 라인을 원터치로 생성 및 삭제할 수 있습니다. 자동 매매 기능은 없으며, 트레이드 보조 도구로 사용하세요. 기능 설명 ① 패널 유닛 패널 UI 전체 중 세로 한 열을 의미합니다. 최대 10개까지 표시 가능합니다. 각 유닛마다 테마 컬러를 설정할 수 있습니다. ② 설명 라벨 패널 유닛 가장 상단의 라벨입니다. 시간 프레임 표시 등 원하는 텍스트를 설정할
N/B: All our product purchase comes with our free ‘’DAILY   SCALPER EA’’ -   bit.ly/4qlFLNh Whatsapp Developer for yours after successful purchase The Holy Grail MotherBar Indicator: Your Ultimate Path to Consistent Trading Profits   The Problem With Every Other Indicator You've Tried Let me guess - you've spent countless hours and hundreds (maybe thousands) of dollars on indicators that promise the world but deliver mediocre results. You've tried: · Lagging indicators that tell you what
상위 차트주기 기반 프랙탈 레벨은 상위 차트주기의 프랙탈을 기반으로 정확한 지지 및 저항 수준을 구축하도록 설계된 강력한 도구로, 편리한 알림과 함께 매수 및 매도 신호를 제공합니다. 사용 방법: 이 인디케이터는 상위 차트주기의 프랙탈 레벨을 분석하여 현재 차트에 표시합니다. 지표 속성에서 선임 주기를 쉽게 조정하여 전략에 대한 정확성과 관련성을 극대화할 수 있습니다. 상위 차트주기를 기준으로 프랙탈 레벨을 사용할 때의 이점: 조기 신호 감지: 더 낮은 차트주기에서 더 높은 차트주기 프랙탈 레벨을 볼 수 있으므로 잠재적 매수 및 매도 신호를 초기에 식별할 수 있습니다. 수익/손실률 개선: 짧은 차트주기에 조기 진입하면 손절가를 더 짧게 설정할 수 있어 트레이딩 효율이 크게 향상됩니다. 편리한 알림: 중요한 신호를 놓치지 마세요 - 진입 및 청산 기회에 대한 알림을 즉시 받을 수 있습니다. 분석 정확도 향상: 정말 중요한 핵심 레벨에 집중하고 불필요한 시장 잡음은 무시하세요.
ZigZag Market Structure Breakout Pro ZigZag Extras Display BreakOut points is a MetaTrader 5 indicator for traders who use ZigZag, breakout points, market structure, BOS, CHoCH, swing high, swing low, support and resistance, and higher timeframe bias in their trading analysis. Main Benefits Displays confirmed ZigZag swing highs and swing lows Marks BOS Up, BOS Down, CHoCH Up and CHoCH Down Shows Depth Highest High and Depth Lowest Low lines Adds HH, HL, LH and LL structure labels Includes HTF bi
Delivery State Change Map
Martin Alberto Nunez Da Silveira Van Caester
CISD Delivery Map displays Change in State of Delivery levels from two configurable timeframes and summarizes whether the active context is aligned or mixed. Main functions - Two configurable timeframes; defaults are M15 and H1. - Bullish and bearish CISD detection. - ATR displacement filter for confirmation. - Configurable search for the delivery origin. - Active-level and broken-level management. - Forward projection of confirmed levels. - Multi-timeframe alignment dashboard. - Optional popu
HTF Open Markers + ICT Silver Bullet Zones — Usage & Strategy Guide What it draws Session 1 / Session 2 lines : vertical lines at the open of every bar on two independently configurable higher timeframes (defaults: H4 and D1), including a projected line for the rest of today's not-yet-opened bars on sub-daily timeframes, so you can see where the next candle will open before it happens. ICT Silver Bullet zones : shaded rectangles over the three classic ICT kill-zone windows, converted from New Yo
FREE
Future Predictor MT5
Shukurjon Beknazarov
미래 예측기 - 과거 유사 예측 지표 개요 미래 예측기는 최근 가격 패턴을 과거 유사 패턴과 비교하고 그 이후의 추이를 요약하여 보여줍니다. 매수, 매도, 중립 확률, 경험적 범위가 포함된 예상 가격 경로, 그리고 해당 예측의 근거가 된 과거 패턴 목록을 제공합니다. 모든 결과는 과거 데이터를 기반으로 한 통계적 추정치이며, 미래의 결과를 보장하지 않습니다. 작동 방식 1. 패턴 포착: 최근 N개 캔들(시가, 고가, 저가, 이전 종가 대비 종가)을 ATR로 스케일링하여 다양한 변동성 조건을 비교할 수 있습니다. 2. 인과관계 탐색: 과거의 이력만 탐색하며, 결과가 이미 알려진 유사 사례만 고려합니다. 미래 데이터는 사용하지 않습니다. 유사 사례들은 시간적 간격을 두고 발생하므로, 동일한 시장 상황이 중복 계산되지 않습니다. 3. 가중치: 형태가 더 유사한 제품에 더 큰 가중치를 부여합니다. 선택적으로 최근 제품에 가중치를 부여하여 새로운 유사 제품에 더 큰 가중치를 줄 수
Atbot
Zaha Feiz
4.69 (55)
AtBot: 작동 방식 및 사용 방법 ### 작동 방식 MT5 플랫폼용 "AtBot" 지표는 기술 분석 도구의 조합을 사용하여 매수 및 매도 신호를 생성합니다. 01:37 단순 이동 평균(SMA), 지수 이동 평균(EMA), 평균 진폭 범위(ATR) 지수를 통합하여 거래 기회를 식별합니다. 또한 Heikin Ashi 캔들을 사용하여 신호의 정확성을 향상시킬 수 있습니다. 구매 후 리뷰를 남기면 특별 보너스 선물을 받게 됩니다. ### 주요 기능: - 비재표시: 신호는 플로팅 후 변경되지 않습니다. - 비재작성: 신호는 일관되며 변경되지 않습니다. - 지연 없음: 지연 없이 시기적절한 신호를 제공합니다. - 다양한 시간대: 거래 전략에 맞게 모든 시간대에서 사용할 수 있습니다. ### 운영 단계: #### 입력 및 설정: - firstkey (TrendValue): 추세 감지의 민감도를 조정합니다. - Secondkey (SignalValue): 매수/매도 신호 생성의 민감도를 정의
Eazy RSI Divergence
Gawain Athur Stephan Cloete
Eazy Divergence is a non-repainting MT5 indicator designed to automatically detect and plot Regular and Hidden divergence signals in real time Key Features Dual-Window Plotting: Displays divergence trendlines and text badges directly on both the main price chart and the RSI subwindow. 100% Non-Repainting: Uses left/right pivot strength confirmation so signals stay fixed once drawn. Full Multi-Timeframe Support: Adapts instantly to whatever chart timeframe you are viewing. Fully Customizable: Eas
Pivot Point Fibo RSJ
JETINVEST
4.41 (22)
한쪽 방향당 최대 7개의 피보나치 피봇 레벨. 리테스트 횟수가 표시되는 등급별 수요/공급 존이 필요하다면: Supply Demand RSJ PRO Pivot Point Fibo RSJ는 일일 피봇 포인트와 피보나치 비율로 계산한 지지 및 저항 레벨을 그립니다. 전일 고가, 저가, 종가를 바탕으로 최대 7개의 지지 레벨과 7개의 저항 레벨을 표시합니다. 트레이더는 이 레벨을 하루 동안의 진입, 청산, 손절 위치를 계획하는 참고 구간으로 활용합니다. 기능 최대 7개의 지지 레벨과 7개의 저항 레벨 네 가지 계산 방식: 피보나치 변형 3종과 클래식 피봇 레벨별 개별 색상 설정 입력 파라미터 Pivot Type Pivot Fibo RSJ1 = 피보나치 비율 세트 1 Pivot Fibo RSJ2 = 피보나치 비율 세트 2 Pivot Fibo RSJ3 = 피보나치 비율 세트 3 Pivot Fibo Classic = 클래식 피봇 계산 Minimum Pivot Levels: 한쪽 방향당 3, 4,
FREE
ICT Institutional Zones Pro
Celestine Anyango Wabomba
ICT Institutional Zones Pro — Trade with Institutional Precision Stop wasting time manually drawing key ICT levels every day. ICT Institutional Zones Pro is a professional-grade MT5 indicator built for traders who use ICT (Inner Circle Trader) and Smart Money Concepts (SMC) to read market structure with precision. This indicator automatically maps the most important institutional levels directly on your chart, helping you instantly identify where smart money is likely accumulating, distributing
SPECIAL LAUNCH OFFER: $30 (1-Month Rent) Limited time offer to build our community and gather feedback! AmbM GOLD Institutional Scalper A high-precision M5 algorithm for XAUUSD (Gold) , engineered to trade exclusively at Institutional Liquidity Levels ($5/$10 psychological marks). PERFORMANCE DATA (BUY ONLY) • Win Rate: 87.09%. • Safe Growth: +$4,113 profit on $10k (13.75% Max Drawdown). • Extreme Stress Test: Successfully generated +$22,997 in a 5-year stress test (2020-2026), proving
Keltner Channel AVG
Trong Doan Nguyen
CleanSMC Lite CleanSMC Lite is a MetaTrader 5 custom indicator designed to help traders analyze market structure using a clean Smart Money Concepts style workflow. The indicator focuses on visual structure mapping, demand and supply zones, fair value gap detection, equal highs and equal lows, and optional BUY/SELL signal arrows. The tool is built for discretionary technical analysis and is intended to support chart reading, not to replace a complete trading plan. It does not execute trades, open
Pivot Points MT5 is a universal color multicurrency/multisymbol indicator of the Pivot Points levels systems. You can select one of its three versions: Standard Old, Standard New and Fibo . It plots pivot levels for financial instruments in a separate window . The system will automatically calculate the Pivot Point on the basis of market data for the previous day ( PERIOD_D1 ) and the system of support and resistance levels, three in each. A user can choose colors for the indicator lines. The on
KT Horizontal Lines MT5
KEENBASE SOFTWARE SOLUTIONS
MetaTrader에서 여러 개의   수평선을   그린 후 각 수평선의 가격을 추적하는 것은 번거로운 작업이 될 수 있습니다. 이 인디케이터는 가격 알림 설정, 지지/저항선 표시 및 기타 수동 목적을 위해 동일한 간격으로 여러 수평선을 자동으로 그려줍니다. 이 인디케이터는 빠른 매수 및 매도를 통해 수익을 얻고자 하는 초보 외환 트레이더에게 적합합니다. 수평선은 시장이 추세를 따르거나 횡보 중일 때 거래 진입 가능성이 있는 구간을 찾는 데 유용합니다. 기능 입력 설정에 따라 여러 수평선을 즉시 자동으로 표시합니다. 여러 수평선을 쉽게 구분할 수 있도록 생동감 있는 색상 테마 제공. 여러 거래 세션의 가격 범위를 추적하는 데 유용한 필수 도구입니다. 가격이 수평선에 도달하면 알림을 전송합니다. 지나친 반복 알림을 방지하기 위해 알림 간격 설정 가능. 완전한 사용자 맞춤 설정 지원. 설명 이 인디케이터는 입력 설정에서 지정된 값과 지시에 따라 수평선을 표시합니다. 가격이 수평선에서
Trading Discipline Trend Dashboard는 오직 자신의 계좌에서 이미 청산된 거래 내역만 읽어, 네 가지 특정 패턴을 7일간의 추세로 보여줍니다. 이를 통해 어떤 행동이 한 번뿐인지, 아니면 매주 반복되고 있는지를 확인할 수 있습니다. 예측하지 않고 조언도 하지 않습니다. 패널에 표시되는 모든 숫자는 이 계좌에서 이미 일어난 사실입니다. 숫자는 이렇게 만들어집니다: 모든 심볼과 모든 매직넘버를 대상으로 최대 37일치의 청산된 거래를 읽습니다 - 차트에 표시된 심볼에 국한되지 않는 계좌 전체의 그림입니다. 4개 행마다 각각 다른 정의를 사용합니다. Post-loss oversize는 손실로 마감된 거래 이후 10분 이내에, 30일 기준값(같은 조건 신규 진입의 중앙값 랏)을 초과하는 랏으로 열린 신규 진입 건수를 셉니다 - 이는 무료 지표 Trade Behavior Mirror와 동일한 정의입니다. Win-streak oversize는 연승이 계속되는 동안, 같
SMC Session Scanner MT5
Allan Aparece Ninal
SMC Session Scanner MT5 is a panel indicator for MetaTrader 5 that watches many symbols and timeframes for smart-money structure and session levels. For each symbol and timeframe it shows one of these: a fresh break of structure (BOS), a change of character (CHoCH), or a fresh liquidity sweep. It also shows price inside a live order block or fair value gap. Otherwise it shows the latest break and how long ago it was. A Session column shows the session now. It also shows today's first close beyon
Adaptive Trend Lines
Henri Salvatore Bigatti
4.76 (25)
This indicator shows the TLH and TLL and some trendlines that allow us to estimate the trend of market.  It also shows the values of the angles of the lines in percentage in points (pip) , the standard deviation, and the trend of each line, and when it breaks the lines of support and resistance (TLH and TLL). And finally, it also shows the points identified as supports and resistances through the fractal algorithm in the graph. The high and low trend lines are supported by the highs and lows, th
FREE
Apex Break PRO MT5
Kestutis Balciunas
Apex Break PRO는 MetaTrader 5용 비재도색 피봇 추세선 돌파 지표입니다. 피봇 고점과 피봇 저점을 감지하고, 연속 피봇 사이에 동적 경사 추세선을 그리며, 확정된 봉 마감 시 가격이 해당 추세선을 돌파할 때 매수 및 매도 신호를 생성합니다. 모든 신호는 최대 4개의 독립적인 컨플루언스 레이어——EMA 추세, RSI 경계값, 거래량 급증 감지, ADX 추세 강도——를 통해 필터링되며, 트레이더가 몇 가지 조건이 일치했는지 즉시 확인할 수 있도록 스타 평가 시스템으로 등급이 매겨집니다. ATR 기반 손절매와 3개의 이익실현 레벨이 각 신호에 대한 체계적인 리스크 관리를 제공하며, 실시간 대시보드는 방향, 필터 상태, 도달 체크 표시가 포함된 거래 레벨 추적을 표시합니다. MT4 버전 확인:  Apex Break PRO MT4 더 많은 제품 보기:   전체 제 품 목록 실시간 예제와 새로운 도구를 확인하려면 프로필을 방문하여 업데이트를 놓치지 않도록 친구 요청을 보내세
Supreme Power House reads market structure, grades every signal against seven filters and draws a complete trade plan for each one. It prints a BUY or a SELL when a candle closes beyond the latest swing: a change of character (CHoCH) when the break turns the structure, a break of structure (BOS) when it continues it. Each signal comes with an entry, a stop, up to three targets and a grade from A to C, surrounded by an adaptive trend ribbon, ICT zones and a dashboard of six timeframes. Everythin
이 제품의 구매자들이 또한 구매함
Trend Sniper X
Sarvarbek Abduvoxobov
4.86 (44)
Trend Sniper X 는 트레이더가 추세 방향과 잠재적 반전 지점을 명확하고 정확하게 포착할 수 있도록 도와주는 MetaTrader 5용 멀티 타임프레임 추세 추종 지표입니다. MT4용: https://www.mql5.com/en/market/product/193245 가격 정보: 현재 가격은 프로모션 할인가이며, 향후 업데이트 및 새로운 기능이 출시됨에 따라 변동될 수 있습니다. 보너스 혜택: 본 지표 전용 무료 자동매매 Assistant EA를 받으시려면 구매 후 작성자에게 메시지를 보내주시기 바랍니다. Code2Profit 채널 멀티 타임프레임 분석으로 시장을 마스터하세요! Trend Sniper X로 승률을 극대화하는 방법: 핵심 규칙 및 세션 팁 기술 사양 플랫폼 MetaTrader 5 지표 유형 멀티 타임프레임 추세 지표 운용 타임프레임 모든 차트 타임프레임 지원, 독립적으로 선택 가능한 상위 타임프레임(M1–MN1) 주요 상품 외환, 금(XAUUSD) 및 기타 C
새로운 왕의 등장 - 인디케이터 + 주문 관리 표시(TP1 + TP2 + TP3) + 선택형 텔레그램 시그널 전송 기능 포함 (무료) (완전한 트레이딩 및 시그널 시스템) 골드를 위한 최고의 EA: Gold Slayer 이 인디케이터는 고급 전략, 사용자 지정 가능한 주문 관리 시스템, 그리고 엔벨로프 확장을 결합한 평균 회귀(mean reversion) 시스템을 포함하고 있습니다. 또한 RSI와 같은 여러 지능형 확인 필터를 통해 높은 확률의 반전 진입 구간을 포착하여 BUY 및 SELL 시그널을 제공합니다. 단순히 거래 방법만 배우는 것이 아니라, 여러 포지션을 효과적으로 관리하고 이전에 수익 중인 오픈 포지션으로 손실 거래를 커버하는 방법까지 익힐 수 있습니다. M5 전용으로 설계 및 최적화되었으며, 유동성이 풍부해 시그널이 더 깔끔하고 신뢰도 높은 BTCUSD와 XAUUSD에서 뛰어난 성능을 발휘합니다. 이 인디케이터는 ATR 기반으로 자동 계산된 진입가, 손절가, 익절가와
Smart Trend Trading System — MetaTrader 5 구매 후 MQL5에서 저에게 메시지를 보내시면 Smart Universal Expert Advisor를 무료로 받으실 수 있으며, 온라인 강좌, PDF 매뉴얼 및 비공개 그룹 이용 권한도 함께 제공됩니다. STTS는 추세 방향, 진입·청산 신호, 반전 구간, 주요 가격 수준을 차트에 모아 보여줍니다. 시스템을 참고해 수동으로 거래하거나, 별도의 호환 EA를 연결하여 선택한 설정에 따라 자동으로 거래를 실행할 수 있습니다. 하나의 시스템, 네 가지 트레이딩 접근법 STTS의 트레이딩 접근법은 크게 네 가지로 나뉩니다. • 스캘핑 — 단기 신호와 시장 움직임을 살펴봅니다. • 추세 매매 — 방향을 평가하고 추세 안에서 기회를 찾습니다. • 반전 매매 — 잠재적인 전환 구간과 방향 변화를 파악합니다. • 거래량 매매 — 거래량 기반 정보로 시장 활동을 평가합니다. 진입·청산 화살표, 추세 정보, 지지·저항 수
Entry Points Pro for MT5
Yury Orlov
4.52 (152)
Entry Points Pro는 주문을 넣기 전에 어디에서 진입하고, 스탑을 어디에 두고, 어떤 랏으로 거래할지 보여 줍니다. 가격 지금 149 USD이며, 이 가격으로는 마지막 1카피입니다. 이후 가격은 199 USD로 오르고, 최종 가격은 349 USD입니다. 저는 시장에서 트레이딩으로 돈을 벌고 그것을 보여 드립니다. 그래서 이 인디케이터를 모두에게 팔 필요가 없습니다. 스스로 생각하는 트레이더를 위한 도구이지, 마법 버튼이 아닙니다. 화살표는 캔들이 마감될 때 나타나며 리페인팅되지 않습니다. 설정은 두 가지: 예치금과 거래당 리스크. 결제 전에 확인하세요: 무료 데모는 MT5 전략 테스터에서 작동하며 2분이면 됩니다. 구매 후에는 제가 직접 설정을 도와 드리겠습니다. 2019년, 저는 이 지표가 무엇을 할 수 있는지 전 세계에 보여 주었습니다. 실계좌에서 지표의 시그널에 따라 수동으로, 모두가 볼 수 있게 공개적으로 거래했습니다 — 계좌는 Myfxbook에서 모니터링되었고,
M5 Sniper
MeanFX
5 (4)
당신의 트레이딩 우위를 한눈에 확인하세요! M5 Sniper 는 MeanFX의 새로운 지표입니다. 정확한 트레이딩 신호 와 적응형 TP/SL 레벨 을 결합하여, 결과적으로 가능한 최고의 통계적 트레이딩을 만들어냅니다! 5회 구매마다 가격이 인상되며, 다음 가격은 69$입니다. 구매 후 저에게 메시지를 보내주시면 팁/가이드와 보너스 EA를 제공해 드립니다. 무엇이 이 지표를 특별하게 만들까요? Gold XAUUSD에서 검증된 통계적 성과 ( 거의 모든 자산에서 작동 하며, 일관된 결과 없이 모든 것을 다루려고 하기보다는 하나의 타임프레임을 완전히 익히는 데 집중합니다) 각 심볼당 하루 1~8회의 트레이드 와 높은 승률을 제공하며, 모든 통계적 우위를 우리의 편으로 가져갑니다. 차트에는 확인된 BUY 및 SELL 신호만 표시됩니다. 각 트레이드에 대해 지표가 생성하는 적응형 TP 및 SL 레벨 평균 승률 75%+ 평균 Signal Ratio 최소 1.1+ 알람 및 알림이 휴대폰 으로도
SuperScalp Pro
Van Minh Nguyen
4.54 (37)
SuperScalp Pro - Professional Multi-Layer Confluence Scalping System SuperScalp Pro는 기존 Supertrend에 여러 지능형 확인 필터를 추가하여 기능을 강화한 고급 스캘핑 지표입니다. 잘못된 신호를 크게 줄이면서 성공 가능성이 더 높은 Buy/Sell 거래 기회를 식별하는 데 도움을 줍니다. 명확한 Buy 및 Sell 화살표가 차트에 직접 표시되며, ATR 기반 Stop Loss 및 Take Profit 레벨도 실시간으로 자동 계산됩니다. 구매 후 MQL5 메시지로 저에게 연락하시면 SuperScalp Pro Auto Trader EA를 무료로 받으실 수 있으며, 사용자 가이드와 비공개 그룹 이용 권한도 제공됩니다. 권장 설정 파일 다운로드: [Set File] 전체 문서는 제품 블로그에서 확인할 수 있습니다: [User Guide] 업데이트를 받으려면 공식 채널에 참여하세요: [Official Channel]
Gold Trend Coach MT5
Cristhian Alexander Gaibor Cuasquer
4.2 (10)
Gold Trend Coach는 MetaTrader 5용 금(XAUUSD) 추세 지표로, 캔들 마감에 확정되는 매수·매도 신호(리페인트 없음), 손절과 세 개의 익절 목표, 진입부터 TP3까지 안내하는 코치, 멀티 타임프레임 패널, 휴대폰과 텔레그램 알림을 제공합니다. 런던·뉴욕 세션의 M1·M5 스캘핑과 M15 데이 트레이딩용으로 만들었습니다. 보너스: Gold Trend Coach 자동매매 EA 무료 제공. 구매 후 메시지를 주시면 지표 신호로 자동 매매하는 EA와, 모든 신호·진입·손절·도달한 목표를 텔레그램 채팅, 그룹 또는 채널로 보내는 Telegram Alert Bridge를 set 파일과 설치 가이드와 함께 보내 드립니다. 출시 가격 $39는 처음 20개 한정이었고 이미 매진되었습니다. 현재 가격 40개까지 $45, 이후 $59. 예정된 최종 가격 $79. 아마 이미 수십 개의 금 지표를 써 보셨을 겁니다. 대부분은 화살표로 매수·매도 신호만 주고 가장 어려운 부분, 즉
SMC Intraday Formula
VividMind Digital Solutions
5 (26)
먼저 솔직하게 말하겠습니다. 어떤 인디케이터도 단독으로 당신을 수익성 있게 만들어주지 않습니다. 누군가 그렇게 말한다면, 그는 당신에게 꿈을 파는 것입니다. 완벽한 매수/매도 화살표를 보여주는 모든 인디케이터는 완벽하게 보이도록 만들 수 있습니다 — 단지 올바른 과거 구간을 확대하고 승리한 거래만 캡처하면 됩니다. 우리는 그렇게 하지 않습니다.  SMC Intraday Formula는 도구입니다. 시장 구조를 읽고, 가장 높은 확률의 가격 구간을 표시하며, 현재 스마트 머니의 흐름이 어떻게 보이는지 아주 단순한 언어로 보여줍니다. 최종 결정은 여전히 당신이 합니다. 실행도 당신이 합니다. 하지만 이제는 희망이 아니라 정확성으로 거래하게 됩니다. 우리는 이 인디케이터를 지난 약 3년 동안 골드(XAUUSD) 및 주요 외환 통화쌍의 데이 트레이딩 스캘핑에 사용해 왔습니다. M1, M5, M15, M30에서 우리의 핵심 도구입니다. 이 도구는 미래를 예측하려 하지 않습니다 — 지금 형성
Gann Made Easy MT5
Oleg Rodin
5 (13)
Gann Made Easy 는 mr.의 이론을 사용하여 최고의 거래 원칙을 기반으로 하는 전문적이고 사용하기 쉬운 Forex 거래 시스템입니다. W.D. 간. 이 표시기는 Stop Loss 및 Take Profit Levels를 포함하여 정확한 BUY 및 SELL 신호를 제공합니다. PUSH 알림을 사용하여 이동 중에도 거래할 수 있습니다. 구매 후 거래 방법 안내 및 유용한 추가 지표를 무료로 받으시려면 저에게 연락주세요! 아마도 Gann 거래 방법에 대해 이미 여러 번 들었을 것입니다. 일반적으로 Gann의 이론은 초보자 거래자뿐만 아니라 이미 거래 경험이 있는 사람들에게도 매우 복잡한 것입니다. Gann의 거래 방식은 이론적으로 적용하기 쉽지 않기 때문입니다. 나는 그 지식을 연마하고 Forex 지표에 최고의 원칙을 적용하기 위해 몇 년을 보냈습니다. 표시기는 적용하기가 매우 쉽습니다. 차트에 첨부하고 간단한 거래 권장 사항을 따르기만 하면 됩니다. 지표는 지속적으로 시장 분석
Ultra Indicator
Ihor Otkydach
5 (1)
ULTRA는 “올인원” 방식으로 작동하는 기술적 지표로, 시장을 독자적으로 분석하고, 매매 신호를 생성하며, 손절매 주문 설정 수준을 표시하고, 이익을 실현하거나 손실을 최소화하기 위해 포지션을 청산해야 할 시점을 제안합니다. 다시 말해, 시장을 분석하는 법을 모르거나, 가격 수준(손절매를 어디에 설정할지)을 파악하지 못하거나, 자금 관리에 어려움을 겪더라도 상관없습니다. ULTRA가 그 모든 것을 대신 해줄 테니까요! 구매자 특전 : ULTRA 지표를 구매하신 후, 저에게 비공개 메시지를 보내주시면 “ULTRA BOT”을 무료 선물로 드립니다. 이 도구는 해당 지표의 신호를 바탕으로 개설한 거래를 관리하는 데 도움을 주는 특별한 도구입니다(각 거래에 대해 손절매를 설정하고, 최상의 결과를 얻을 수 있도록 전략의 규칙에 따라 거래를 자동으로 청산해 줍니다).  또한 구매자분들께 다양한 자산에 바로 적용할 수 있는 설정값을 제공해 드리고 있으며, 이를 통해 지표가 최대 효율로 작동할
Boba Analysis Suite
Trade Ready Solutions LLC
5 (2)
Boba Analysis Suite Boba Analysis Suite는 MetaTrader 5용 분석 지표입니다. 시장 구조, 주요 가격 영역, 전반적인 시장 상황을 하나의 차트 화면에 통합하여 표시합니다. 트레이더이자 트레이딩 코치로서의 실무 경험을 바탕으로 개발되었으며, 시장 방향 평가, 주요 가격 수준 식별, 여러 시간대의 종합적인 분석 등 체계적인 분석 과정을 지원합니다. 시장 맥락을 고려한 분석 개별 신호의 의미는 시장 상황에 따라 달라집니다. Boba Analysis Suite는 현재 차트 상황을 더 넓은 시장 구조와 연결하고, 사전에 정한 규칙에 따라 매매 아이디어를 검토할 수 있도록 돕습니다. 주요 분석 기능은 다음과 같습니다. 추세 및 시장 구조: 시장 방향과 관련 구조적 맥락을 평가합니다. 주요 가격 영역 및 수준: 추가 분석이 필요한 중요한 영역을 차트에 시각적으로 표시합니다. 여러 시간대: 서로 다른 시간대의 정보를 통합하여 전반적인 시장 상황을 평가합니다.
다음 업데이트 — 버전 2.52 곧 출시! [신규] 시장 분석 및 트레이딩 워크플로를 향상시키기 위해 설계된 4가지 주요 신규 기능을 기대해 주세요. 트레이딩 요구 사항을 충족하도록 설계된 4가지 새로운 기능으로 시장 분석을 한 단계 더 발전시킵니다. 다음 기능을 소개합니다: 1. TRADE OVERVIEW DASHBOARD 2. CONFLUENCE AT ZONE 3. STRONG & WEAK HIGH/LOW 4. OTE 1. TRADE OVERVIEW DASHBOARD 시장 전체 상황을 더 쉽게 파악할 수 있도록 도와주는 대시보드입니다. 트레이딩 의사결정을 지원하는 가이드를 제공하며, 하나의 화면에서 시장을 분석하고 체계적으로 트레이딩을 계획할 수 있도록 도와줍니다. 멀티 타임프레임 시장 개요 (Multi-Timeframe Market Overview) 시장 방향과 가격 구조를 더욱 명확하게 파악 시장 상황을 빠르게 확인 체계적인 시장 분석 및 진입 계획을 위한 가이드 2. CO
M1 Sniper MT5
Oleg Rodin
5 (7)
M1 SNIPER 는 사용하기 쉬운 거래 지표 시스템입니다. M1 시간대에 맞춰 설계된 화살표 지표입니다. 이 지표는 M1 시간대 스캘핑을 위한 단독 시스템으로 사용할 수 있으며, 기존 거래 시스템의 일부로도 사용할 수 있습니다. 이 거래 시스템은 M1 시간대 거래용으로 특별히 설계되었지만, 다른 시간대에도 사용할 수 있습니다. 원래는 XAUUSD와 BTCUSD 거래를 위해 이 방법을 설계했지만, 다른 시장 거래에도 유용하다는 것을 알게 되었습니다. 이 지표의 신호는 추세 방향과 반대로 거래될 수 있습니다. 저는 지표의 신호를 활용하여 양방향으로 거래할 수 있도록 돕는 특별한 거래 기법을 알려드립니다. 이 방법은 특별한 동적 지지선과 저항선 가격 영역을 활용하는 것을 기반으로 합니다. 구매하시면 M1 SNIPER 화살표 지표를 바로 다운로드하실 수 있습니다. 또한, 아래 스크린샷에 표시된 Apollo Dynamic SR 지표는 M1 SNIPER 도구를 사용하는 모든 사용자에게 무료로
FiboSniper Pro
Van Minh Nguyen
5 (4)
FiboSniper Pro – Multi-Filter Fibonacci System with Auto SL/TP and Control Panel FiboSniper Pro는 동적 Fibonacci Envelopes와 여러 확인 필터를 결합하여 선별된 Buy 및 Sell 신호를 생성하는 기술적 지표입니다. Fibonacci 레벨은 Moving Average와 ATR을 기반으로 계산된 후 ADX, EMA, RSI, ATR, Volume, Time 및 Candle 구조를 통해 필터링됩니다. 이 지표는 ATR 기반의 자동 Stop Loss 및 Take Profit 레벨을 차트에 직접 표시하며, 빠른 설정 조정을 위한 인터랙티브 Control Panel을 제공합니다. 구매 후 MQL5 메시지로 저에게 연락하시면 Auto Trader X를 무료로 받으실 수 있으며, 이 지표의 거래 신호를 자동화하는 방법에 대한 안내도 제공됩니다. User Guide 및 Set Files: [Click here
Auto Optimized SpeedAngle 은 지속적인 워크포워드 최적화(Walk-Forward Optimization, WFO)를 통해 곡선 적합(curve-fitting)을 제거한 기관 수준의 모멘텀 벡터화 시스템입니다. 시장 체제가 바뀔 때 성능이 떨어지는 정적 입력에 의존하는 대신, 이 지표는 표본 외(Out-of-Sample, OOS) 검증을 사용하여 매개변수를 동적으로 재보정하며, 표시되는 신호가 과거의 우연이 아닌 진정한 통계적 우위를 나타내도록 보장합니다. 핵심 기관용 프레임워크 워크포워드 최적화 엔진: 핵심 알고리즘은 수천 가지의 룩백(lookback) 및 임계값 조합을 지속적으로 스캔하며, 데이터를 인샘플(in-sample)과 표본 외(out-of-sample) 세트로 엄격하게 분리합니다. 미지의 데이터 환경에서 수학적 우수성이 증명된 경우에만 새로운 매개변수 구성을 채택합니다. 정량적 목적 함수: 순수한 총이익을 쫓는 대신, 최적화 엔진은 기관 수준의 안정성
Adaptive Price Action Engine 지표를 구매하면 EA(자동매매 프로그램)가 무료 멀티 타임프레임 기반 자기 최적화 추세 & 캔들 패턴 분석 시스템 시장은 끊임없이 변화하며, 모든 Price Action 패턴이 모든 시장 환경에서 동일한 가치를 가지는 것은 아닙니다. Adaptive Price Action Engine 은 변화하는 시장 환경에 적응할 수 있도록 설계되었으며, 추세 구조, 멀티 타임프레임 분석, 캔들 패턴 및 통계적 최적화 를 하나의 분석 프레임워크로 결합합니다. 두 가지 적응형 모드 Dual Alpha Trend Mode 낮은 타임프레임과 높은 타임프레임에서 적합한 Alpha Trend 파라미터를 자동으로 탐색하여, 최근 시장 움직임에 맞춰 추세 분석을 조정합니다. Candlestick + Alpha Mode Alpha Trend를 통한 시장 국면 분석과 22개의 상승 및 하락 캔들 패턴 을 결합합니다. 모든 패턴을 동일하게 취급하는 대신, 다양
Crystal Heikin Ashi Signals
Muhammad Jawad Shabir
5 (5)
Crystal Heikin Ashi Signals—Professional Trend & Signal Detection Indicator Advanced Heikin Ashi Visualization with Intelligent Signal System for Manual & Automated Trading Final Price: $149 ---------> Price goes up $10 after every 10 sales . Limited slots available — act fast . Overview User Guide PDF Crystal Heikin Ashi Signals is a professional-grade MetaTrader 5 indicator that combines pure Heikin Ashi candle visualization with an advanced momentum-shift detection system. Designed for both m
Scalper Vault MT5
Oleg Rodin
5 (1)
Scalper Vault는 당일 매매(intraday trading)에서 일관된 성과를 내고자 하는 트레이더를 위해 설계된, 강력하고 모든 기능을 갖춘 트레이딩 시스템입니다. 이 고정밀 지표는 외환(Forex) 및 바이너리 옵션 트레이더 모두에게 기관급 분석을 제공하는 독립적인 종합 트레이딩 시스템 역할을 합니다. 구매 후 저에게 연락해 주시면, 트레이딩 팁과 함께 특별한 보너스를 제공해 드립니다! Scalper Vault는 추측에 의존하거나 복잡한 수동 분석을 할 필요를 없애주며, 사용하기 쉬운 트레이딩 기법을 통해 오직 매매 실행에만 집중할 수 있도록 돕습니다. 정확한 추세 추종 신호: 핵심 알고리즘이 시장 구조를 분석하여, 지배적인 시장 추세 방향과 일치하는 고확률 신호만을 제공함으로써 잘못된 진입을 획기적으로 줄여줍니다. 정밀한 고점 및 저점 탐지: 시장의 움직임이 소진되는 지점을 스캔하여 잠재적인 반전 구간을 식별합니다. 간(Gann) 이론 기반의 매수/매도 구간: 수학적
Trend Catcher ind mt5
Ramil Minniakhmetov
5 (18)
트렌드 캐처 인디케이터 트렌드 캐처 인디케이터는 개발자가 자체 개발한 맞춤형 적응형 트렌드 분석 지표들을 조합하여 시장 가격 움직임을 분석합니다. 단기적인 노이즈를 제거하고 근본적인 모멘텀 강도, 변동성 확대, 가격 구조 움직임에 집중하여 진정한 시장 방향을 파악합니다. 또한 이동 평균, RSI, 변동성 필터와 같은 맞춤형 지표들을 활용하여 가격을 평활화하고 트렌드를 필터링합니다. 실제 운영 모니터링 및 기타 제품은 다음 링크에서 확인하실 수 있습니다:   https://www.mql5.com/en/users/mechanic/seller 텔레그램에서는 EA나 설정 파일을 판매하지 않습니다. 사기이니 주의하세요. 모든 설정 파일은 블로그에서 무료로 제공됩니다. 중요! 구매 후 즉시 연락 주시면 사용 방법 및 보너스를 드립니다!
Atomic Analyst MT5
Issam Kassas
4.5 (64)
Atomic Analyst — MetaTrader 5 구매 후 MQL5에서 저에게 메시지를 보내시면 Smart Universal Expert Advisor를 무료로 받으실 수 있으며, 온라인 강좌, PDF 매뉴얼 및 비공개 그룹 이용 권한도 함께 제공됩니다. Atomic Analyst는 가격 움직임 분석, 추세 방향, 진입·청산 신호, 손절 수준, 여러 익절 수준을 차트에 모아 보여줍니다. 신호를 확인하고 매매 상황을 이해하세요 Atomic Analyst는 분석 결과를 명확한 시각 정보로 정리합니다. • 잠재적인 진입 기회를 확인할 수 있는 매수·매도 화살표. • 거래 계획에 도움이 되는 손절 수준과 여러 익절 수준. • 시장 방향을 평가할 수 있는 추세, 강도, 모멘텀 수치. • 더 넓은 시장 맥락을 비교할 수 있는 여러 시간대 분석. • 변화하는 시장 상황을 따라갈 수 있는 색상별 캔들과 알림. 신호와 보조 분석을 함께 검토한 다음, 해당 매매 상황이 자신의 거래 규칙에
Unix Scalper
Issam Kassas
4 (4)
Unix Scalper — MetaTrader 5 구매 후 MQL5에서 저에게 메시지를 보내시면 Smart Universal Expert Advisor를 무료로 받으실 수 있으며, 온라인 강좌, PDF 매뉴얼 및 비공개 그룹 이용 권한도 함께 제공됩니다. 매매 기회를 찾고, 거래 계획을 확인하고, 실행 방법을 선택하세요. UNIX Scalper는 시장 분석, BUY/SELL/WAIT 판단, Entry, Stop Loss, TP1 및 TP2 가격 수준을 하나의 정돈된 패널에 제공합니다. 신호와 거래 계획을 한눈에 • 명확한 판단: BUY, SELL 또는 WAIT. • 구체적인 가격 수준: Entry, Stop Loss, TP1 및 TP2. • 다중 시간대 개요: 패널의 여러 시간대 신호를 비교하세요. • 판단을 돕는 분석: 추세, 모멘텀, 거래량, 변동성, 지지와 저항, 시장 품질. • 다양한 레이아웃: Minimized, Compact, Standard 또는 Full. 신호와
SIO Oscillator
Davit Beridze
SIO Oscillator: 자기 최적화 세미분산 불균형 오실레이터 지표를 구매하시면 이를 기반으로 한 전문가 어드바이저(EA)를 무료로 받으실 수 있습니다. 대부분의 오실레이터는 모든 가격 움직임을 똑같이 취급합니다. SIO는 상승 압력과 하락 압력을 분리하여 둘 사이의 불균형을 측정하고, 매수자와 매도자 중 어느 쪽이 실제로 시장을 주도하고 있는지 보여줍니다. 불균형이 극단에 도달하면 SIO는 진입가, 손절(Stop Loss), 익절(Take Profit) 수준이 포함된 명확한 신호를 표시합니다. SIO의 차별점은 고정된 설정에 의존하지 않는다는 것입니다. 내장된 자기 최적화 엔진이 현재 종목과 시간 프레임에 맞는 파라미터를 지속적으로 탐색하고, 사용하기 전에 검증합니다. 두 가지 신호 모드 평균 회귀(Mean Reversion): 불균형의 극단에서 거래하며 균형으로의 복귀를 노립니다. 추세 추종(Trend Following): 지속적이고 우세한 불균형의 방향으로 거래합니다. 자
Volatility Master for MetaTrader is a real-time dashboard tool that scans up to  50 symbols  to identify high-volatility , trending markets instantly. With bullish/bearish signals, customizable alerts, and a user-friendly interface, it helps you avoid range-bound conditions and focus on high-probability trades. Clarity leads to confidence. Trade confidently and protect your capital effectively with this powerful dashboard. We don't offer free or bonus indicators in exchange of reviews from you.
Smc Pro ToolKit
Talal N Z Aljarusha
5 (14)
SMC PRO TOOLKIT — SMART MONEY ANALYSIS & STRUCTURED TRADE PLANNING SMC Pro ToolKit is a professional Smart Money Concepts analysis workspace for MetaTrader 5. It combines market structure, multi-timeframe analysis, institutional price zones, setup evaluation, confirmation tools, volume context, alerts, and risk planning inside one organized chart environment. One workspace. Multiple layers of confirmation. One structured trading plan. OPEN COMPLETE USER GUIDE MULTI-CONDITION SETUP ENGINE At
Dynamic Forex28 Navigator MT5
Bernhard Schweigert
5 (1)
다중 통화 강도 및 모멘텀 지표 MT5 Dynamic Forex28 Navigator는 오랫동안 사랑받아 온 인기 지표들의 진화형으로, 다섯 가지의 힘을 하나로 결합했습니다. Advanced Currency Strength28 Indicator (리뷰 700개) Advanced Currency IMPULSE with ALERT (리뷰 530개) Currency Strength EXOTICS GOLD Impulse with Alert CS28 Combo Signals (최근 보너스) 지표 네 개를 따로 구매해 차트에 겹쳐 놓을 필요가 없습니다. 28개 Forex 페어의 강도, 이를 이끄는 시장의 모멘텀, 그리고 두 가지 모두의 알림이 하나의 강력한 지표로 통합되어 한 창, 한 차트에서 확인할 수 있습니다. 위 프로그램들은 MQL5 Market에서 1,200개 이상의 리뷰를 받았으며 2016년부터 MT4 커뮤니티의 필수 지표로 자리잡았습니다. Dynamic Forex28 Navigato
AriFocus
Temirlan Kdyrkhan
AriFocus - Non-Repainting Buy/Sell Signals AriFocus - one clear signal. AriFocus marks buy and sell signals directly on the chart and suggests a stop-loss level for each one. Every signal is confirmed on bar close and never repaints. - Buy/sell arrows, confirmed on bar close - Suggested stop-loss level for every signal - Trend band and candle coloring to show direction at a glance - 10 ready-made presets, or your own settings (14 calculation methods) - Pop-up, push and email alerts with entr
Neuro Poseidon MT5
Daria Rezueva
4.68 (53)
Neuro Poseidon is a new indicator by Daria Rezueva. It combines precise trading signals with adaptive TP/SL levels - creating best possible trades as a result! Message me and get  Neuro Poseidon Assistant  as a gift to automize your trading process! What makes it stand out? 1. Proven profitability on all assets and timeframes 2. Only confirmed BUY and SELL signals present on the chart 3. Adaptive TP & SL levels generated by the software for each trade 4. Easy to understand - suitable for al
PZ Swing Trading MT5
PZ TRADING SLU
5 (5)
Protect against whipsaws: revolutionize your swing trading approach Swing Trading is the first indicator designed to detect swings in the direction of the trend and possible reversal swings. It uses the baseline swing trading approach, widely described in trading literature. The indicator studies several price and time vectors to track the aggregate trend direction and detects situations in which the market is oversold or overbought and ready to correct. [ Installation Guide | Update Guide | Tro
Azimuth Pro
Ottaviano De Cicco
5 (7)
Azimuth Pro V2: Synthetic Fractal Structure and Confirmed Entries for MT5 Overview Azimuth Pro is a multi-level swing structure indicator by Merkava Labs . Four nested swing layers, swing-anchored VWAP, ABC pattern detection, three-timeframe structural filtering, and closed-bar confirmed entries — one chart, one workflow from micro-swings to macro-cycles. This is not a blind signal product. It is a structure-first workflow for traders who care about location, context, and timing. Halloween P
SkyHammer Signal Pro
Shengzu Zhong
5 (5)
SkyHammer Signal Pro Entry, SL, TP 레벨이 고정되는 전문 No-Repaint 추세 신호 인디케이터 SkyHammer Signal Pro는 명확하고 고정되며 검증 가능한 신호를 원하는 트레이더를 위해 설계된 구조적인 추세 및 모멘텀 신호 인디케이터입니다. 특히 M1 및 M5 같은 낮은 시간대에서 가장 효과적으로 작동합니다. 이 인디케이터는 시장의 고점이나 저점을 예측하려고 하지 않습니다. 대신 신호를 생성하기 전에 확인된 시장 구조, 추세 방향, 모멘텀 강도, 건강한 변동성, 그리고 목표까지의 충분한 공간을 기다립니다. 주요 기능 고정 신호 메커니즘 신호가 확인되면 화살표, Entry, Stop Loss, TP1, TP2 레벨이 차트에 영구적으로 고정됩니다. 이후 캔들 움직임 때문에 신호가 사라지거나, 이동하거나, 변경되지 않습니다. 이를 통해 트레이더는 각 신호를 명확하게 검토할 수 있으며, 실시간 시장에서 신호가 사라지는 일반적인 문제를 피할 수 있습니다
제작자의 제품 더 보기
Chart Pattern Navigator MT5
Alexis Jean Francois Gemehl
Chart Pattern Navigator MT5 Overview Chart Pattern Navigator MT5 is a technical analysis indicator designed to automatically detect, classify and visualize classic chart patterns directly on your MetaTrader 5 charts. It helps traders identify potential market structures, monitor pattern development and evaluate possible trading scenarios without having to draw every formation manually. The indicator combines pattern recognition, configurable breakout and retest logic, projected entry levels, st
필터:
리뷰 없음
리뷰 답변