MTF Pivot Projection

MTF Pivot Projection

Multi-Timeframe Market Structure and Forward Pivot Analysis

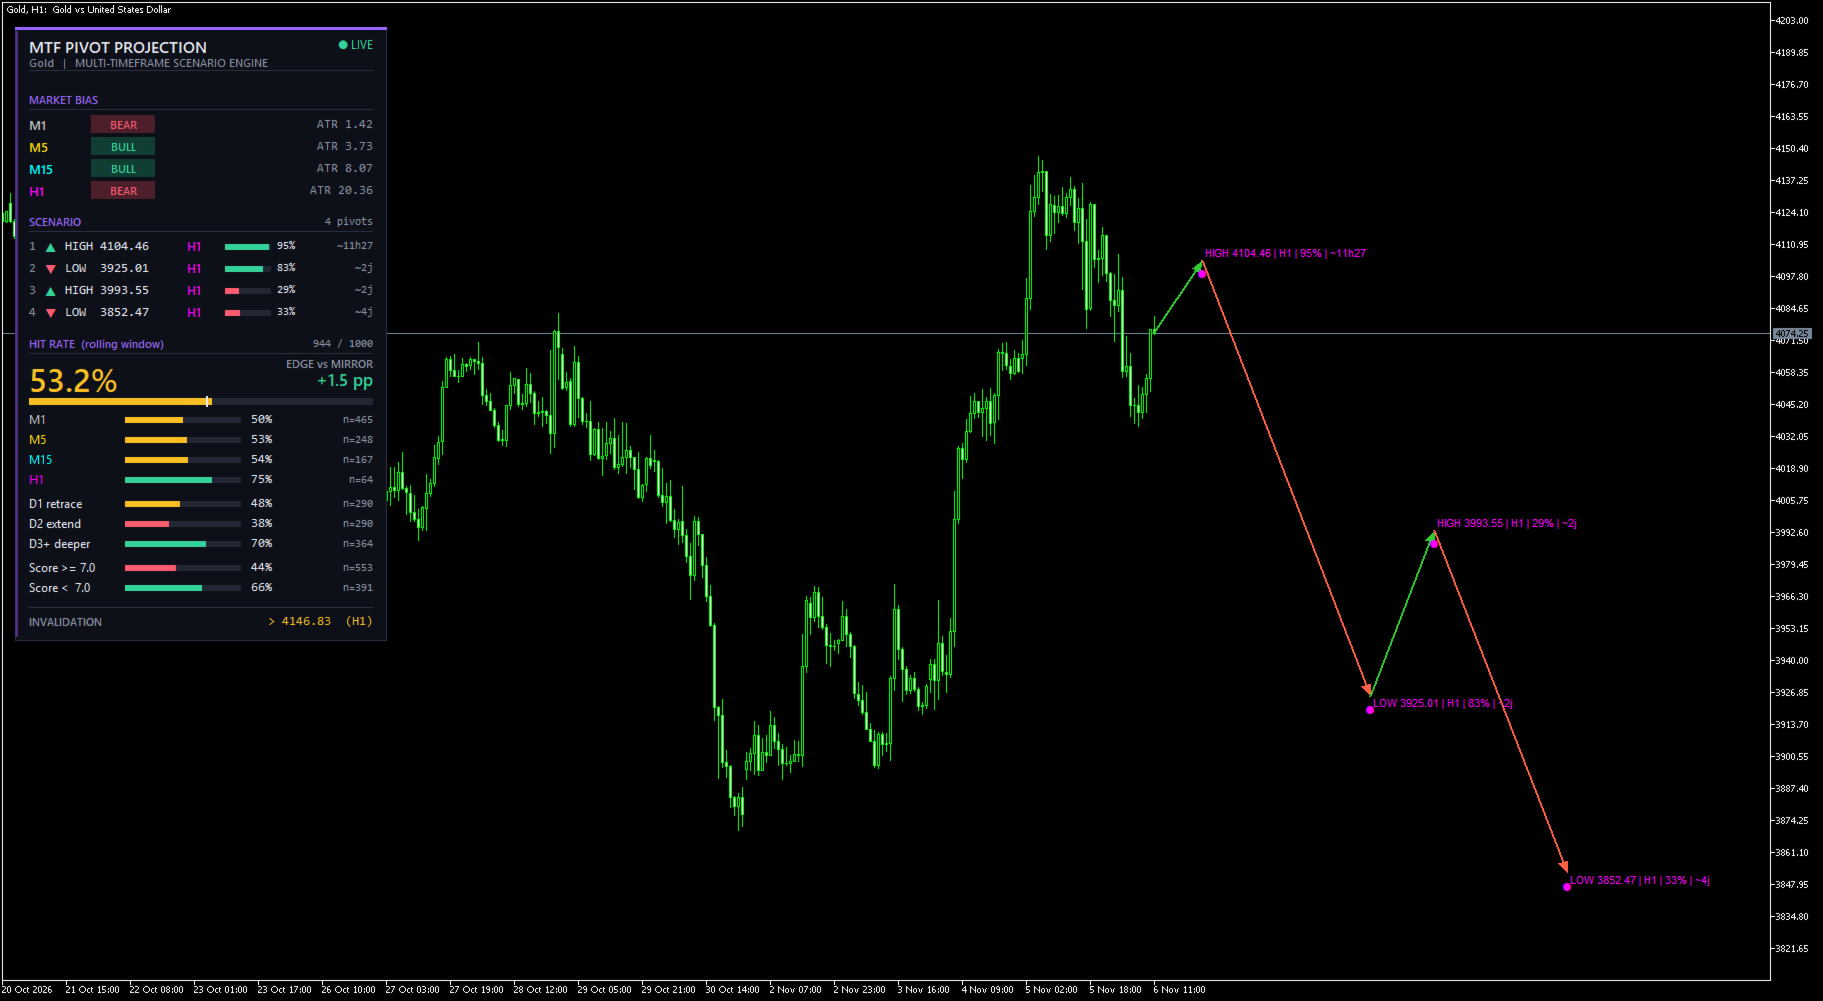
MTF Pivot Projection is a technical analysis indicator designed to combine multi-timeframe market structure, Fibonacci levels, Order Blocks and Fair Value Gaps into a single projected price path.

Instead of displaying independent pivot levels from multiple timeframes, the indicator builds one continuous sequence of potential future swing highs and lows, from the nearest projected retracement to subsequent extension targets.

The indicator also includes a performance tracking system that evaluates whether previously projected target zones were reached and compares the results with a mirrored reference target.

Main Features

1. Multi-Timeframe Pivot Analysis

Analyze four independently configurable timeframes simultaneously. The default configuration uses M1, M5, M15 and H1.

Each timeframe contributes its own market structure and projection candidates.

2. Unified Projected ZigZag

The indicator combines the projections from all selected timeframes into a single chronological path.

The projected path alternates between potential swing highs and swing lows, providing a visual representation of possible future price movements.

3. Fibonacci Retracements and Extensions

Retracement levels are used to calculate potential pullback targets.

Extension levels are used to estimate possible continuation targets.

The Fibonacci levels can be customized through the indicator settings.

4. Order Blocks and Fair Value Gaps

The indicator identifies unmitigated bullish and bearish Order Blocks and Fair Value Gaps.

These zones contribute to the confluence score and can be displayed directly on the chart.

5. Confluence Scoring

Each projected pivot receives a score based on several factors:

  • Fibonacci level weighting.

  • Order Block confluence.

  • Fair Value Gap confluence.

  • Market bias on the originating timeframe.

  • Higher-timeframe directional bias.

  • Distance from the current market price.

The displayed percentage is a normalized visual score. It is not a statistical probability of success.

6. Historical Performance Tracking

The indicator records the outcome of projected pivots over a rolling observation window.

A target is considered reached when price enters its configured tolerance zone before the projection expires or its invalidation condition occurs.

A mirrored reference target is also tracked to provide a comparison baseline.

The dashboard displays overall performance and additional statistics by timeframe, projection depth and score category.

7. Historical Backfill and Persistent Statistics

The indicator can reconstruct historical projection outcomes when first initialized.

Statistical records are saved locally and reused when the indicator is loaded again.

8. Integrated Dark Dashboard

A modern dashboard provides a compact overview of projected pivots and historical statistics without requiring separate windows.

Recommended Usage

MTF Pivot Projection is intended as an analytical tool for traders who use market structure, Fibonacci analysis and Smart Money Concepts.

It can be used on different chart timeframes. The analysis timeframes are configured independently from the chart timeframe.

The default M1, M5, M15 and H1 configuration is suitable as a starting point for intraday analysis.

Important Information

This indicator does not execute trades or provide guaranteed trading signals.

Projected pivots are analytical estimates based on the latest available market structure and selected confluences. They may change when new market data becomes available.

The displayed historical hit rate describes the indicator's own target-touch evaluation methodology. It does not represent a trading win rate or guarantee future performance.

Always use independent risk management and evaluate the indicator on your preferred instrument and trading conditions.


MTF Pivot Projection – User Guide

1. Installation

  1. Download and install the indicator through the MetaTrader 5 Market.

  2. Open MetaTrader 5.

  3. Open the Navigator window.

  4. Locate MTF Pivot Projection under Indicators.

  5. Drag the indicator onto the desired chart.

  6. Allow the indicator to load the required historical data.

The indicator can be attached to different chart timeframes. Its analysis timeframes are configured independently.

2. Understanding the Chart

Projected ZigZag

The projected path starts from the current market price and connects the estimated future pivot points.

  • Green segments represent upward projected movements.

  • Red segments represent downward projected movements.

  • Each projected pivot is marked with its estimated price.

  • Labels display the pivot type, source timeframe, score and estimated time.

The projections are estimates and may change as market conditions evolve.

Timeframe Colors

Each timeframe has its own marker and label color.

Default configuration:

  • M1: Silver

  • M5: Gold

  • M15: Aqua

  • H1: Magenta

Order Blocks

Order Blocks are displayed as colored chart zones.

  • Bullish Order Blocks represent potential demand areas.

  • Bearish Order Blocks represent potential supply areas.

Fair Value Gaps

Fair Value Gaps are displayed as separate colored zones.

  • Bullish FVG: blue.

  • Bearish FVG: purple.

Only zones meeting the indicator's detection and mitigation conditions are displayed.

3. Dashboard

The dashboard provides a summary of the current projected scenario and its historical evaluation.

The main statistics include:

Hit Rate

Percentage of resolved projected targets that reached their target zone before expiration or invalidation.

Baseline

A mirrored reference target is evaluated using the same tracking methodology. It provides a comparison against the original projected target.

Timeframe Statistics

Shows the historical results associated with each analysis timeframe.

Projection Depth

Separates statistics according to the position of the projected pivot in the scenario.

Score Categories

Compares projections with higher and lower confluence scores.

Important: the displayed score percentage is a normalized confluence score, not a probability of success.

4. Input Parameters

Analysis Timeframes

  • InpTF0: Lowest analysis timeframe. Default: M1.

  • InpTF1: Second analysis timeframe. Default: M5.

  • InpTF2: Third analysis timeframe. Default: M15.

  • InpTF3: Highest analysis timeframe. Default: H1.

  • InpBars: Number of historical candles analyzed per timeframe. Default: 800.

The selected timeframes should preferably be ordered from lowest to highest.

Market Structure

  • InpPivotStrength: Number of candles used on each side to confirm a pivot. Default: 5.

Higher values generally produce fewer, more selective pivots.

ATR

  • InpATRPeriod: ATR calculation period. Default: 14.

  • InpMaxDistATR: Maximum distance of the first projected pivot, expressed in ATR multiples. Default: 6.0.

Fair Value Gaps

  • InpFVGMinATR: Minimum FVG size relative to ATR. Default: 0.15.

  • InpMaxZones: Maximum number of detected zones per type and timeframe. Default: 5.

Order Blocks

  • InpOBDispATR: Minimum displacement candle body relative to ATR. Default: 1.2.

  • InpOBLookback: Number of candles searched for the opposing candle. Default: 5.

  • InpOBBodyOnly: Use only the candle body for the Order Block boundaries. Default: false.

Fibonacci

  • InpRetrLevels: Custom Fibonacci retracement levels. Default: 0.382;0.5;0.618;0.786.

  • InpExtLevels: Custom Fibonacci extension levels. Default: 1.0;1.272;1.618.

Separate multiple levels using semicolons.

Projected ZigZag

  • InpChainCycles: Number of projection cycles per timeframe. Default: 2.

  • InpMinScore: Minimum confluence score required for a projected pivot. Default: 4.0.

  • InpMaxNodes: Maximum number of projected pivots. Default: 14.

  • InpPathWidth: Projected path line width. Default: 2.

  • InpShowLabels: Show or hide projected pivot labels. Default: true.

Hit Rate Tracking

  • InpWindow: Rolling number of resolved projected pivots. Default: 1000.

  • InpHitTolATR: Target-zone tolerance relative to ATR. Default: 0.25.

  • InpTimeoutMult: Maximum tracking duration multiplier based on estimated time. Default: 3.0.

  • InpTimeoutMinBars: Minimum tracking duration in timeframe candles. Default: 5.

  • InpHiScore: Threshold separating higher-score and lower-score statistics. Default: 7.0.

  • InpMaxOpen: Maximum number of simultaneously tracked projections. Default: 600.

Historical Backfill

  • InpBackfill: Reconstruct historical statistics at initialization. Default: true.

  • InpForceBackfill: Force a complete reconstruction instead of loading saved history. Default: false.

  • InpBackfillBars: Number of lowest-timeframe candles used for reconstruction. Default: 5000.

  • InpBackfillStep: Number of candles between replay steps. Default: 10.

  • InpBackfillPerTick: Number of replay steps processed per timer cycle. Default: 3.

If the terminal becomes slow during reconstruction, reduce InpBackfillPerTick or increase InpBackfillStep.

Order Block and FVG Display

  • InpShowOB: Show or hide Order Blocks. Default: true.

  • InpShowFVG: Show or hide Fair Value Gaps. Default: true.

  • InpZoneDistATR: Maximum distance for displaying zones. Default: 4.0.

  • InpZoneExtend: Zone extension in chart candles. Default: 15.

  • InpHideLowerTF: Hide zones and structures from timeframes lower than the current chart timeframe. Default: true.

Dashboard

  • InpShowDashboard: Enable or disable the dashboard. Default: true.

  • InpDashX: Horizontal dashboard position. Default: 12.

  • InpDashY: Vertical dashboard position. Default: 24.

  • InpDashNodes: Number of projected pivots displayed in the dashboard. Default: 6.

  • InpDashDetails: Display detailed historical statistics. Default: true.

Additional Display Settings

  • InpShowStructure: Display the latest market structure leg for each timeframe. Default: false.

  • InpAutoShift: Automatically enable chart shift to provide space for projected movements. Default: true.

Timeframe and zone colors can also be customized.

5. Historical Statistics

When the indicator starts, it attempts to load previously saved statistical records.

If there is insufficient saved history and historical backfill is enabled, the indicator reconstructs historical projections using available market data.

The backfill process is an approximation based on closed higher-timeframe candles. Its results may differ from the live tracking process.

Statistics are maintained separately for the projected targets and mirrored reference targets.

6. Recommended Configuration

The default configuration is a suitable starting point for intraday analysis:

  • M1

  • M5

  • M15

  • H1

Allow the indicator to load sufficient historical data before interpreting its statistics.

For slower analysis, consider using higher timeframes and adjusting the number of historical candles accordingly.

7. Important Risk Notice

MTF Pivot Projection is a technical analysis indicator. It does not open, modify or close trading positions.

Projected prices, confluence scores and historical hit rates are analytical information only. They do not guarantee that future market movements will reach projected targets.

Market conditions can change rapidly. Always apply your own trading rules and risk management.

The indicator should be evaluated on the instrument, broker feed and timeframes on which it will be used.
おすすめのプロダクト
SMC Workflow Auto EA
Choawana Malaikitsanachalee
English – Product Description (V1.42) SMC Workflow Auto EA — SR / OB / FVG with BOS–CHOCH Confirmation Smart-Money-Concepts Expert Advisor that trades only when a clean SMC setup appears: Order-Block retest after Break of Structure (BOS / CHOCH) confirmation, with optional SR and Fair Value Gap (FVG) confluence. The EA uses pending limit orders, fixed SL/TP or RR-based exits, step-lock trailing and strict risk-controls designed to pass broker validation. What it does Detects swing structure usi
FREE
Auto Fractal Support And Resistance is a powerful multi-timeframe indicator designed for traders who want to trade lower timeframes with higher timeframe accuracy. When your mouse cursor is on a line you can easily see fractal describtion and index of fractal candle  and timeframe of that fractal candle.  This indicator automatically detects H1 and D1 fractal levels and draws clean horizontal support and resistance lines on any lower timeframe chart (M1, M5, M15, M30). Now you can see where the
LT Support Resistance - サポート&レジスタンスを100%自動で識別 手動でサポートラインやレジスタンスラインを引く作業に、時間を取られて疲れていませんか?あるいは、重要なレベルをいつも見落としてしまい、悔しい思いをしていませんか?LT Support Resistanceは、そのような煩わしい作業をなくすために開発されました。複数のタイムフレーム(時間足)を同時に分析し、取引しているアセットの最も重要なゾーンを自動的に識別してチャート上に描画します。 == 重要レベルのスマート自動化 == 主観的で時間の Gann(ガン)かかる手動のライン引きとは異なり、このインジケーターは価格の履歴を分析し、重要な反転ポイントを特定して、価格が「実際に」意識しているサポート・レジスタンスラインを描画します。その結果、客観的で素早い、データに基づいた分析が可能になります。 == 主な特徴 == 100% 自動検出: 手動による分析なしでサポート/レジスタンスを識別 マルチタイムフレーム (MTF): M5(5分足)チャート上に、H1、H4、D1、W1のレベルを同時に表示可能 ス
Supply and Demand with Fibonacci and Classic Pivot What it does This indicator draws supply and demand zones on your chart from pivot points. Ordinary pivot indicators draw thin lines. This one draws zones (price areas), because price usually reacts to an area and rarely to one exact price. You can show up to 10 different periods at once (for example H1, H4, Daily and Weekly), and the indicator highlights the places where zones from different periods overlap. Main features Fibonacci pivots, Clas
Elliott Wave Pro X
Murtadha Majid Jeyad Al-Khuzaie
Elliott Wave Pro X Professional Automatic Elliott Wave Analysis for MetaTrader 5 Elliott Wave Pro X is an advanced automatic Elliott Wave indicator designed for traders who want to identify high-probability market structures with precision and confidence. The indicator continuously analyzes price action and applies Elliott Wave rules and guidelines to detect impulse waves, corrective patterns, diagonals, triangles, and complex market corrections. The indicator helps traders understand the cur
Forex Uncovered PRO v4.60 Professional Support & Resistance Breakout Indicator for MetaTrader 5 Overview Forex Uncovered PRO v4.60 is a professional Support & Resistance Breakout indicator built for MetaTrader 5. Unlike traditional trend indicators, Forex Uncovered focuses on Price Action by automatically identifying significant swing highs and swing lows, building dynamic support and resistance zones, and detecting confirmed breakout opportunities. To reduce false signals, the indicator combine
Caicai L&S Yield Histogram Important Notice: This indicator is an integral tool of the automated EA Caicai Long and Short Pair Trading . This indicator visually displays the percentage deviation (Yield %) of a pair's current spread relative to its own historical mean. It is an excellent tool for quickly visualizing the gross financial potential of a market distortion in Long & Short operations. Main Features: Percentage Visualization: Understand the size of the distortion in palpable percentage
这是一个基于前一个交易日的最高价、最低价和收盘价来计算的枢轴点指标,具体公式如下: 计算前一日的 Pivot Point (枢轴点): Pivot = (High + Low + Close) / 3 计算 Resistance 1 (R1) 、 Support 1 (S1) ​ 等: R1 = (2 * Pivot) - Low S1 = (2 * Pivot) - High R2 = Pivot + (High - Low) S2 = Pivot - (High - Low) 与市面上其他的枢轴点指标相比,该指标主要有以下4个特点: 1、可以修改交易日的开始时间; 2、可以设定支撑压力线的颜色; 3、可以设定是否显示各个支撑压力线对应的价格; 4、可以设定天数用以显示枢轴点的历史记录; 开发这个指标的最初目的是为了解决设定交易日开始时间的问题,接下来会进一步说明。基于计算公式,我们需要获得上一个交易日的最高价、最低价和收盘价,在夏令时,北京时间6点是开市时间,大多数交易平台服务器的0点对应的是北京时间的6点,但是香港的服务器6点才是对应的是北京时间的6点。如果你有多个平台,且存在
Unmask Institutional Market Shifts with Precision Institutional Divergence Reversal Pro Most divergence indicators fail because they are "noisy"—they find every tiny curve in the market, leading to false signals. Institutional Divergence Reversal Pro is engineered to filter out retail noise and identify high-probability reversal zones where "Smart Money" is active. By combining multi-timeframe monitoring with a proprietary Quality Scoring System , this tool ensures you only focus on the setups t
Created by trader and journalist Larry Williams, Setup 9.1 is a simple strategy that is easy to understand and execute, which is why it is so well known and popular in the world of traders and technical analysis. It is a REVERSION setup, where operations are sought when the moving average changes direction. Setup Logic With the open candlestick chart, at any time chart, it is only necessary to add the 9-period Exponential Moving Average (MME9). That done, we look for assets in which the MME9
「上位足のトレンド方向を確認したいけど、いちいちチャートの時間足を切り替えるの、面倒だな~」 そんなあなたのために、この商品が存在します!! Trend Map - 商品概要 各時間足(あるいは各フラクタル構造)において、トレンド方向を記録して常にチャート上に表示しておけるツールです。時間足を変更してもパネルの表示はそのままなので、こまめに時間足を変更しながらチャートを見る方にオススメです。トレードする際に素早くトレンド方向を確認できるので、ノンストレスでトレードを行うことが可能になります。また、各時間足(フラクタル構造)での高安値を認識するためのラインをワンボタンで生成・削除することができます。自動売買の機能はないため、トレード補助のツールとしてお使いください。 - 機能説明 ①パネルユニット パネルUI全体のうち、縦一列分を指します。最大10個まで表示可能です。パネルユニットごとにテーマカラーを設定できます。 ②説明ラベル パネルユニットの一番上のラベルです。時間足の表示など好きなテキストを設定できます。また、設定から表示をOFFにすることもできます。 ③矢印
N/B: All our product purchase comes with our free ‘’DAILY   SCALPER EA’’ -   bit.ly/4qlFLNh Whatsapp Developer for yours after successful purchase The Holy Grail MotherBar Indicator: Your Ultimate Path to Consistent Trading Profits   The Problem With Every Other Indicator You've Tried Let me guess - you've spent countless hours and hundreds (maybe thousands) of dollars on indicators that promise the world but deliver mediocre results. You've tried: · Lagging indicators that tell you what
上位タイムフレームに基づくフラクタルレベルは、上位タイムフレームのフラクタ ルに基づく正確なサポートおよびレジスタンスレベルを構築するよう設計された強力な ツールです。 仕組み: このインディケータは、上位タイムフレーム上のフラクタルのレ ベルを分析し、現在のチャートに表示します。インジケータのプロパティで上位タイムフレームを簡単に 調整でき、最大限の精度と戦略との関連性を得ることができます。 上位タイムフレームに基づくフラクタルレベルを使用する利点: 早 期 シ グ ナ ル 検 出:上位タイムフレームのフラクタルレベルを下位タイム フレームで見ることができるため、潜在的な売買シグナルをその開始時 点で識別することができます。 損益率の向上:低いタイムフレームでの早期エントリーにより、ストップロスを短く設定できるため、取引効率が大幅に向上します。 便利なアラート:重要なシグナルを見逃しません - エントリーやエグジットの機会を即座に通知します。 分析精度の向上:本当に重要な重要レベルに集中し、不必要な市場ノイズを無視します。 ハイヤータイムフレームに基づくFractal Lev
ZigZag Market Structure Breakout Pro ZigZag Extras Display BreakOut points is a MetaTrader 5 indicator for traders who use ZigZag, breakout points, market structure, BOS, CHoCH, swing high, swing low, support and resistance, and higher timeframe bias in their trading analysis. Main Benefits Displays confirmed ZigZag swing highs and swing lows Marks BOS Up, BOS Down, CHoCH Up and CHoCH Down Shows Depth Highest High and Depth Lowest Low lines Adds HH, HL, LH and LL structure labels Includes HTF bi
Delivery State Change Map
Martin Alberto Nunez Da Silveira Van Caester
CISD Delivery Map displays Change in State of Delivery levels from two configurable timeframes and summarizes whether the active context is aligned or mixed. Main functions - Two configurable timeframes; defaults are M15 and H1. - Bullish and bearish CISD detection. - ATR displacement filter for confirmation. - Configurable search for the delivery origin. - Active-level and broken-level management. - Forward projection of confirmed levels. - Multi-timeframe alignment dashboard. - Optional popu
HTF Open Markers + ICT Silver Bullet Zones — Usage & Strategy Guide What it draws Session 1 / Session 2 lines : vertical lines at the open of every bar on two independently configurable higher timeframes (defaults: H4 and D1), including a projected line for the rest of today's not-yet-opened bars on sub-daily timeframes, so you can see where the next candle will open before it happens. ICT Silver Bullet zones : shaded rectangles over the three classic ICT kill-zone windows, converted from New Yo
FREE
未来予測ツール - 過去の類似予測指標 概要 将来予測ツールは、直近の価格パターンを過去の類似パターンと比較し、その後に何が起こったかを要約します。買い、売り、中立の確率、経験的バンド付きの予測価格推移、そして予測の根拠となる過去の類似パターンの一覧が表示されます。 出力結果はすべて過去のデータに基づく統計的推定値であり、将来の結果を保証するものではありません。 仕組み 1. パターンキャプチャ:直近のN本のバー(始値、高値、安値、前回の終値に対する終値)をATRでスケーリングすることで、さまざまなボラティリティ条件を比較できます。 2. 因果関係の探索:過去の事例のみを検索対象とし、結果が既に判明している類似事例のみを対象とします。将来のデータは使用しません。類似事例は間隔を空けて配置することで、同一の市場事象が二重にカウントされないようにします。 3. 重み付け:形状が近いほど重みが高くなります。オプションの最新性重み付けでは、より新しい類似例に重みが高くなります。 4. 結果クラス:予測期間終了後、各類似事例は上昇、下降、または中立に分類されます。中立ゾーンはATR単位
Atbot
Zaha Feiz
4.69 (55)
AtBot: どのように機能し、どのように使用するか ### どのように機能するか MT5プラットフォーム用の「AtBot」インジケーターは、テクニカル分析ツールの組み合わせを使用して売買シグナルを生成します。単純移動平均(SMA)、指数移動平均(EMA)、および平均真実範囲(ATR)インデックスを統合して取引機会を特定します。さらに、Heikin Ashiキャンドルを使用してシグナルの精度を向上させることもできます。 購入後にレビューを残すと、特別なボーナスギフトを受け取ります。 ### 主な機能: - 再描画なし: シグナルはプロット後に変更されません。 - 再描画なし: シグナルは一貫しており、変更されません。 - 遅延なし: 遅延なくタイムリーなシグナルを提供します。 - 多様な時間枠: あらゆる時間枠で使用可能で、取引戦略に合わせることができます。 ### 操作手順: #### 入力と設定: - firstkey (TrendValue): トレンド検出の感度を調整します。 - Secondkey (SignalValue): 売買シグナル生成の感度を定義します。 - ma
Eazy RSI Divergence
Gawain Athur Stephan Cloete
Eazy Divergence is a non-repainting MT5 indicator designed to automatically detect and plot Regular and Hidden divergence signals in real time Key Features Dual-Window Plotting: Displays divergence trendlines and text badges directly on both the main price chart and the RSI subwindow. 100% Non-Repainting: Uses left/right pivot strength confirmation so signals stay fixed once drawn. Full Multi-Timeframe Support: Adapts instantly to whatever chart timeframe you are viewing. Fully Customizable: Eas
片側最大7本のフィボナッチ・ピボットレベル。リテスト回数を表示するグレード別の需給ゾーンをお探しなら: Supply Demand RSJ PRO Pivot Point Fibo RSJ は、日足のピボットポイントと、フィボナッチ比率で計算したサポート・レジスタンスレベルを描画します。 前日の高値・安値・終値から、最大7本のサポートレベルと7本のレジスタンスレベルを表示します。トレーダーはこれらのレベルを、日中のエントリー、決済、ストップ配置を計画するための参考エリアとして利用します。 特徴 最大7本のサポートと7本のレジスタンス 4種類の計算方法: 3種類のフィボナッチ方式とクラシックピボット 各レベルの色を個別に設定可能 入力パラメータ Pivot Type Pivot Fibo RSJ1 = フィボナッチ比率セット1 Pivot Fibo RSJ2 = フィボナッチ比率セット2 Pivot Fibo RSJ3 = フィボナッチ比率セット3 Pivot Fibo Classic = クラシックピボットの計算 Minimum Pivot Levels: 片側3、4、5、6、7本のい
FREE
ICT Institutional Zones Pro — Trade with Institutional Precision Stop wasting time manually drawing key ICT levels every day. ICT Institutional Zones Pro is a professional-grade MT5 indicator built for traders who use ICT (Inner Circle Trader) and Smart Money Concepts (SMC) to read market structure with precision. This indicator automatically maps the most important institutional levels directly on your chart, helping you instantly identify where smart money is likely accumulating, distributing
SPECIAL LAUNCH OFFER: $30 (1-Month Rent) Limited time offer to build our community and gather feedback! AmbM GOLD Institutional Scalper A high-precision M5 algorithm for XAUUSD (Gold) , engineered to trade exclusively at Institutional Liquidity Levels ($5/$10 psychological marks). PERFORMANCE DATA (BUY ONLY) • Win Rate: 87.09%. • Safe Growth: +$4,113 profit on $10k (13.75% Max Drawdown). • Extreme Stress Test: Successfully generated +$22,997 in a 5-year stress test (2020-2026), proving
CleanSMC Lite CleanSMC Lite is a MetaTrader 5 custom indicator designed to help traders analyze market structure using a clean Smart Money Concepts style workflow. The indicator focuses on visual structure mapping, demand and supply zones, fair value gap detection, equal highs and equal lows, and optional BUY/SELL signal arrows. The tool is built for discretionary technical analysis and is intended to support chart reading, not to replace a complete trading plan. It does not execute trades, open
Pivot Points MT5 is a universal color multicurrency/multisymbol indicator of the Pivot Points levels systems. You can select one of its three versions: Standard Old, Standard New and Fibo . It plots pivot levels for financial instruments in a separate window . The system will automatically calculate the Pivot Point on the basis of market data for the previous day ( PERIOD_D1 ) and the system of support and resistance levels, three in each. A user can choose colors for the indicator lines. The on
MetaTraderでは、複数の   水平線   を描画し、それぞれの価格レベルを追跡するのは面倒な作業になることがあります。このインジケーターは、価格アラートの設定、サポートとレジスタンスの表示、その他の手動用途のために、等間隔で複数の水平線を自動で描画します。 このインジケーターは、短期間で売買による利益を狙いたい初心者のFXトレーダーに最適です。水平線は、相場がトレンド中またはレンジ相場である場合に、エントリーの可能性があるゾーンを見つける手助けをしてくれます。 機能 入力設定に基づいて、瞬時に複数の水平線を描画可能。 各水平線を区別しやすいように、カラフルなカラーテーマを採用。 複数の取引セッションのレンジを追跡するのに必須のツール。 価格が水平線にタッチした際にアラートを送信。 アラート間に間隔を設定でき、過度な通知を防止。 完全にカスタマイズ可能。 解説 このインジケーターは、入力設定で指定されたデータと指示に従って水平線を描画します。価格がこれらの水平線でどのように反応するかを観察することで、重要なサポート・レジスタンス付近でのトレード機会を見極めることができます。
Trading Discipline Trend Dashboard は、自分の口座の確定した取引履歴だけを読み、4つの特定のパターンを直近7日間の推移として表示するツールです。1回だけなら気にならないことが、毎週繰り返されていないかを見られるようにします。予測も助言もしません。パネルに出るのは、すでにこの口座で発生した事実だけです。 数字の作り方: 全銘柄・全マジック番号を対象に、最大37日分の確定した約定を読み込みます(チャートの銘柄に限らない、口座全体の集計です)。4つの行は、それぞれ定義が異なります。Post-loss oversize は、損失確定から10分以内・かつ30日基準値(同条件のエントリーの中央値ロット)を超えるロットで開かれた新規エントリーを数えます。これは無料の Trade Behavior Mirror と同じ定義です。Win-streak oversize は、連勝が続いている間に、同じ種類の30日基準値を超えるロットで開かれた新規エントリーを数えます。これは無料の Win Streak Size Creep Mirror と同じ定義です。Symbols
SMC Session Scanner MT5 is a panel indicator for MetaTrader 5 that watches many symbols and timeframes for smart-money structure and session levels. For each symbol and timeframe it shows one of these: a fresh break of structure (BOS), a change of character (CHoCH), or a fresh liquidity sweep. It also shows price inside a live order block or fair value gap. Otherwise it shows the latest break and how long ago it was. A Session column shows the session now. It also shows today's first close beyon
Adaptive Trend Lines
Henri Salvatore Bigatti
4.76 (25)
This indicator shows the TLH and TLL and some trendlines that allow us to estimate the trend of market.  It also shows the values of the angles of the lines in percentage in points (pip) , the standard deviation, and the trend of each line, and when it breaks the lines of support and resistance (TLH and TLL). And finally, it also shows the points identified as supports and resistances through the fractal algorithm in the graph. The high and low trend lines are supported by the highs and lows, th
FREE
Apex Break PRO は、MetaTrader 5 向けの不再描画ピボットトレンドラインブレイクアウトインジケーターです。ピボット高値とピボット安値を検出し、連続するピボット間に動的な斜めトレンドラインを描画し、確定したバーの終値でそれらのトレンドラインをブレイクした際に買いシグナルと売りシグナルを生成します。すべてのシグナルは最大4つの独立したコンフルエンス層——EMAトレンド、RSI境界値、出来高急増検出、ADXトレンド強度——を通じてフィルタリングされ、何個の条件が一致したかをトレーダーが即座に確認できるスター評価システムで格付けされます。ATRベースのストップロスと3つのテイクプロフィットレベルが各シグナルに対して体系的なリスク管理を提供し、リアルタイムのダッシュボードは方向性、フィルター状態、および到達チェックマーク付きの取引レベルの追跡を表示します。 MT4バージョンはこちら:  Apex Break PRO MT4 その他の製品はこちら:   全製品一 覧 ライブ事例や新ツールをご覧になるには、プロフィールをご訪問いただき、アップデートを見逃さないようフレンドリク
Supreme Power House reads market structure, grades every signal against seven filters and draws a complete trade plan for each one. It prints a BUY or a SELL when a candle closes beyond the latest swing: a change of character (CHoCH) when the break turns the structure, a break of structure (BOS) when it continues it. Each signal comes with an entry, a stop, up to three targets and a grade from A to C, surrounded by an adaptive trend ribbon, ICT zones and a dashboard of six timeframes. Everythin
このプロダクトを購入した人は以下も購入しています
Trend Sniper X
Sarvarbek Abduvoxobov
4.86 (44)
Trend Sniper X は、トレードの方向性と潜在的な反転ポイントを明確かつ正確に特定するのに役立つ、MetaTrader 5 用のマルチタイムフレーム・トレンドフォロー指標です。 MT4用: https://www.mql5.com/en/market/product/193245 価格情報: 現在の価格はプロモーション価格であり、今後のアップデートや新機能のリリースに伴い変更される場合があります。 ボーナス特典: このインジケーター用の無料自動売買アシスタントEAを入手するには、購入後に an 著者(開発者)へメッセージをお送りください。 Code2Profit チャンネル マルチタイムフレーム分析で相場をマスターしよう! Trend Sniper X で勝率を最大化する方法:重要なルールとセッションのコツ 技術仕様 プラットフォーム MetaTrader 5 インジケータータイプ マルチタイムフレーム・トレンドインジケーター 操作タイムフレーム あらゆるチャートタイムフレームに対応。個別に選択可能な上位タイムフレーム (M1–MN1) を搭載 主要銘柄 FX、ゴールド (X
新たな王者が登場 - インジケーター + 注文管理表示(TP1 + TP2 + TP3)+ オプションのTelegramシグナル送信機能付き(無料) (完全なトレード&シグナルシステム) ゴールド向け最高のEA: Gold Slayer このインジケーターには、高度な戦略、カスタマイズ可能な注文管理システム、そしてエンベロープ拡張を組み合わせた平均回帰システムが搭載されています。さらに、RSIなど複数のインテリジェントな確認フィルターによって、高確率の反転エントリーをBUY・SELLシグナルとして検出します。 単にトレードを学ぶだけでなく、複数ポジションを効果的に管理し、過去に利益を出しているオープンポジションで損失トレードをカバーする方法も学べます。 M5向けに構築・最適化されており、流動性が高くシグナルの精度が安定しているBTCUSDとXAUUSDで優れたパフォーマンスを発揮します。 このインジケーターは、ATRを基に自動計算されたエントリー、ストップロス、テイクプロフィットレベルを備えた明確なLong・Shortシグナルを提供するため、リスク管理が最初から組み込まれています。 マ
Smart Trend Trading System — MetaTrader 5 ご購入後、MQL5で私にメッセージをお送りいただくと、Smart Universal Expert Advisorを無料で受け取れるほか、オンライン講座、PDFマニュアル、非公開グループへのアクセスもご利用いただけます。 STTSは、トレンドの方向、エントリー・決済シグナル、反転ゾーン、重要な価格水準をチャート上にまとめて表示します。システムを参考に手動で取引することも、別の対応EAを接続し、ご自身で選んだ設定に基づいて自動売買することもできます。 ひとつのシステム、4つのトレードアプローチ STTSのトレードアプローチは、大きく4つのカテゴリーに分かれています。 • スキャルピング — 短期的なシグナルや相場の動きを捉えます。 • トレンドトレード — 方向性を評価し、トレンド内の機会を探します。 • 反転トレード — 反転の可能性があるゾーンや方向の変化を見つけます。 • 出来高トレード — 出来高に基づく情報を使い、市場の活発さを評価します。 エントリー・決済の矢印、トレンド情報、サポート・
Entry Points Proは、注文を出す前に、どこでエントリーし、どこにストップを置き、どのロットで取引するかを示します。 価格 現在 149 USD、この価格での販売は残り1本です。その後は 199 USD に値上がりし、最終価格は 349 USD です。 私は相場のトレードで収入を得ており、それを公開しています。だから、このインジケーターを誰にでも売る必要はありません。自分の頭で考えるトレーダーのためのツールであり、魔法のボタンではありません。 矢印はローソク足の確定時に表示され、リペイントしません。設定は2つ:あなたの資金と1回のトレードあたりのリスクです。 お支払い前にご確認ください:無料デモはMT5のストラテジーテスターで動作し、2分で済みます。ご購入後は、私が個人的に設定をお手伝いします。 2019年、私はこのインジケーターの実力を世界中に示しました。そのシグナルに従って手動で、リアル口座で、公開の場でトレードしたのです。口座はMyfxbookでモニタリングされ、私はこの実験の経過をFacebookで詳しく発信していました。結果:4か月で10,000ドルが941,4
あなたのトレード優位性を視界に入れよう! M5 Sniper は MeanFX による新しいインジケーターです。 正確なトレードシグナル と 適応型TP/SLレベル を組み合わせることで、結果として可能な限り最高の統計的トレードを実現します! 5回購入されるごとに価格が上昇し、次の価格は69$です 購入後に私にメッセージを送っていただければ、ヒント/ガイドとボーナスEAをお受け取りいただけます 何が他と違うのでしょうか? Gold XAUUSDにおける 実証済みの統計的パフォーマンス ( ほぼすべてのアセットで機能します 。一貫した結果が得られないまま何でも扱おうとするのではなく、1つの時間足をマスターすることに重点を置いています) 1日あたり1~8回のトレード を各シンボルで実行し、高い勝率と、すべての統計的優位性をこちら側に持つことができます チャート上には 確認済みの BUYおよびSELLシグナルのみを表示 適応型TPおよびSLレベル を各トレードごとにインジケーターが生成 平均Winrate 75%+ 平均 Signal Ratio 最低1.1+ アラーム と通知を 携帯電話
SuperScalp Pro
Van Minh Nguyen
4.54 (37)
SuperScalp Pro - Professional Multi-Layer Confluence Scalping System SuperScalp Proは、複数の高度な確認フィルターを追加することで、従来のSupertrendを強化したスキャルピング向けインジケーターです。誤ったシグナルを大幅に減らしながら、成功する可能性がより高いBuy/Sellの取引機会を見つけるのに役立ちます。 BuyとSellの矢印がチャート上に明確に表示され、ATRに基づくStop LossとTake Profitのレベルもリアルタイムで自動計算されます。 ご購入後、MQL5で私にメッセージを送っていただくと、SuperScalp Pro Auto Trader EAを無料で受け取れるほか、ユーザーガイドとプライベートグループへのアクセスもご利用いただけます。 推奨設定ファイルをダウンロード: [Set File] 詳細なドキュメントは製品ブログでご覧いただけます: [User Guide] 最新情報を受け取るには公式チャンネルにご参加ください: [Official Channel] Sup
Gold Trend Coach MT5
Cristhian Alexander Gaibor Cuasquer
4.2 (10)
Gold Trend Coach は MetaTrader 5 用のゴールド(XAUUSD)トレンドインジケーターです。ローソク足の確定時に確認される売買シグナル(リペイントなし)、ストップロスと3つのテイクプロフィット、エントリーから TP3 まで導くコーチ、マルチタイムフレームパネル、スマホと Telegram へのアラートを備えています。ロンドン・ニューヨーク時間の M1・M5 スキャルピングと M15 デイトレード向けです。 ボーナス:Gold Trend Coach 用の自動売買 EA を無料でお渡しします。 購入後にメッセージをいただければ、インジケーターのシグナルを自動で売買する EA と、すべてのシグナル、エントリー、ストップ、到達したターゲットを Telegram のチャット、グループ、チャンネルに送る Telegram Alert Bridge を、set ファイルと設定ガイド付きでお送りします。 発売価格 $39 は最初の 20 本限定で、すでに完売しました。現在の価格は 40 本まで $45、その後 $59。予定している最終価格は $79 です。 ゴールドのイン
SMC Intraday Formula
VividMind Digital Solutions
5 (26)
まず正直に言いましょう。 どんなインジケーターも、それ単体であなたを利益化させることはできません。もしそう言う人がいるなら、それは夢を売っているだけです。完璧な売買シグナル(矢印)を表示するインジケーターは、いくらでも“完璧に見せる”ことができます。正しい過去の区間を拡大して、勝ちトレードだけを切り取ればいいだけです。私たちはそれをしません。 SMC Intraday Formula はツールです。 市場構造を読み取り、最も高い確率の価格ゾーンを特定し、今この瞬間のスマートマネーの痕跡をシンプルな言葉で正確に示します。最終判断はあなたが行います。トレードを実行するのもあなたです。しかし今は「希望」ではなく「精度」でエントリーできます。 私たちはこのインジケーターを、ゴールド(XAUUSD)および主要FX通貨ペアで約3年間、日々のスキャルピングに使用してきました。M1、M5、M15、M30の主要ツールです。これは未来を予測しようとするのではなく、今まさに形成されている高確率セットアップを示し、その理由を説明します。 他のすべてのインジケーターと何が違うのか? ほとんどのトレーディングイ
Gann Made Easy   は、ミスター・ギャンの理論を使用した取引の最良の原則に基づいた、プロフェッショナルで使いやすい外国為替取引システムです。 W・D・ガン。このインジケーターは、ストップロスとテイクプロフィットレベルを含む正確な買いと売りのシグナルを提供します。 PUSH通知を利用して外出先でも取引可能です。 ご購入後、取引方法の説明と優れた追加インジケーターを無料で入手するには、私にご連絡ください! おそらく、ギャンの取引手法についてはすでに何度も聞いたことがあるでしょう。通常、ギャンの理論は初心者のトレーダーだけでなく、すでにある程度の取引経験がある人にとっても非常に複雑なものです。なぜなら、ギャンの取引手法は理論的にはそれほど簡単に適用できるものではないからです。私はその知識を磨き、最良の原則を私の外国為替インジケーターに組み込むために数年を費やしました。 このインジケーターは非常に簡単に適用できます。必要なのは、それをチャートに添付し、簡単な取引推奨事項に従うだけです。このインジケーターは常に市場分析の仕事を行い、取引の機会を探します。適切なエントリーポイントを検
ULTRAは、「オールインワン」方式で機能するテクニカル指標です。市場を独自に分析し、売買シグナルを生成し、ストップロス注文を設定するための水準を表示し、利益を確定したり損失を最小限に抑えたりするためにポジションを決済すべきタイミングを提案します。 つまり、市場の分析方法や、水準(ストップロスをどこに設定すべきか)の見極め方がわからなくても、あるいは資金管理に苦労していても問題ありません。ULTRAがすべて代行してくれます! 購入者限定特典 :「ULTRA」インジケーターをご購入後、私にプライベートメッセージをお送りいただければ、「ULTRA BOT」を無料プレゼントとしてお受け取りいただけます。これは、このインジケーターからのシグナルに基づいて、オープンしたトレードを管理するのに役立つ特別なツールです(各トレードにストップロスを設定し、最適な結果が得られるよう、戦略のルールに従って自動的にトレードを決済します)。  また、インジケーターを最大限に活用できるよう、さまざまな資産向けの既成の設定も購入者の皆様に提供しています。これらの「超お得な特典」を無料で入手するには、私へダイレクトメ
Boba Analysis Suite
Trade Ready Solutions LLC
5 (2)
Boba Analysis Suite Boba Analysis Suite は、MetaTrader 5 向けの分析インジケーターです。市場構造、重要な価格帯、相場全体の状況を、一つのチャート画面にまとめて表示します。 トレーダーおよびトレーディング指導者としての実務経験をもとに開発され、市場の方向性の評価、重要な価格水準の特定、複数の時間足を組み合わせた分析など、体系的な分析プロセスを支援します。 相場の背景を踏まえた分析 個々のシグナルの意味は、相場の状況によって変わります。Boba Analysis Suite は、現在のチャート状況をより大きな市場構造と関連付け、あらかじめ定めたルールに沿って取引アイデアを検討するための分析を支援します。 主な分析機能: トレンドと市場構造: 市場の方向性と、その背景にある構造を評価します。 重要な価格帯と価格水準: さらに分析すべき重要な領域を視覚的に表示します。 複数の時間足: 異なる時間足の情報を組み合わせ、相場全体の状況を評価します。 視覚的な分析プロセス: 分析情報をチャート上で直接確認できます。 自主的な取引判断を支援 Boba
次回アップデート — バージョン 2.52 近日公開!【新機能】 市場分析とトレードワークフローを強化する、4つの主要な新機能にご期待ください 皆様のトレードニーズに応える4つの新機能により、市場分析を次のレベルへと引き上げます。新機能をご紹介します: 1. TRADE OVERVIEW DASHBOARD 2. CONFLUENCE AT ZONE 3. STRONG & WEAK HIGH/LOW 4. OTE 1. TRADE OVERVIEW DASHBOARD 市場全体の状況をより簡単に把握できるダッシュボードです。トレード判断をサポートするガイダンスを提供し、市場分析とトレード計画を体系的に行えるよう支援します。すべてを1つの画面で確認できます。 マルチタイムフレーム市場概要(Multi-Timeframe Market Overview) 市場の方向性と価格構造をより明確に把握 市場状況をすばやく確認 体系的な市場分析とエントリー計画のためのガイダンス 2. CONFLUENCE AT ZONE 価格が重要なゾーンに入るとき…いくつのサポート要因が一致しているかを確認で
M1 SNIPER は使いやすいトレーディングインジケーターシステムです。M1時間足向けに設計された矢印インジケーターです。M1時間足でのスキャルピングのためのスタンドアロンシステムとして、また既存のトレーディングシステムの一部としても使用できます。このトレーディングシステムはM1時間足での取引に特化して設計されていますが、他の時間足でも使用できます。元々、この手法はXAUUSDとBTCUSDの取引用に設計しましたが、他の市場においても役立つと考えています。 インジケーターのシグナルは、トレンドの方向と逆方向に取引できます。インジケーターのシグナルを利用して両方向に取引するのに役立つ特別な取引テクニックをご紹介します。この手法は、特別な動的なサポートとレジスタンスの価格帯を利用することに基づいています。 ご購入後、M1 SNIPER矢印インジケーターをすぐにダウンロードできます。さらに、M1 SNIPERツールのすべてのユーザーに、以下のスクリーンショットに表示されているApollo Dynamic SRインジケーターを無料で提供しています。この2つのインジケーターを組み合わせることで
FiboSniper Pro – Multi-Filter Fibonacci System with Auto SL/TP and Control Panel FiboSniper Proは、動的なFibonacci Envelopesと複数の確認フィルターを組み合わせ、選別されたBuyおよびSellシグナルを生成するテクニカルインジケーターです。FibonacciレベルはMoving AverageとATRを基に計算され、その後ADX、EMA、RSI、ATR、Volume、Time、Candle構造によってフィルタリングされます。インジケーターは、ATRに基づく自動Stop LossおよびTake Profitレベルをチャート上に直接表示し、さらに迅速な調整が可能なインタラクティブControl Panelを提供します。 ご購入後、MQL5で私にメッセージを送っていただくと、Auto Trader Xを無料で受け取れるほか、このインジケーターの取引シグナルを自動化する方法についての説明もご利用いただけます。 User GuideとSet Files: [Click here] 完全
Auto Optimized SpeedAngle は、継続的なウォークフォワード最適化(WFO:Walk-Forward Optimization)によりカーブフィッティング(過剰最適化)を排除した、機関投資家レベルのモメンタムベクトルシステムです。市場レジームの変化時に効果が低下する静的な入力に依存せず、アウトオブサンプル(OOS)検証を用いてパラメーターを動的に再キャリブレーションすることで、表示されるシグナルが単なる過去の偶然ではなく、確実な統計的優位性に基づいていることを保証します。 主な機関投資家向けフレームワーク ウォークフォワード最適化エンジン: ルックバック期間やしきい値の数千に及ぶ組み合わせを継続的にスキャンし、データをインサンプルとアウトオブサンプルに厳格に分離します。未検証のデータ環境において数学的優位性が証明された場合にのみ、新しいパラメーター設定を採用します。 定量的目的関数: 単なる純利益の追求ではなく、機関投資家レベルの安定性指標をターゲットとします。システム品質ナンバー(SQN)、期待値(1トレードあたりの平均Rマルチプル)、またはネットRの最適化を選
Adaptive Price Action Engine インジケーターを購入すると、EAが無料に マルチタイムフレーム対応・自己最適化トレンド&ローソク足パターン分析 市場環境は常に変化しており、すべてのPrice Actionパターンが、あらゆる市場環境で同じ価値を持つわけではありません。 Adaptive Price Action Engine は、変化する市場環境への適応を目的として、 トレンド構造、マルチタイムフレーム分析、ローソク足パターン、統計的最適化 を1つの分析フレームワークに統合しています。 2つのアダプティブモード Dual Alpha Trend Mode 低い時間足と高い時間足のAlpha Trendパラメータを自動的に探索し、直近の市場動向に合わせてトレンド判定を適応させます。 Candlestick + Alpha Mode Alpha Trendによる市場レジーム判定と、 22種類の強気・弱気ローソク足パターン を組み合わせます。すべてのパターンを同じように扱うのではなく、さまざまなパターンの組み合わせを統計的に評価し、選択された市場環境において過去
Crystal Heikin Ashi Signals—Professional Trend & Signal Detection Indicator Advanced Heikin Ashi Visualization with Intelligent Signal System for Manual & Automated Trading Final Price: $149 ---------> Price goes up $10 after every 10 sales . Limited slots available — act fast . Overview User Guide PDF Crystal Heikin Ashi Signals is a professional-grade MetaTrader 5 indicator that combines pure Heikin Ashi candle visualization with an advanced momentum-shift detection system. Designed for both m
「Scalper Vault」は、デイトレードで安定した成果を目指すトレーダーのために設計された、強力かつ充実した機能を備えたトレーディングシステムです。 この高精度なインジケーターは、それ単体で完結するトレーディングシステムとして機能し、FXやバイナリーオプションのトレーダーに、機関投資家レベルの分析を提供します。 ご購入後、ぜひご連絡ください。 トレードのヒントに加え、豪華なボーナスをプレゼントいたします! 「Scalper Vault」を活用すれば、勘に頼った判断や複雑な手動分析は不要です。使いやすいトレード手法に集中し、純粋に「エントリー・決済」という実行フェーズに専念できます。 高精度なトレンドフォロー・シグナル:中核となるアルゴリズムが市場構造を分析し、主要なトレンド方向に沿った高確率なシグナルを提示します。これにより、誤ったエントリーを大幅に削減できます。 精度の高い天井・底の検知:市場の勢いが尽きたポイントをスキャンし、反転の可能性が高いゾーンを特定します。 ギャン(Gann)理論に基づく売買ゾーン:数学的な「ギャン・レベル」を自動的にチャート上に描画します。機関投資
トレンドキャッチャーインジケーター トレンドキャッチャーインジケーターは、開発者独自の適応型トレンド分析指標を組み合わせることで、市場価格の動きを分析します。短期的なノイズを除去し、根底にあるモメンタムの強さ、ボラティリティの拡大、価格構造の挙動に焦点を当てることで、真の市場方向性を特定します。また、移動平均線、RSI、ボラティリティフィルターなどの平滑化およびトレンドフィルタリング機能を備えたカスタマイズ指標も使用します。 実際の運用状況のモニタリングやその他の製品については、こちらをご覧ください: https://www.mql5.com/en/users/mechanic/seller ご注意ください。私はTelegramでEAや設定を販売していません。詐欺です。すべての設定はブログで無料で公開しています。 重要!ご購入後すぐにご連絡ください。手順とボーナスをお送りします!
Atomic Analyst — MetaTrader 5 ご購入後、MQL5で私にメッセージをお送りいただくと、Smart Universal Expert Advisorを無料で受け取れるほか、オンライン講座、PDFマニュアル、非公開グループへのアクセスもご利用いただけます。 Atomic Analystは、プライスアクション、トレンドの方向、エントリー・決済シグナル、損切り水準、複数の利確水準をチャート上にまとめて表示します。 シグナルを確認し、取引の状況を理解する Atomic Analystは、分析結果をわかりやすい視覚情報として表示します。 • エントリーの候補を見つけるための買い・売りの矢印。 • 取引計画に役立つ損切り水準と複数の利確水準。 • 市場の方向性を評価するトレンド、強さ、モメンタムの指標。 • より広い市場背景を比較する複数時間足の分析。 • 変化する状況を追うための色分けされたローソク足とアラート。 シグナルと補助分析を併せて確認し、その取引機会がご自身のルールに合うかを判断してください。 短期の取引機会から、より大きな値動きまで Atomic A
Unix Scalper — MetaTrader 5 ご購入後、MQL5で私にメッセージをお送りいただくと、Smart Universal Expert Advisorを無料で受け取れるほか、オンライン講座、PDFマニュアル、非公開グループへのアクセスもご利用いただけます。 セットアップを見つけ、取引プランを確認し、取引方法を選ぶ。 UNIX Scalperは、市場分析、BUY/SELL/WAITの判断、Entry、Stop Loss、TP1、TP2の水準を、見やすいパネルにまとめています。 シグナルと取引プランを確認 • 明確な判断:BUY、SELL、WAIT。 • 明示された水準:Entry、Stop Loss、TP1、TP2。 • 複数時間足の一覧:パネル上で各時間足のシグナルを比較。 • 判断を支える分析:トレンド、モメンタム、出来高、ボラティリティ、サポートとレジスタンス、市場の質。 • 選べるレイアウト:Minimized、Compact、Standard、Full。 シグナルと各水準を確認し、そのセットアップがご自身の取引ルールに合うか判断してください。 ゴール
SIO Oscillator:自己最適化型セミバリアンス・インバランス・オシレーター インジケーターをご購入いただくと、それをベースにしたエキスパートアドバイザー(EA)を無料でお受け取りいただけます。 多くのオシレーターは、すべての価格変動を同じように扱います。SIOは上昇圧力と下降圧力を分けて捉え、その間のインバランス(不均衡)を測定することで、買い手と売り手のどちらが本当に相場を支配しているかを示します。インバランスが極値に達すると、SIOはエントリー、ストップロス(Stop Loss)、テイクプロフィット(Take Profit)の水準を伴う明確なシグナルを表示します。 SIOの大きな特長は、固定パラメーターに頼らないことです。内蔵の自己最適化機能が、現在の銘柄と時間足に適したパラメーターを継続的に探索し、使用する前に検証します。 2つのシグナルモード 平均回帰(Mean Reversion):インバランスの極値で取引し、均衡への回帰を狙います。 トレンドフォロー(Trend Following):持続的で優勢なインバランスの方向に取引します。 自動モード:最適化機能が直近のデ
Volatility Master for MetaTrader is a real-time dashboard tool that scans up to  50 symbols  to identify high-volatility , trending markets instantly. With bullish/bearish signals, customizable alerts, and a user-friendly interface, it helps you avoid range-bound conditions and focus on high-probability trades. Clarity leads to confidence. Trade confidently and protect your capital effectively with this powerful dashboard. We don't offer free or bonus indicators in exchange of reviews from you.
Smc Pro ToolKit
Talal N Z Aljarusha
5 (14)
SMC PRO TOOLKIT — SMART MONEY ANALYSIS & STRUCTURED TRADE PLANNING SMC Pro ToolKit is a professional Smart Money Concepts analysis workspace for MetaTrader 5. It combines market structure, multi-timeframe analysis, institutional price zones, setup evaluation, confirmation tools, volume context, alerts, and risk planning inside one organized chart environment. One workspace. Multiple layers of confirmation. One structured trading plan. OPEN COMPLETE USER GUIDE MULTI-CONDITION SETUP ENGINE At
マルチ通貨強度・モメンタム・インジケーター MT5 Dynamic Forex28 Navigator は、長年ご愛用いただいている人気インジケーターの進化形であり、5つの力を1つにまとめたものです。 Advanced Currency Strength28 Indicator (700件のレビュー) Advanced Currency IMPULSE with ALERT (530件のレビュー) Currency Strength EXOTICS GOLD Impulse with Alert CS28 Combo Signals (最近のボーナス) 4つのインジケーターを購入してチャートに重ねる必要はありません。すべてが1つの強力なインジケーターに統合されています。28通貨ペアの強度、それらを導く市場のモメンタム、そして両方のアラートを、1つのウィンドウ、1つのチャートで。 上記のプログラムは MQL5 Market で1,200件以上のレビューを獲得し、2016年から MT4 コミュニティで定番となっています。Dynamic Forex28 Navigator MT5 は、実証済
AriFocus - Non-Repainting Buy/Sell Signals AriFocus - one clear signal. AriFocus marks buy and sell signals directly on the chart and suggests a stop-loss level for each one. Every signal is confirmed on bar close and never repaints. - Buy/sell arrows, confirmed on bar close - Suggested stop-loss level for every signal - Trend band and candle coloring to show direction at a glance - 10 ready-made presets, or your own settings (14 calculation methods) - Pop-up, push and email alerts with entr
Neuro Poseidon is a new indicator by Daria Rezueva. It combines precise trading signals with adaptive TP/SL levels - creating best possible trades as a result! Message me and get  Neuro Poseidon Assistant  as a gift to automize your trading process! What makes it stand out? 1. Proven profitability on all assets and timeframes 2. Only confirmed BUY and SELL signals present on the chart 3. Adaptive TP & SL levels generated by the software for each trade 4. Easy to understand - suitable for al
スイングトレーディング は、トレンドの方向のスイングと可能な反転スイングを検出するように設計された最初のインジケーターです。トレーディングの文献で広く説明されているベースラインスイングトレーディングアプローチを使用します。インディケータは、いくつかの価格と時間のベクトルを調査して、全体的なトレンドの方向を追跡し、市場が売られ過ぎまたは買われ過ぎて修正の準備ができている状況を検出します。 [ インストールガイド | 更新ガイド | トラブルシューティング | よくある質問 | すべての製品 ] むち打ちを起こさずに市場スイングの利益 インジケーターは常にトレンドの方向を表示します 色付きの価格帯は機会のベースラインを表します 色付きのダッシュは、可能な反転スイングを表します この指標は、独自の品質とパフォーマンスを分析します 複数時間枠のダッシュボードを実装します カスタマイズ可能なトレンドおよびスイング期間 電子メール/サウンド/プッシュアラートを実装します インジケータは再描画またはバックペインティングではありません Swing Tradingとは Swing Tradingは
Azimuth Pro
Ottaviano De Cicco
5 (7)
Azimuth Pro V2:MT5向けシンセティック・フラクタル構造分析と確認済みエントリー 概要 Azimuth Pro は Merkava Labs によるマルチレベルスイング構造インジケーターです。4つのネストされたスイングレイヤー、スイングアンカーVWAP、ABCパターン検出、3タイムフレーム構造フィルタリング、そして確定バーでの確認済みエントリー — 1つのチャートで、ミクロスイングからマクロサイクルまでを網羅するワークフロー。 これはブラインドシグナル製品ではありません。ロケーション、コンテキスト、タイミングを重視するトレーダーのための構造ファーストワークフローです。 ハロウィンプロモーション — 35%オフ 相場が不気味に揺れても、あなたの優位性は鋭いまま。このオファーが霧の中に消える前に、35%オフで手に入れよう。 Azimuth Proが現在259 USD(通常399 USD)。 1. V2での変更点 シンセティック・マルチタイムフレームエンジン 上位タイムフレーム分析をMeridian Proと同じ独自のシンセティックアーキテクチャで一から再構築。より
SkyHammer Signal Pro Entry、SL、TP レベルを固定表示する、プロ仕様のノーリペイント・トレンドシグナルインジケーター SkyHammer Signal Pro は、明確で固定され、検証可能なシグナルを求めるトレーダー向けに設計された、構造的なトレンド・モメンタム系シグナルインジケーターです。 特に M1 と M5 などの短期時間足で最も効果を発揮します。 このインジケーターは、天井や底を予測するためのものではありません。シグナルを出す前に、確認された市場構造、トレンド方向、モメンタムの強さ、健全なボラティリティ、そしてターゲットまでの十分な値幅を確認します。 主な機能 固定シグナルメカニズム シグナルが確認されると、矢印、Entry、Stop Loss、TP1、TP2 の各レベルはチャート上に永久的に固定されます。 その後のローソク足の動きによって、シグナルが消えたり、移動したり、変更されたりすることはありません。 これにより、トレーダーは各シグナルを明確に確認でき、リアルタイム相場中にシグナルが消えるという一般的な問題を避けることができます。 完全な過去シ
作者のその他のプロダクト
Chart Pattern Navigator MT5 Overview Chart Pattern Navigator MT5 is a technical analysis indicator designed to automatically detect, classify and visualize classic chart patterns directly on your MetaTrader 5 charts. It helps traders identify potential market structures, monitor pattern development and evaluate possible trading scenarios without having to draw every formation manually. The indicator combines pattern recognition, configurable breakout and retest logic, projected entry levels, st
フィルタ:
レビューなし
レビューに返信