MTF Pivot Projection

MTF Pivot Projection

Multi-Timeframe Market Structure and Forward Pivot Analysis

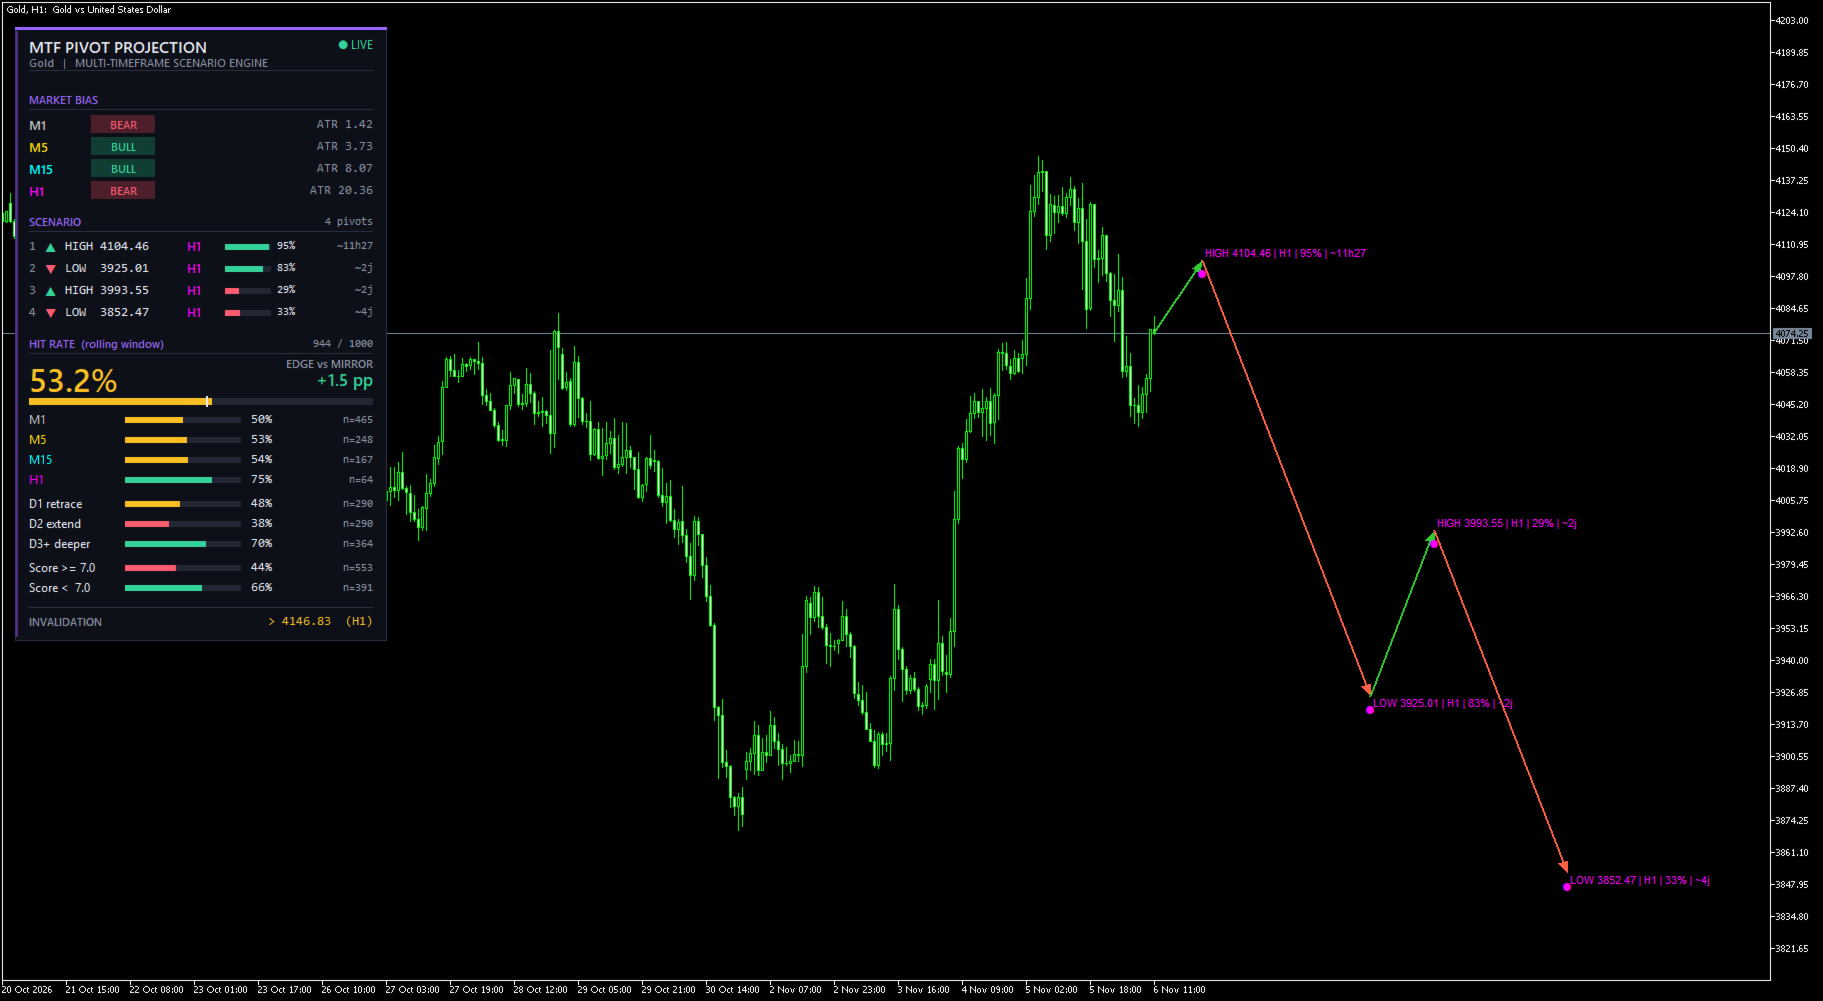
MTF Pivot Projection is a technical analysis indicator designed to combine multi-timeframe market structure, Fibonacci levels, Order Blocks and Fair Value Gaps into a single projected price path.

Instead of displaying independent pivot levels from multiple timeframes, the indicator builds one continuous sequence of potential future swing highs and lows, from the nearest projected retracement to subsequent extension targets.

The indicator also includes a performance tracking system that evaluates whether previously projected target zones were reached and compares the results with a mirrored reference target.

Main Features

1. Multi-Timeframe Pivot Analysis

Analyze four independently configurable timeframes simultaneously. The default configuration uses M1, M5, M15 and H1.

Each timeframe contributes its own market structure and projection candidates.

2. Unified Projected ZigZag

The indicator combines the projections from all selected timeframes into a single chronological path.

The projected path alternates between potential swing highs and swing lows, providing a visual representation of possible future price movements.

3. Fibonacci Retracements and Extensions

Retracement levels are used to calculate potential pullback targets.

Extension levels are used to estimate possible continuation targets.

The Fibonacci levels can be customized through the indicator settings.

4. Order Blocks and Fair Value Gaps

The indicator identifies unmitigated bullish and bearish Order Blocks and Fair Value Gaps.

These zones contribute to the confluence score and can be displayed directly on the chart.

5. Confluence Scoring

Each projected pivot receives a score based on several factors:

  • Fibonacci level weighting.

  • Order Block confluence.

  • Fair Value Gap confluence.

  • Market bias on the originating timeframe.

  • Higher-timeframe directional bias.

  • Distance from the current market price.

The displayed percentage is a normalized visual score. It is not a statistical probability of success.

6. Historical Performance Tracking

The indicator records the outcome of projected pivots over a rolling observation window.

A target is considered reached when price enters its configured tolerance zone before the projection expires or its invalidation condition occurs.

A mirrored reference target is also tracked to provide a comparison baseline.

The dashboard displays overall performance and additional statistics by timeframe, projection depth and score category.

7. Historical Backfill and Persistent Statistics

The indicator can reconstruct historical projection outcomes when first initialized.

Statistical records are saved locally and reused when the indicator is loaded again.

8. Integrated Dark Dashboard

A modern dashboard provides a compact overview of projected pivots and historical statistics without requiring separate windows.

Recommended Usage

MTF Pivot Projection is intended as an analytical tool for traders who use market structure, Fibonacci analysis and Smart Money Concepts.

It can be used on different chart timeframes. The analysis timeframes are configured independently from the chart timeframe.

The default M1, M5, M15 and H1 configuration is suitable as a starting point for intraday analysis.

Important Information

This indicator does not execute trades or provide guaranteed trading signals.

Projected pivots are analytical estimates based on the latest available market structure and selected confluences. They may change when new market data becomes available.

The displayed historical hit rate describes the indicator's own target-touch evaluation methodology. It does not represent a trading win rate or guarantee future performance.

Always use independent risk management and evaluate the indicator on your preferred instrument and trading conditions.


MTF Pivot Projection – User Guide

1. Installation

  1. Download and install the indicator through the MetaTrader 5 Market.

  2. Open MetaTrader 5.

  3. Open the Navigator window.

  4. Locate MTF Pivot Projection under Indicators.

  5. Drag the indicator onto the desired chart.

  6. Allow the indicator to load the required historical data.

The indicator can be attached to different chart timeframes. Its analysis timeframes are configured independently.

2. Understanding the Chart

Projected ZigZag

The projected path starts from the current market price and connects the estimated future pivot points.

  • Green segments represent upward projected movements.

  • Red segments represent downward projected movements.

  • Each projected pivot is marked with its estimated price.

  • Labels display the pivot type, source timeframe, score and estimated time.

The projections are estimates and may change as market conditions evolve.

Timeframe Colors

Each timeframe has its own marker and label color.

Default configuration:

  • M1: Silver

  • M5: Gold

  • M15: Aqua

  • H1: Magenta

Order Blocks

Order Blocks are displayed as colored chart zones.

  • Bullish Order Blocks represent potential demand areas.

  • Bearish Order Blocks represent potential supply areas.

Fair Value Gaps

Fair Value Gaps are displayed as separate colored zones.

  • Bullish FVG: blue.

  • Bearish FVG: purple.

Only zones meeting the indicator's detection and mitigation conditions are displayed.

3. Dashboard

The dashboard provides a summary of the current projected scenario and its historical evaluation.

The main statistics include:

Hit Rate

Percentage of resolved projected targets that reached their target zone before expiration or invalidation.

Baseline

A mirrored reference target is evaluated using the same tracking methodology. It provides a comparison against the original projected target.

Timeframe Statistics

Shows the historical results associated with each analysis timeframe.

Projection Depth

Separates statistics according to the position of the projected pivot in the scenario.

Score Categories

Compares projections with higher and lower confluence scores.

Important: the displayed score percentage is a normalized confluence score, not a probability of success.

4. Input Parameters

Analysis Timeframes

  • InpTF0: Lowest analysis timeframe. Default: M1.

  • InpTF1: Second analysis timeframe. Default: M5.

  • InpTF2: Third analysis timeframe. Default: M15.

  • InpTF3: Highest analysis timeframe. Default: H1.

  • InpBars: Number of historical candles analyzed per timeframe. Default: 800.

The selected timeframes should preferably be ordered from lowest to highest.

Market Structure

  • InpPivotStrength: Number of candles used on each side to confirm a pivot. Default: 5.

Higher values generally produce fewer, more selective pivots.

ATR

  • InpATRPeriod: ATR calculation period. Default: 14.

  • InpMaxDistATR: Maximum distance of the first projected pivot, expressed in ATR multiples. Default: 6.0.

Fair Value Gaps

  • InpFVGMinATR: Minimum FVG size relative to ATR. Default: 0.15.

  • InpMaxZones: Maximum number of detected zones per type and timeframe. Default: 5.

Order Blocks

  • InpOBDispATR: Minimum displacement candle body relative to ATR. Default: 1.2.

  • InpOBLookback: Number of candles searched for the opposing candle. Default: 5.

  • InpOBBodyOnly: Use only the candle body for the Order Block boundaries. Default: false.

Fibonacci

  • InpRetrLevels: Custom Fibonacci retracement levels. Default: 0.382;0.5;0.618;0.786.

  • InpExtLevels: Custom Fibonacci extension levels. Default: 1.0;1.272;1.618.

Separate multiple levels using semicolons.

Projected ZigZag

  • InpChainCycles: Number of projection cycles per timeframe. Default: 2.

  • InpMinScore: Minimum confluence score required for a projected pivot. Default: 4.0.

  • InpMaxNodes: Maximum number of projected pivots. Default: 14.

  • InpPathWidth: Projected path line width. Default: 2.

  • InpShowLabels: Show or hide projected pivot labels. Default: true.

Hit Rate Tracking

  • InpWindow: Rolling number of resolved projected pivots. Default: 1000.

  • InpHitTolATR: Target-zone tolerance relative to ATR. Default: 0.25.

  • InpTimeoutMult: Maximum tracking duration multiplier based on estimated time. Default: 3.0.

  • InpTimeoutMinBars: Minimum tracking duration in timeframe candles. Default: 5.

  • InpHiScore: Threshold separating higher-score and lower-score statistics. Default: 7.0.

  • InpMaxOpen: Maximum number of simultaneously tracked projections. Default: 600.

Historical Backfill

  • InpBackfill: Reconstruct historical statistics at initialization. Default: true.

  • InpForceBackfill: Force a complete reconstruction instead of loading saved history. Default: false.

  • InpBackfillBars: Number of lowest-timeframe candles used for reconstruction. Default: 5000.

  • InpBackfillStep: Number of candles between replay steps. Default: 10.

  • InpBackfillPerTick: Number of replay steps processed per timer cycle. Default: 3.

If the terminal becomes slow during reconstruction, reduce InpBackfillPerTick or increase InpBackfillStep.

Order Block and FVG Display

  • InpShowOB: Show or hide Order Blocks. Default: true.

  • InpShowFVG: Show or hide Fair Value Gaps. Default: true.

  • InpZoneDistATR: Maximum distance for displaying zones. Default: 4.0.

  • InpZoneExtend: Zone extension in chart candles. Default: 15.

  • InpHideLowerTF: Hide zones and structures from timeframes lower than the current chart timeframe. Default: true.

Dashboard

  • InpShowDashboard: Enable or disable the dashboard. Default: true.

  • InpDashX: Horizontal dashboard position. Default: 12.

  • InpDashY: Vertical dashboard position. Default: 24.

  • InpDashNodes: Number of projected pivots displayed in the dashboard. Default: 6.

  • InpDashDetails: Display detailed historical statistics. Default: true.

Additional Display Settings

  • InpShowStructure: Display the latest market structure leg for each timeframe. Default: false.

  • InpAutoShift: Automatically enable chart shift to provide space for projected movements. Default: true.

Timeframe and zone colors can also be customized.

5. Historical Statistics

When the indicator starts, it attempts to load previously saved statistical records.

If there is insufficient saved history and historical backfill is enabled, the indicator reconstructs historical projections using available market data.

The backfill process is an approximation based on closed higher-timeframe candles. Its results may differ from the live tracking process.

Statistics are maintained separately for the projected targets and mirrored reference targets.

6. Recommended Configuration

The default configuration is a suitable starting point for intraday analysis:

  • M1

  • M5

  • M15

  • H1

Allow the indicator to load sufficient historical data before interpreting its statistics.

For slower analysis, consider using higher timeframes and adjusting the number of historical candles accordingly.

7. Important Risk Notice

MTF Pivot Projection is a technical analysis indicator. It does not open, modify or close trading positions.

Projected prices, confluence scores and historical hit rates are analytical information only. They do not guarantee that future market movements will reach projected targets.

Market conditions can change rapidly. Always apply your own trading rules and risk management.

The indicator should be evaluated on the instrument, broker feed and timeframes on which it will be used.
Produtos recomendados
SMC Workflow Auto EA
Choawana Malaikitsanachalee
English – Product Description (V1.42) SMC Workflow Auto EA — SR / OB / FVG with BOS–CHOCH Confirmation Smart-Money-Concepts Expert Advisor that trades only when a clean SMC setup appears: Order-Block retest after Break of Structure (BOS / CHOCH) confirmation, with optional SR and Fair Value Gap (FVG) confluence. The EA uses pending limit orders, fixed SL/TP or RR-based exits, step-lock trailing and strict risk-controls designed to pass broker validation. What it does Detects swing structure usi
FREE
Auto Fractal Support And Resistance is a powerful multi-timeframe indicator designed for traders who want to trade lower timeframes with higher timeframe accuracy. When your mouse cursor is on a line you can easily see fractal describtion and index of fractal candle  and timeframe of that fractal candle.  This indicator automatically detects H1 and D1 fractal levels and draws clean horizontal support and resistance lines on any lower timeframe chart (M1, M5, M15, M30). Now you can see where the
LT Support Resistance - Identifique Suportes e Resistências de Forma 100% Automática Você cansa de perder tempo traçando linhas de suporte e resistência manualmente? Ou se frustra porque sempre deixa passar aquele nível importante? O LT Support Resistance foi desenvolvido para eliminar esse trabalho, identificando e marcando automaticamente as zonas mais relevantes do seu ativo em múltiplos timeframes simultâneos. == A AUTOMAÇÃO INTELIGENTE DE NÍVEIS CRÍTICOS == Em vez de desenhar linhas manual
Supply and Demand with Fibonacci and Classic Pivot What it does This indicator draws supply and demand zones on your chart from pivot points. Ordinary pivot indicators draw thin lines. This one draws zones (price areas), because price usually reacts to an area and rarely to one exact price. You can show up to 10 different periods at once (for example H1, H4, Daily and Weekly), and the indicator highlights the places where zones from different periods overlap. Main features Fibonacci pivots, Clas
Elliott Wave Pro X
Murtadha Majid Jeyad Al-Khuzaie
Elliott Wave Pro X Professional Automatic Elliott Wave Analysis for MetaTrader 5 Elliott Wave Pro X is an advanced automatic Elliott Wave indicator designed for traders who want to identify high-probability market structures with precision and confidence. The indicator continuously analyzes price action and applies Elliott Wave rules and guidelines to detect impulse waves, corrective patterns, diagonals, triangles, and complex market corrections. The indicator helps traders understand the cur
Forex Uncovered PRO v4.60 Professional Support & Resistance Breakout Indicator for MetaTrader 5 Overview Forex Uncovered PRO v4.60 is a professional Support & Resistance Breakout indicator built for MetaTrader 5. Unlike traditional trend indicators, Forex Uncovered focuses on Price Action by automatically identifying significant swing highs and swing lows, building dynamic support and resistance zones, and detecting confirmed breakout opportunities. To reduce false signals, the indicator combine
Histograma de Rendimento L&S Caicai Aviso Importante: Este indicador é uma ferramenta integrante do robô automatizado EA Caicai Long and Short Pair Trading . Este indicador exibe visualmente o desvio percentual (Yield %) do spread atual de um par em relação à sua própria média histórica. É excelente para visualizar rapidamente o potencial financeiro bruto de uma distorção. Principais Funcionalidades: Visualização em Percentual: Entenda facilmente o tamanho da distorção em termos percentuais. Múl
这是一个基于前一个交易日的最高价、最低价和收盘价来计算的枢轴点指标,具体公式如下: 计算前一日的 Pivot Point (枢轴点): Pivot = (High + Low + Close) / 3 计算 Resistance 1 (R1) 、 Support 1 (S1) ​ 等: R1 = (2 * Pivot) - Low S1 = (2 * Pivot) - High R2 = Pivot + (High - Low) S2 = Pivot - (High - Low) 与市面上其他的枢轴点指标相比,该指标主要有以下4个特点: 1、可以修改交易日的开始时间; 2、可以设定支撑压力线的颜色; 3、可以设定是否显示各个支撑压力线对应的价格; 4、可以设定天数用以显示枢轴点的历史记录; 开发这个指标的最初目的是为了解决设定交易日开始时间的问题,接下来会进一步说明。基于计算公式,我们需要获得上一个交易日的最高价、最低价和收盘价,在夏令时,北京时间6点是开市时间,大多数交易平台服务器的0点对应的是北京时间的6点,但是香港的服务器6点才是对应的是北京时间的6点。如果你有多个平台,且存在
Unmask Institutional Market Shifts with Precision Institutional Divergence Reversal Pro Most divergence indicators fail because they are "noisy"—they find every tiny curve in the market, leading to false signals. Institutional Divergence Reversal Pro is engineered to filter out retail noise and identify high-probability reversal zones where "Smart Money" is active. By combining multi-timeframe monitoring with a proprietary Quality Scoring System , this tool ensures you only focus on the setups t
O indicador exibe setas no gráfico indentificando compras e vendas em confluência com os setups criados por Larry Williams, são setups simples de REVERSÃO e também de facil compreenção e execução,  tornandos os assim mundialmente conhecidos entre traders de análise técnica. No indicador é possivel configurar além das opções de setup também a configuração da média movel base que é usada para geral o sinal.
"Quero verificar a direção da tendência em prazos maiores, mas ficar mudando o timeframe do gráfico é muito chato..." Este produto existe justamente para você! Trend Map Visão Geral do Produto Esta ferramenta registra a direção da tendência em cada timeframe (ou em cada estrutura fractal) e exibe sempre no gráfico. Mesmo que você mude o timeframe, o painel permanece visível, sendo ideal para quem analisa o gráfico alternando frequentemente os períodos. Permite identificar rapidamente a direção d
N/B: All our product purchase comes with our free ‘’DAILY   SCALPER EA’’ -   bit.ly/4qlFLNh Whatsapp Developer for yours after successful purchase The Holy Grail MotherBar Indicator: Your Ultimate Path to Consistent Trading Profits   The Problem With Every Other Indicator You've Tried Let me guess - you've spent countless hours and hundreds (maybe thousands) of dollars on indicators that promise the world but deliver mediocre results. You've tried: · Lagging indicators that tell you what
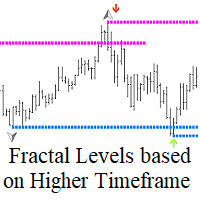
O Fractal Levels based on Higher Timeframe é uma ferramenta poderosa projetada para criar níveis precisos de suporte e resistência com base em fractais do timeframe superior, fornecendo sinais de compra e venda com alertas convenientes. Como funciona: O indicador analisa os níveis de fractais no período de tempo superior e os exibe no gráfico atual. Você pode ajustar facilmente o período de tempo superior nas propriedades do indicador para obter o máximo de precisão e relevância para suas estr
ZigZag Market Structure Breakout Pro ZigZag Extras Display BreakOut points is a MetaTrader 5 indicator for traders who use ZigZag, breakout points, market structure, BOS, CHoCH, swing high, swing low, support and resistance, and higher timeframe bias in their trading analysis. Main Benefits Displays confirmed ZigZag swing highs and swing lows Marks BOS Up, BOS Down, CHoCH Up and CHoCH Down Shows Depth Highest High and Depth Lowest Low lines Adds HH, HL, LH and LL structure labels Includes HTF bi
Delivery State Change Map
Martin Alberto Nunez Da Silveira Van Caester
CISD Delivery Map mostra níveis de Change in State of Delivery em duas temporalidades configuráveis e resume se o contexto ativo está alinhado ou misto. Principais funções - Duas temporalidades configuráveis; M15 e H1 por padrão. - Detecção de CISD de alta e de baixa. - Filtro de deslocamento por ATR. - Busca configurável da origem da entrega. - Gestão de níveis ativos e rompidos. - Projeção dos níveis confirmados. - Painel de alinhamento multi-timeframe. - Alertas pop-up, push e sonoros opcio
HTF Open Markers + ICT Silver Bullet Zones — Usage & Strategy Guide What it draws Session 1 / Session 2 lines : vertical lines at the open of every bar on two independently configurable higher timeframes (defaults: H4 and D1), including a projected line for the rest of today's not-yet-opened bars on sub-daily timeframes, so you can see where the next candle will open before it happens. ICT Silver Bullet zones : shaded rectangles over the three classic ICT kill-zone windows, converted from New Yo
FREE
Future Predictor MT5
Shukurjon Beknazarov
PREVISOR FUTURO - INDICADOR DE PREVISÃO ANALÓGICA HISTÓRICA VISÃO GERAL O Future Predictor compara o padrão de preço mais recente com padrões semelhantes do passado e resume o que aconteceu depois. Ele mostra as probabilidades de Compra, Venda e Neutro, uma trajetória de preço projetada com bandas empíricas e a lista de correspondências históricas que fundamentam a estimativa. Todos os resultados são estimativas estatísticas baseadas em dados históricos. Eles não garantem resultados futuros.
Atbot
Zaha Feiz
4.69 (55)
AtBot: Como funciona e como usá-lo ### Como funciona O indicador "AtBot" para a plataforma MT5 gera sinais de compra e venda usando uma combinação de ferramentas de análise técnica. Ele integra a Média Móvel Simples (SMA), a Média Móvel Exponencial (EMA) e o índice de Faixa Verdadeira Média (ATR) para identificar oportunidades de negociação. Além disso, pode utilizar velas Heikin Ashi para melhorar a precisão dos sinais. Deixe uma avaliação após a compra e receba um presente especial. ### Princ
Eazy RSI Divergence
Gawain Athur Stephan Cloete
Eazy Divergence is a non-repainting MT5 indicator designed to automatically detect and plot Regular and Hidden divergence signals in real time Key Features Dual-Window Plotting: Displays divergence trendlines and text badges directly on both the main price chart and the RSI subwindow. 100% Non-Repainting: Uses left/right pivot strength confirmation so signals stay fixed once drawn. Full Multi-Timeframe Support: Adapts instantly to whatever chart timeframe you are viewing. Fully Customizable: Eas
Até 7 níveis de pivô Fibonacci por lado. Para zonas de oferta e demanda classificadas com contagem de retestes: Supply Demand RSJ PRO Pivot Point Fibo RSJ desenha o ponto de pivô diário e seus níveis de suporte e resistência calculados com proporções de Fibonacci. Ele plota até 7 níveis de suporte e 7 níveis de resistência a partir da máxima, da mínima e do fechamento do dia anterior. Os traders usam esses níveis como áreas de referência para planejar entradas, saídas e o posicionamento do stop
FREE
ICT Institutional Zones Pro
Celestine Anyango Wabomba
ICT Institutional Zones Pro — Trade with Institutional Precision Stop wasting time manually drawing key ICT levels every day. ICT Institutional Zones Pro is a professional-grade MT5 indicator built for traders who use ICT (Inner Circle Trader) and Smart Money Concepts (SMC) to read market structure with precision. This indicator automatically maps the most important institutional levels directly on your chart, helping you instantly identify where smart money is likely accumulating, distributing
SPECIAL LAUNCH OFFER: $30 (1-Month Rent) Limited time offer to build our community and gather feedback! AmbM GOLD Institutional Scalper A high-precision M5 algorithm for XAUUSD (Gold) , engineered to trade exclusively at Institutional Liquidity Levels ($5/$10 psychological marks). PERFORMANCE DATA (BUY ONLY) • Win Rate: 87.09%. • Safe Growth: +$4,113 profit on $10k (13.75% Max Drawdown). • Extreme Stress Test: Successfully generated +$22,997 in a 5-year stress test (2020-2026), proving
CleanSMC Lite CleanSMC Lite is a MetaTrader 5 custom indicator designed to help traders analyze market structure using a clean Smart Money Concepts style workflow. The indicator focuses on visual structure mapping, demand and supply zones, fair value gap detection, equal highs and equal lows, and optional BUY/SELL signal arrows. The tool is built for discretionary technical analysis and is intended to support chart reading, not to replace a complete trading plan. It does not execute trades, open
Pivot Points MT5 is a universal color multicurrency/multisymbol indicator of the Pivot Points levels systems. You can select one of its three versions: Standard Old, Standard New and Fibo . It plots pivot levels for financial instruments in a separate window . The system will automatically calculate the Pivot Point on the basis of market data for the previous day ( PERIOD_D1 ) and the system of support and resistance levels, three in each. A user can choose colors for the indicator lines. The on
KT Horizontal Lines MT5
KEENBASE SOFTWARE SOLUTIONS
No MetaTrader, traçar várias   linhas horizontais   e acompanhar seus respectivos níveis de preço pode ser uma tarefa trabalhosa. Este indicador desenha automaticamente várias linhas horizontais em intervalos iguais para configurar alertas de preço, marcar níveis de suporte e resistência e outros usos manuais. Este indicador é ideal para traders iniciantes no Forex que estão em busca de oportunidades para obter lucros rápidos comprando e vendendo. As linhas horizontais ajudam a identificar possí
Trading Discipline Trend Dashboard lê apenas o histórico de operações já fechadas da sua própria conta e transforma quatro padrões específicos numa tendência de 7 dias, para que você veja se algo acontece uma única vez ou se repete toda semana. Não prevê nem aconselha. Cada número no painel é algo que já aconteceu nesta conta. Como os números são construídos: ele lê até 37 dias de negócios fechados em todos os símbolos e todos os magic numbers - é uma visão da conta inteira, não apenas do símbo
SMC Session Scanner MT5 is a panel indicator for MetaTrader 5 that watches many symbols and timeframes for smart-money structure and session levels. For each symbol and timeframe it shows one of these: a fresh break of structure (BOS), a change of character (CHoCH), or a fresh liquidity sweep. It also shows price inside a live order block or fair value gap. Otherwise it shows the latest break and how long ago it was. A Session column shows the session now. It also shows today's first close beyon
Adaptive Trend Lines
Henri Salvatore Bigatti
4.76 (25)
O indicador foi desenvolvido para mostrar as linhas de tendência de preços, e a linha do canal de alta e o de baixa. Com essas linhas é possível identificar a tendência dos preços mais facilmente.  Ele utiliza as diferentes trendlines e pontos de resistência e suporte para gerar automaticamente as melhores linhas de tendência TLH e TLL, e mostra os ângulos em pips ( percentage in points ) de cada linha. Além disso mostra os pontos identificados como suportes e resistências através do algoritmo
FREE
Apex Break PRO é um indicador de rompimento de linhas de tendência por pivôs sem repintura para MetaTrader 5. Ele detecta máximas de pivô e mínimas de pivô, desenha linhas de tendência dinâmicas inclinadas entre pivôs consecutivos e gera sinais de compra e venda quando o preço rompe essas linhas de tendência no fechamento confirmado de um candle. Cada sinal é filtrado por até quatro camadas de confluência independentes — tendência EMA, limites RSI, detecção de pico de volume e força de tendência
Supreme Power House reads market structure, grades every signal against seven filters and draws a complete trade plan for each one. It prints a BUY or a SELL when a candle closes beyond the latest swing: a change of character (CHoCH) when the break turns the structure, a break of structure (BOS) when it continues it. Each signal comes with an entry, a stop, up to three targets and a grade from A to C, surrounded by an adaptive trend ribbon, ICT zones and a dashboard of six timeframes. Everythin
Os compradores deste produto também adquirem
Trend Sniper X
Sarvarbek Abduvoxobov
4.86 (44)
Trend Sniper X é um indicador de acompanhamento de tendência para múltiplos tempos gráficos no MetaTrader 5 que ajuda os traders a identificar a direção da tendência e potenciais pontos de reversão com clareza e precisão. para MT4: https://www.mql5.com/en/market/product/193245 Informações sobre o preço: O preço atual é promocional e está sujeito a alterações à medida que novas atualizações e funcionalidades forem lançadas. Oferta Bônus: Para obter o Auto-Trade Assistant EA GRATUITO para este in
Um novo Rei chegou à cidade - Indicador + Gestão de Ordens (TP1 + TP2 + TP3) + Enviador opcional de sinais para Telegram INCLUÍDO (GRÁTIS) (SISTEMA COMPLETO DE TRADING e SINAIS) Nosso melhor EA para Ouro: Gold Slayer Este indicador inclui uma estratégia avançada, um sistema de trading com gestão de ordens personalizável e um sistema de reversão à média que combina extensões de envelopes, apoiado por múltiplos filtros inteligentes de confirmação, como o RSI, para capturar entradas de reversão de
Smart Trend Trading System — MetaTrader 5 Após a compra, envie-me uma mensagem no MQL5 para receber Smart Universal Expert Advisor GRÁTIS, além do curso online, do manual em PDF e do acesso ao grupo privado. O STTS reúne a direção da tendência, sinais de entrada e saída, zonas de reversão e níveis de preço importantes diretamente no seu gráfico. Siga o sistema manualmente ou conecte um EA compatível separado para executar operações automaticamente com as configurações que você escolher. UM SISTE
O Entry Points Pro mostra onde entrar, onde colocar o stop e com qual lote operar — antes de você colocar a ordem. PREÇO Agora 149 USD, e esta é a última cópia por este preço. Depois o preço sobe para 199 USD, e o preço final é 349 USD. Eu ganho meu dinheiro operando nos mercados e mostro isso, por isso não preciso vender este indicador para todo mundo. É uma ferramenta para traders que pensam por conta própria, não um botão mágico. A seta aparece no fechamento da vela e não repinta. Duas confi
Tenha sua vantagem no trading à vista! M5 Sniper é um novo indicador da MeanFX. Ele combina sinais de trading precisos com níveis adaptativos de TP/SL — criando, como resultado, as melhores operações estatísticas possíveis! O preço aumenta a cada 5 compras, o próximo preço é de 69$ Envie-me uma mensagem após a compra para receber dicas/guia e um EA bônus O que o faz se destacar? Desempenho estatístico comprovado no Gold XAUUSD ( funciona em praticamente todos os ativos , com foco em dominar um ú
SuperScalp Pro
Van Minh Nguyen
4.54 (37)
SuperScalp Pro - Professional Multi-Layer Confluence Scalping System O SuperScalp Pro é um indicador avançado de scalping que aprimora o Supertrend clássico com vários filtros inteligentes de confirmação. Ele ajuda a identificar oportunidades de Buy/Sell com maior probabilidade de sucesso, reduzindo significativamente os sinais falsos. Setas claras de Buy e Sell aparecem diretamente no gráfico, juntamente com os níveis de Stop Loss e Take Profit baseados em ATR, calculados automaticamente em tem
Gold Trend Coach MT5
Cristhian Alexander Gaibor Cuasquer
4.2 (10)
Gold Trend Coach é um indicador de tendência para o ouro (XAUUSD) no MetaTrader 5 com sinais de compra e venda, stop loss e três take profit confirmados no fechamento da vela (não repinta), um coach que te guia da entrada até o TP3, um painel multi-timeframe e alertas no celular e no Telegram. Feito para scalping em M1 e M5 e intraday em M15 nas sessões de Londres e Nova York. BÔNUS: EA de auto-trading GRÁTIS para o Gold Trend Coach. Me envie uma mensagem depois da compra e eu envio o EA que ope
SMC Intraday Formula
VividMind Digital Solutions
5 (26)
Vamos ser honestos primeiro. Nenhum indicador sozinho vai te tornar lucrativo. Se alguém te disser o contrário, está te vendendo um sonho. Qualquer indicador que mostre setas perfeitas de compra/venda pode ser feito para parecer impecável — basta dar zoom na parte certa da história e tirar um print das operações vencedoras. Nós não fazemos isso.  SMC Intraday Formula é uma ferramenta. Ela lê a estrutura do mercado para você, identifica as zonas de maior probabilidade de preço e mostra exatament
Gann Made Easy   é um sistema de negociação Forex profissional e fácil de usar, baseado nos melhores princípios de negociação usando a teoria do sr. W. D. Gann. O indicador fornece sinais precisos de COMPRA e VENDA, incluindo níveis de Stop Loss e Take Profit. Você pode negociar mesmo em movimento usando notificações PUSH. Entre em contato comigo após a compra para receber instruções de negociação e ótimos indicadores extras gratuitamente! Provavelmente você já ouviu muitas vezes sobre os método
Ultra Indicator
Ihor Otkydach
5 (1)
O ULTRA é um indicador técnico que funciona numa base «tudo-em-um» — analisa o mercado de forma independente, gera sinais de negociação, apresenta níveis para definir ordens de stop-loss e sugere quando encerrar as negociações para garantir lucros ou minimizar perdas. Por outras palavras, não importa se não sabe analisar o mercado, determinar níveis — onde definir o seu stop-loss — ou se tem dificuldades com a gestão do capital. O ULTRA fará tudo isso por si! BÓNUS PARA O COMPRADOR: Após adquiri
Boba Analysis Suite
Trade Ready Solutions LLC
5 (2)
Boba Analysis Suite O Boba Analysis Suite é um indicador de análise para o MetaTrader 5. Reúne a estrutura do mercado, as zonas de preço relevantes e o contexto geral do mercado numa única visualização do gráfico. Desenvolvido a partir da experiência prática como trader e formador de traders, apoia um processo de análise estruturado: avaliar a direção do mercado, identificar níveis importantes e analisar vários períodos gráficos em conjunto. Análise em contexto O significado de cada sinal depend
Próxima Atualização — Versão 2.52 em Breve! [NOVO] Prepare-se para 4 Grandes Novos Recursos Projetados para Aprimorar sua Análise de Mercado e seu Fluxo de Trabalho de Trading Estamos levando a análise de mercado a um novo nível com 4 novos recursos desenvolvidos para atender às suas necessidades de trading. Apresentamos: 1. TRADE OVERVIEW DASHBOARD 2. CONFLUENCE AT ZONE 3. STRONG & WEAK HIGH/LOW 4. OTE 1. TRADE OVERVIEW DASHBOARD Um painel que ajuda você a compreender mais facilmente o panoram
M1 Sniper MT5
Oleg Rodin
5 (7)
O   M1 SNIPER   é um sistema indicador de negociação fácil de usar. É um indicador de seta projetado para o período M1. O indicador pode ser usado como um sistema independente para scalping no período M1 e pode ser usado como parte do seu sistema de negociação existente. Embora este sistema de negociação tenha sido projetado especificamente para negociação no M1, ele também pode ser usado em outros períodos. Originalmente, desenvolvi este método para negociar XAUUSD e BTCUSD. Mas considero-o úti
FiboSniper Pro
Van Minh Nguyen
5 (4)
FiboSniper Pro – Multi-Filter Fibonacci System with Auto SL/TP and Control Panel FiboSniper Pro é um indicador técnico que combina Fibonacci Envelopes dinâmicos com vários filtros de confirmação para gerar sinais seletivos de Buy e Sell. Os níveis de Fibonacci são calculados com base em Moving Average e ATR e, em seguida, filtrados por ADX, EMA, RSI, ATR, Volume, Time e estrutura das velas. O indicador exibe diretamente no gráfico os níveis automáticos de Stop Loss e Take Profit baseados em ATR,
Auto Optimized SpeedAngle é um sistema de vetorização de momentum de nível institucional que elimina o sobreajuste ( curve-fitting ) por meio da otimização contínua de avanço ( Walk-Forward Optimization , WFO). Em vez de depender de entradas estáticas que se degradam quando os regimes de mercado mudam, o indicador recalibra dinamicamente seus parâmetros utilizando validação fora de amostra ( Out-of-Sample , OOS), garantindo que os sinais exibidos representem vantagens estatísticas genuínas e não
Adaptive Price Action Engine Compre um indicador, ganhe o EA de graça Análise Auto-Otimizada de Tendências e Padrões de Candlestick em Múltiplos Timeframes Os mercados estão em constante mudança, e nem todos os padrões de Price Action têm o mesmo valor em todas as condições de mercado. O Adaptive Price Action Engine foi desenvolvido para se adaptar às mudanças nas condições do mercado, combinando estrutura de tendência, análise Multi-Timeframe, padrões de candlestick e otimização estatística em
Crystal Heikin Ashi Signals
Muhammad Jawad Shabir
5 (5)
Crystal Heikin Ashi Signals—Professional Trend & Signal Detection Indicator Advanced Heikin Ashi Visualization with Intelligent Signal System for Manual & Automated Trading Final Price: $149 ---------> Price goes up $10 after every 10 sales . Limited slots available — act fast . Overview User Guide PDF Crystal Heikin Ashi Signals is a professional-grade MetaTrader 5 indicator that combines pure Heikin Ashi candle visualization with an advanced momentum-shift detection system. Designed for both m
O Scalper Vault é um sistema de negociação poderoso e completo, projetado para traders que buscam consistência em operações intraday. Este indicador de alta precisão funciona como um sistema de negociação autônomo, oferecendo análises de nível institucional tanto para o mercado Forex quanto para Opções Binárias. ENTRE EM CONTATO COMIGO APÓS A COMPRA PARA RECEBER DICAS DE NEGOCIAÇÃO E UM BÔNUS EXCLUSIVO! Ao eliminar suposições e análises manuais complexas, o Scalper Vault permite que você foque
Trend Catcher ind mt5
Ramil Minniakhmetov
5 (18)
INDICADOR TREND CATCHER O Indicador Trend Catcher analisa os movimentos de preços do mercado, utilizando uma combinação de indicadores de análise de tendências adaptativos, proprietários e personalizados pelo autor. Identifica a verdadeira direção do mercado, filtrando o ruído de curto prazo e focando a força do momentum subjacente, a expansão da volatilidade e o comportamento da estrutura de preços. Utiliza também uma combinação de indicadores personalizados de suavização e filtragem de tendê
Atomic Analyst MT5
Issam Kassas
4.5 (64)
Atomic Analyst — MetaTrader 5 Após a compra, envie-me uma mensagem no MQL5 para receber Smart Universal Expert Advisor GRÁTIS, além do curso online, do manual em PDF e do acesso ao grupo privado. O Atomic Analyst reúne a ação do preço, a direção da tendência, sinais de entrada e saída, Stop Loss e vários níveis de Take Profit diretamente no seu gráfico. VEJA O SINAL. ENTENDA O CENÁRIO. O Atomic Analyst organiza sua análise em informações visuais claras: • Setas de compra e venda para identificar
Unix Scalper
Issam Kassas
4 (4)
Unix Scalper — MetaTrader 5 Após a compra, envie-me uma mensagem no MQL5 para receber Smart Universal Expert Advisor GRÁTIS, além do curso online, do manual em PDF e do acesso ao grupo privado. Identifique a oportunidade. Veja o plano. Escolha como operar. O UNIX Scalper reúne análise de mercado, decisões BUY/SELL/WAIT e níveis de Entry, Stop Loss, TP1 e TP2 em um painel organizado. VEJA O SINAL E O PLANO • Decisões claras: BUY, SELL ou WAIT. • Níveis definidos: Entry, Stop Loss, TP1 e TP2. •
SIO Oscillator: oscilador auto-otimizável de desequilíbrio de semivariância Compre o indicador e receba GRÁTIS o Expert Advisor (EA) baseado nele. A maioria dos osciladores trata todo movimento de preço da mesma forma. O SIO separa a pressão de alta da pressão de baixa e mede o desequilíbrio entre elas, mostrando qual lado realmente controla o mercado: compradores ou vendedores. Quando o desequilíbrio atinge um extremo, o SIO gera um sinal claro com níveis de entrada, Stop Loss e Take Profit. O
Volatility Master for MetaTrader is a real-time dashboard tool that scans up to  50 symbols  to identify high-volatility , trending markets instantly. With bullish/bearish signals, customizable alerts, and a user-friendly interface, it helps you avoid range-bound conditions and focus on high-probability trades. Clarity leads to confidence. Trade confidently and protect your capital effectively with this powerful dashboard. We don't offer free or bonus indicators in exchange of reviews from you.
Smc Pro ToolKit
Talal N Z Aljarusha
5 (14)
SMC PRO TOOLKIT — SMART MONEY ANALYSIS & STRUCTURED TRADE PLANNING SMC Pro ToolKit is a professional Smart Money Concepts analysis workspace for MetaTrader 5. It combines market structure, multi-timeframe analysis, institutional price zones, setup evaluation, confirmation tools, volume context, alerts, and risk planning inside one organized chart environment. One workspace. Multiple layers of confirmation. One structured trading plan. OPEN COMPLETE USER GUIDE MULTI-CONDITION SETUP ENGINE At
Indicador multi-moeda de força e momentum MT5 O Dynamic Forex28 Navigator é a evolução dos nossos indicadores populares de longa data, reunindo o poder de cinco em um: Advanced Currency Strength28 Indicator (700 avaliações) Advanced Currency IMPULSE with ALERT (530 avaliações) Currency Strength EXOTICS GOLD Impulse with Alert CS28 Combo Signals (bônus atual) Não é necessário comprar quatro indicadores e empilhá-los nos seus gráficos. Tudo está reunido em um único indicador poderoso: a força dos
AriFocus
Temirlan Kdyrkhan
AriFocus - Non-Repainting Buy/Sell Signals AriFocus - one clear signal. AriFocus marks buy and sell signals directly on the chart and suggests a stop-loss level for each one. Every signal is confirmed on bar close and never repaints. - Buy/sell arrows, confirmed on bar close - Suggested stop-loss level for every signal - Trend band and candle coloring to show direction at a glance - 10 ready-made presets, or your own settings (14 calculation methods) - Pop-up, push and email alerts with entr
Neuro Poseidon MT5
Daria Rezueva
4.68 (53)
Neuro Poseidon is a new indicator by Daria Rezueva. It combines precise trading signals with adaptive TP/SL levels - creating best possible trades as a result! Message me and get  Neuro Poseidon Assistant  as a gift to automize your trading process! What makes it stand out? 1. Proven profitability on all assets and timeframes 2. Only confirmed BUY and SELL signals present on the chart 3. Adaptive TP & SL levels generated by the software for each trade 4. Easy to understand - suitable for al
PZ Swing Trading MT5
PZ TRADING SLU
5 (5)
Swing Trading é o primeiro indicador projetado para detectar oscilações na direção da tendência e possíveis oscilações de reversão. Ele usa a abordagem de negociação de linha de base, amplamente descrita na literatura de negociação. O indicador estuda vários vetores de preço e tempo para rastrear a direção da tendência agregada e detecta situações nas quais o mercado está sobrevendido ou sobrecomprado em excesso e pronto para corrigir. [ Guia de instalação | Guia de atualização | Solução de prob
Azimuth Pro
Ottaviano De Cicco
5 (7)
Azimuth Pro V2: Estrutura Fractal Sintética e Entradas Confirmadas para MT5 Visão geral Azimuth Pro é um indicador de estrutura swing multinível da Merkava Labs . Quatro camadas de swing aninhadas, VWAP ancorado em swings, detecção de padrões ABC, filtragem estrutural de três timeframes e entradas confirmadas em barra fechada — um gráfico, um fluxo de trabalho dos micro-swings aos macro-ciclos. Este não é um produto de sinais cegos. É um fluxo de trabalho baseado em estrutura para traders que v
SkyHammer Signal Pro Indicador profissional de sinais de tendência sem repaint, com níveis Entry, SL e TP bloqueados SkyHammer Signal Pro é um indicador estruturado de tendência e momentum, desenvolvido para traders que procuram sinais claros, fixos e verificáveis. Funciona melhor em timeframes baixos, como M1 e M5 . O indicador não tenta prever topos ou fundos do mercado. Em vez disso, ele aguarda estrutura de mercado confirmada, direção de tendência, força de momentum, volatilidade saudável e
Mais do autor
Chart Pattern Navigator MT5
Alexis Jean Francois Gemehl
Chart Pattern Navigator MT5 Overview Chart Pattern Navigator MT5 is a technical analysis indicator designed to automatically detect, classify and visualize classic chart patterns directly on your MetaTrader 5 charts. It helps traders identify potential market structures, monitor pattern development and evaluate possible trading scenarios without having to draw every formation manually. The indicator combines pattern recognition, configurable breakout and retest logic, projected entry levels, st
Filtro:
Sem comentários
Responder ao comentário