MTF Pivot Projection

MTF Pivot Projection

Multi-Timeframe Market Structure and Forward Pivot Analysis

MTF Pivot Projection is a technical analysis indicator designed to combine multi-timeframe market structure, Fibonacci levels, Order Blocks and Fair Value Gaps into a single projected price path.

Instead of displaying independent pivot levels from multiple timeframes, the indicator builds one continuous sequence of potential future swing highs and lows, from the nearest projected retracement to subsequent extension targets.

The indicator also includes a performance tracking system that evaluates whether previously projected target zones were reached and compares the results with a mirrored reference target.

Main Features

1. Multi-Timeframe Pivot Analysis

Analyze four independently configurable timeframes simultaneously. The default configuration uses M1, M5, M15 and H1.

Each timeframe contributes its own market structure and projection candidates.

2. Unified Projected ZigZag

The indicator combines the projections from all selected timeframes into a single chronological path.

The projected path alternates between potential swing highs and swing lows, providing a visual representation of possible future price movements.

3. Fibonacci Retracements and Extensions

Retracement levels are used to calculate potential pullback targets.

Extension levels are used to estimate possible continuation targets.

The Fibonacci levels can be customized through the indicator settings.

4. Order Blocks and Fair Value Gaps

The indicator identifies unmitigated bullish and bearish Order Blocks and Fair Value Gaps.

These zones contribute to the confluence score and can be displayed directly on the chart.

5. Confluence Scoring

Each projected pivot receives a score based on several factors:

  • Fibonacci level weighting.

  • Order Block confluence.

  • Fair Value Gap confluence.

  • Market bias on the originating timeframe.

  • Higher-timeframe directional bias.

  • Distance from the current market price.

The displayed percentage is a normalized visual score. It is not a statistical probability of success.

6. Historical Performance Tracking

The indicator records the outcome of projected pivots over a rolling observation window.

A target is considered reached when price enters its configured tolerance zone before the projection expires or its invalidation condition occurs.

A mirrored reference target is also tracked to provide a comparison baseline.

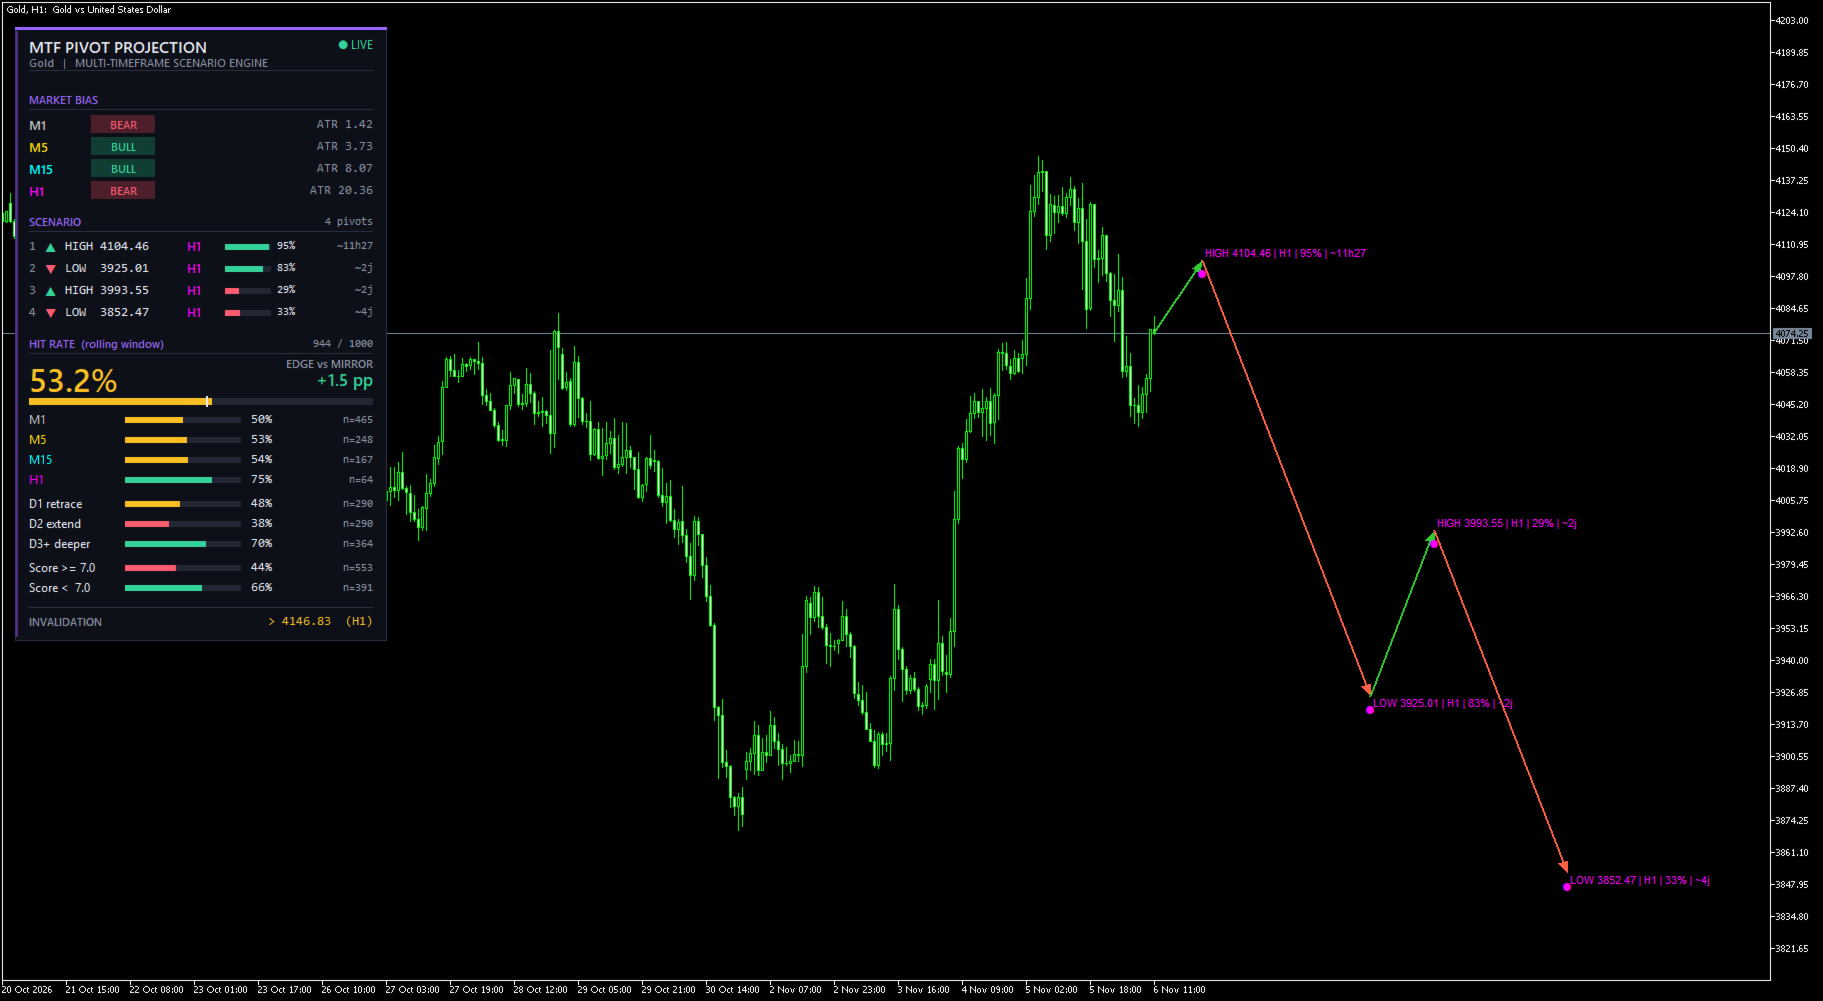
The dashboard displays overall performance and additional statistics by timeframe, projection depth and score category.

7. Historical Backfill and Persistent Statistics

The indicator can reconstruct historical projection outcomes when first initialized.

Statistical records are saved locally and reused when the indicator is loaded again.

8. Integrated Dark Dashboard

A modern dashboard provides a compact overview of projected pivots and historical statistics without requiring separate windows.

Recommended Usage

MTF Pivot Projection is intended as an analytical tool for traders who use market structure, Fibonacci analysis and Smart Money Concepts.

It can be used on different chart timeframes. The analysis timeframes are configured independently from the chart timeframe.

The default M1, M5, M15 and H1 configuration is suitable as a starting point for intraday analysis.

Important Information

This indicator does not execute trades or provide guaranteed trading signals.

Projected pivots are analytical estimates based on the latest available market structure and selected confluences. They may change when new market data becomes available.

The displayed historical hit rate describes the indicator's own target-touch evaluation methodology. It does not represent a trading win rate or guarantee future performance.

Always use independent risk management and evaluate the indicator on your preferred instrument and trading conditions.


MTF Pivot Projection – User Guide

1. Installation

  1. Download and install the indicator through the MetaTrader 5 Market.

  2. Open MetaTrader 5.

  3. Open the Navigator window.

  4. Locate MTF Pivot Projection under Indicators.

  5. Drag the indicator onto the desired chart.

  6. Allow the indicator to load the required historical data.

The indicator can be attached to different chart timeframes. Its analysis timeframes are configured independently.

2. Understanding the Chart

Projected ZigZag

The projected path starts from the current market price and connects the estimated future pivot points.

  • Green segments represent upward projected movements.

  • Red segments represent downward projected movements.

  • Each projected pivot is marked with its estimated price.

  • Labels display the pivot type, source timeframe, score and estimated time.

The projections are estimates and may change as market conditions evolve.

Timeframe Colors

Each timeframe has its own marker and label color.

Default configuration:

  • M1: Silver

  • M5: Gold

  • M15: Aqua

  • H1: Magenta

Order Blocks

Order Blocks are displayed as colored chart zones.

  • Bullish Order Blocks represent potential demand areas.

  • Bearish Order Blocks represent potential supply areas.

Fair Value Gaps

Fair Value Gaps are displayed as separate colored zones.

  • Bullish FVG: blue.

  • Bearish FVG: purple.

Only zones meeting the indicator's detection and mitigation conditions are displayed.

3. Dashboard

The dashboard provides a summary of the current projected scenario and its historical evaluation.

The main statistics include:

Hit Rate

Percentage of resolved projected targets that reached their target zone before expiration or invalidation.

Baseline

A mirrored reference target is evaluated using the same tracking methodology. It provides a comparison against the original projected target.

Timeframe Statistics

Shows the historical results associated with each analysis timeframe.

Projection Depth

Separates statistics according to the position of the projected pivot in the scenario.

Score Categories

Compares projections with higher and lower confluence scores.

Important: the displayed score percentage is a normalized confluence score, not a probability of success.

4. Input Parameters

Analysis Timeframes

  • InpTF0: Lowest analysis timeframe. Default: M1.

  • InpTF1: Second analysis timeframe. Default: M5.

  • InpTF2: Third analysis timeframe. Default: M15.

  • InpTF3: Highest analysis timeframe. Default: H1.

  • InpBars: Number of historical candles analyzed per timeframe. Default: 800.

The selected timeframes should preferably be ordered from lowest to highest.

Market Structure

  • InpPivotStrength: Number of candles used on each side to confirm a pivot. Default: 5.

Higher values generally produce fewer, more selective pivots.

ATR

  • InpATRPeriod: ATR calculation period. Default: 14.

  • InpMaxDistATR: Maximum distance of the first projected pivot, expressed in ATR multiples. Default: 6.0.

Fair Value Gaps

  • InpFVGMinATR: Minimum FVG size relative to ATR. Default: 0.15.

  • InpMaxZones: Maximum number of detected zones per type and timeframe. Default: 5.

Order Blocks

  • InpOBDispATR: Minimum displacement candle body relative to ATR. Default: 1.2.

  • InpOBLookback: Number of candles searched for the opposing candle. Default: 5.

  • InpOBBodyOnly: Use only the candle body for the Order Block boundaries. Default: false.

Fibonacci

  • InpRetrLevels: Custom Fibonacci retracement levels. Default: 0.382;0.5;0.618;0.786.

  • InpExtLevels: Custom Fibonacci extension levels. Default: 1.0;1.272;1.618.

Separate multiple levels using semicolons.

Projected ZigZag

  • InpChainCycles: Number of projection cycles per timeframe. Default: 2.

  • InpMinScore: Minimum confluence score required for a projected pivot. Default: 4.0.

  • InpMaxNodes: Maximum number of projected pivots. Default: 14.

  • InpPathWidth: Projected path line width. Default: 2.

  • InpShowLabels: Show or hide projected pivot labels. Default: true.

Hit Rate Tracking

  • InpWindow: Rolling number of resolved projected pivots. Default: 1000.

  • InpHitTolATR: Target-zone tolerance relative to ATR. Default: 0.25.

  • InpTimeoutMult: Maximum tracking duration multiplier based on estimated time. Default: 3.0.

  • InpTimeoutMinBars: Minimum tracking duration in timeframe candles. Default: 5.

  • InpHiScore: Threshold separating higher-score and lower-score statistics. Default: 7.0.

  • InpMaxOpen: Maximum number of simultaneously tracked projections. Default: 600.

Historical Backfill

  • InpBackfill: Reconstruct historical statistics at initialization. Default: true.

  • InpForceBackfill: Force a complete reconstruction instead of loading saved history. Default: false.

  • InpBackfillBars: Number of lowest-timeframe candles used for reconstruction. Default: 5000.

  • InpBackfillStep: Number of candles between replay steps. Default: 10.

  • InpBackfillPerTick: Number of replay steps processed per timer cycle. Default: 3.

If the terminal becomes slow during reconstruction, reduce InpBackfillPerTick or increase InpBackfillStep.

Order Block and FVG Display

  • InpShowOB: Show or hide Order Blocks. Default: true.

  • InpShowFVG: Show or hide Fair Value Gaps. Default: true.

  • InpZoneDistATR: Maximum distance for displaying zones. Default: 4.0.

  • InpZoneExtend: Zone extension in chart candles. Default: 15.

  • InpHideLowerTF: Hide zones and structures from timeframes lower than the current chart timeframe. Default: true.

Dashboard

  • InpShowDashboard: Enable or disable the dashboard. Default: true.

  • InpDashX: Horizontal dashboard position. Default: 12.

  • InpDashY: Vertical dashboard position. Default: 24.

  • InpDashNodes: Number of projected pivots displayed in the dashboard. Default: 6.

  • InpDashDetails: Display detailed historical statistics. Default: true.

Additional Display Settings

  • InpShowStructure: Display the latest market structure leg for each timeframe. Default: false.

  • InpAutoShift: Automatically enable chart shift to provide space for projected movements. Default: true.

Timeframe and zone colors can also be customized.

5. Historical Statistics

When the indicator starts, it attempts to load previously saved statistical records.

If there is insufficient saved history and historical backfill is enabled, the indicator reconstructs historical projections using available market data.

The backfill process is an approximation based on closed higher-timeframe candles. Its results may differ from the live tracking process.

Statistics are maintained separately for the projected targets and mirrored reference targets.

6. Recommended Configuration

The default configuration is a suitable starting point for intraday analysis:

  • M1

  • M5

  • M15

  • H1

Allow the indicator to load sufficient historical data before interpreting its statistics.

For slower analysis, consider using higher timeframes and adjusting the number of historical candles accordingly.

7. Important Risk Notice

MTF Pivot Projection is a technical analysis indicator. It does not open, modify or close trading positions.

Projected prices, confluence scores and historical hit rates are analytical information only. They do not guarantee that future market movements will reach projected targets.

Market conditions can change rapidly. Always apply your own trading rules and risk management.

The indicator should be evaluated on the instrument, broker feed and timeframes on which it will be used.
Рекомендуем также
SMC Workflow Auto EA
Choawana Malaikitsanachalee
English – Product Description (V1.42) SMC Workflow Auto EA — SR / OB / FVG with BOS–CHOCH Confirmation Smart-Money-Concepts Expert Advisor that trades only when a clean SMC setup appears: Order-Block retest after Break of Structure (BOS / CHOCH) confirmation, with optional SR and Fair Value Gap (FVG) confluence. The EA uses pending limit orders, fixed SL/TP or RR-based exits, step-lock trailing and strict risk-controls designed to pass broker validation. What it does Detects swing structure usi
FREE
Auto Fractal Support And Resistance is a powerful multi-timeframe indicator designed for traders who want to trade lower timeframes with higher timeframe accuracy. When your mouse cursor is on a line you can easily see fractal describtion and index of fractal candle  and timeframe of that fractal candle.  This indicator automatically detects H1 and D1 fractal levels and draws clean horizontal support and resistance lines on any lower timeframe chart (M1, M5, M15, M30). Now you can see where the
LT Support Resistance — Автоматическое определение уровней поддержки и сопротивления на 100% Вы устали тратить время на ручное построение линий поддержки и сопротивления? Или расстраиваетесь из-за того, что постоянно упускаете важный уровень? Индикатор LT Support Resistance разработан для того, чтобы избавить вас от этой рутины: он автоматически определяет и отмечает наиболее значимые зоны вашего актива одновременно на нескольких таймфреймах. == УМНАЯ АВТОМАТИЗАЦИЯ КРИТИЧЕСКИХ УРОВНЕЙ == Вместо
Supply and Demand with Fibonacci and Classic Pivot What it does This indicator draws supply and demand zones on your chart from pivot points. Ordinary pivot indicators draw thin lines. This one draws zones (price areas), because price usually reacts to an area and rarely to one exact price. You can show up to 10 different periods at once (for example H1, H4, Daily and Weekly), and the indicator highlights the places where zones from different periods overlap. Main features Fibonacci pivots, Clas
Elliott Wave Pro X
Murtadha Majid Jeyad Al-Khuzaie
Elliott Wave Pro X Professional Automatic Elliott Wave Analysis for MetaTrader 5 Elliott Wave Pro X is an advanced automatic Elliott Wave indicator designed for traders who want to identify high-probability market structures with precision and confidence. The indicator continuously analyzes price action and applies Elliott Wave rules and guidelines to detect impulse waves, corrective patterns, diagonals, triangles, and complex market corrections. The indicator helps traders understand the cur
Forex Uncovered PRO v4.60 Professional Support & Resistance Breakout Indicator for MetaTrader 5 Overview Forex Uncovered PRO v4.60 is a professional Support & Resistance Breakout indicator built for MetaTrader 5. Unlike traditional trend indicators, Forex Uncovered focuses on Price Action by automatically identifying significant swing highs and swing lows, building dynamic support and resistance zones, and detecting confirmed breakout opportunities. To reduce false signals, the indicator combine
Caicai L&S Yield Histogram Important Notice: This indicator is an integral tool of the automated EA Caicai Long and Short Pair Trading . This indicator visually displays the percentage deviation (Yield %) of a pair's current spread relative to its own historical mean. It is an excellent tool for quickly visualizing the gross financial potential of a market distortion in Long & Short operations. Main Features: Percentage Visualization: Understand the size of the distortion in palpable percentage
这是一个基于前一个交易日的最高价、最低价和收盘价来计算的枢轴点指标,具体公式如下: 计算前一日的 Pivot Point (枢轴点): Pivot = (High + Low + Close) / 3 计算 Resistance 1 (R1) 、 Support 1 (S1) ​ 等: R1 = (2 * Pivot) - Low S1 = (2 * Pivot) - High R2 = Pivot + (High - Low) S2 = Pivot - (High - Low) 与市面上其他的枢轴点指标相比,该指标主要有以下4个特点: 1、可以修改交易日的开始时间; 2、可以设定支撑压力线的颜色; 3、可以设定是否显示各个支撑压力线对应的价格; 4、可以设定天数用以显示枢轴点的历史记录; 开发这个指标的最初目的是为了解决设定交易日开始时间的问题,接下来会进一步说明。基于计算公式,我们需要获得上一个交易日的最高价、最低价和收盘价,在夏令时,北京时间6点是开市时间,大多数交易平台服务器的0点对应的是北京时间的6点,但是香港的服务器6点才是对应的是北京时间的6点。如果你有多个平台,且存在
Unmask Institutional Market Shifts with Precision Institutional Divergence Reversal Pro Most divergence indicators fail because they are "noisy"—they find every tiny curve in the market, leading to false signals. Institutional Divergence Reversal Pro is engineered to filter out retail noise and identify high-probability reversal zones where "Smart Money" is active. By combining multi-timeframe monitoring with a proprietary Quality Scoring System , this tool ensures you only focus on the setups t
Created by trader and journalist Larry Williams, Setup 9.1 is a simple strategy that is easy to understand and execute, which is why it is so well known and popular in the world of traders and technical analysis. It is a REVERSION setup, where operations are sought when the moving average changes direction. Setup Logic With the open candlestick chart, at any time chart, it is only necessary to add the 9-period Exponential Moving Average (MME9). That done, we look for assets in which the MME9
«Хочу видеть тренд старшего таймфрейма, но надоедает постоянно переключать графики...» Этот продукт создан специально для вас!! Trend Map - Обзор продукта   Этот инструмент записывает направление тренда на каждом таймфрейме (или фрактальной структуре) и отображает его прямо на графике. Панель сохраняется даже при смене таймфрейма, что делает её удобной для трейдеров, часто переключающих графики. Вы можете быстро определить направление тренда и торговать без стресса. Кроме того, с помощью одн
N/B: All our product purchase comes with our free ‘’DAILY   SCALPER EA’’ -   bit.ly/4qlFLNh Whatsapp Developer for yours after successful purchase The Holy Grail MotherBar Indicator: Your Ultimate Path to Consistent Trading Profits   The Problem With Every Other Indicator You've Tried Let me guess - you've spent countless hours and hundreds (maybe thousands) of dollars on indicators that promise the world but deliver mediocre results. You've tried: · Lagging indicators that tell you what
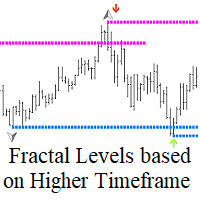
Fractal Levels based on Higher Timeframe э то мощный инструмент предназначен для построения точных уровней поддержки и сопротивления на основе фракталов со старшего таймфрейма, предоставляет вам сигналы на покупку и продажу с удобными оповещениями. Принцип работы: Индикатор анализирует фрактальные уровни на старшем таймфрейме и отображает их на вашем текущем графике. Вы можете легко настроить старший таймфрейм в свойствах индикатора, чтобы получить максимальную точность и соответствие вашим стра
ZigZag Market Structure Breakout Pro ZigZag Extras Display BreakOut points is a MetaTrader 5 indicator for traders who use ZigZag, breakout points, market structure, BOS, CHoCH, swing high, swing low, support and resistance, and higher timeframe bias in their trading analysis. Main Benefits Displays confirmed ZigZag swing highs and swing lows Marks BOS Up, BOS Down, CHoCH Up and CHoCH Down Shows Depth Highest High and Depth Lowest Low lines Adds HH, HL, LH and LL structure labels Includes HTF bi
Delivery State Change Map
Martin Alberto Nunez Da Silveira Van Caester
CISD Delivery Map displays Change in State of Delivery levels from two configurable timeframes and summarizes whether the active context is aligned or mixed. Main functions - Two configurable timeframes; defaults are M15 and H1. - Bullish and bearish CISD detection. - ATR displacement filter for confirmation. - Configurable search for the delivery origin. - Active-level and broken-level management. - Forward projection of confirmed levels. - Multi-timeframe alignment dashboard. - Optional popu
HTF Open Markers + ICT Silver Bullet Zones — Usage & Strategy Guide What it draws Session 1 / Session 2 lines : vertical lines at the open of every bar on two independently configurable higher timeframes (defaults: H4 and D1), including a projected line for the rest of today's not-yet-opened bars on sub-daily timeframes, so you can see where the next candle will open before it happens. ICT Silver Bullet zones : shaded rectangles over the three classic ICT kill-zone windows, converted from New Yo
FREE
Прогнозатор будущего — исторический аналог прогноза ОБЗОР Инструмент прогнозирования будущего сравнивает последнюю ценовую модель с аналогичными моделями из более ранних периодов и суммирует то, что произошло после них. Он показывает вероятности покупки, продажи и нейтральной позиции, прогнозируемую траекторию цены с эмпирическими диапазонами, а также список исторических совпадений, лежащих в основе оценки. Все результаты представляют собой статистические оценки, основанные на данных прошлых
Atbot
Zaha Feiz
4.69 (55)
AtBot: Как это работает и как его использовать ### Как это работает Индикатор "AtBot" для платформы MT5 генерирует сигналы на покупку и продажу, используя комбинацию инструментов технического анализа. Он интегрирует простую скользящую среднюю (SMA), экспоненциальную скользящую среднюю (EMA) и индекс средней истинной амплитуды (ATR) для выявления торговых возможностей. Кроме того, он может использовать свечи Heikin Ashi для повышения точности сигналов. Оставьте отзыв после покупки и получите спе
Eazy RSI Divergence
Gawain Athur Stephan Cloete
Eazy Divergence is a non-repainting MT5 indicator designed to automatically detect and plot Regular and Hidden divergence signals in real time Key Features Dual-Window Plotting: Displays divergence trendlines and text badges directly on both the main price chart and the RSI subwindow. 100% Non-Repainting: Uses left/right pivot strength confirmation so signals stay fixed once drawn. Full Multi-Timeframe Support: Adapts instantly to whatever chart timeframe you are viewing. Fully Customizable: Eas
До 7 уровней пивота Фибоначчи с каждой стороны. Для зон спроса и предложения с градацией и подсчетом ретестов: Supply Demand RSJ PRO Pivot Point Fibo RSJ строит дневную точку пивота и уровни поддержки и сопротивления, рассчитанные по коэффициентам Фибоначчи. Индикатор отображает до 7 уровней поддержки и 7 уровней сопротивления на основе максимума, минимума и цены закрытия предыдущего дня. Трейдеры используют эти уровни как ориентиры для планирования входов, выходов и размещения стопов в течение
FREE
ICT Institutional Zones Pro — Trade with Institutional Precision Stop wasting time manually drawing key ICT levels every day. ICT Institutional Zones Pro is a professional-grade MT5 indicator built for traders who use ICT (Inner Circle Trader) and Smart Money Concepts (SMC) to read market structure with precision. This indicator automatically maps the most important institutional levels directly on your chart, helping you instantly identify where smart money is likely accumulating, distributing
SPECIAL LAUNCH OFFER: $30 (1-Month Rent) Limited time offer to build our community and gather feedback! AmbM GOLD Institutional Scalper A high-precision M5 algorithm for XAUUSD (Gold) , engineered to trade exclusively at Institutional Liquidity Levels ($5/$10 psychological marks). PERFORMANCE DATA (BUY ONLY) • Win Rate: 87.09%. • Safe Growth: +$4,113 profit on $10k (13.75% Max Drawdown). • Extreme Stress Test: Successfully generated +$22,997 in a 5-year stress test (2020-2026), proving
CleanSMC Lite CleanSMC Lite is a MetaTrader 5 custom indicator designed to help traders analyze market structure using a clean Smart Money Concepts style workflow. The indicator focuses on visual structure mapping, demand and supply zones, fair value gap detection, equal highs and equal lows, and optional BUY/SELL signal arrows. The tool is built for discretionary technical analysis and is intended to support chart reading, not to replace a complete trading plan. It does not execute trades, open
Pivot Points MT5 - цветной, универсальный, мультивалютный/мультиинструментальный индикатор системы уровней Pivot Points , состоящий из трех версий: Standard Old, Standard New и Fibo , выбираемых пользователем по желанию. Построение идет для финансовых инструментов в отдельном окне . По выбору пользователя система автоматически рассчитывает точку разворота Pivot Point на основе рыночных данных за истекший день ( PERIOD_D1 ) и систему уровней сопротивления и поддержки по три в каждом. Пользователю
В MetaTrader построение нескольких   горизонтальных линий   и отслеживание их ценовых уровней может быть утомительным. Этот индикатор автоматически строит горизонтальные линии на равных интервалах для установки ценовых оповещений, отображения уровней поддержки и сопротивления и других ручных целей. Этот индикатор идеально подходит для начинающих трейдеров на рынке Форекс, стремящихся быстро заработать на покупке и продаже. Горизонтальные линии помогают определить возможные зоны для входа в рынок
Trading Discipline Trend Dashboard считывает только уже закрытую историю сделок вашего собственного счёта и превращает четыре конкретных паттерна в тренд за 7 дней, чтобы вы видели, происходит что-то один раз или повторяется каждую неделю. Инструмент ничего не прогнозирует и не даёт советов. Каждое число на панели - это то, что уже произошло на этом счёте. Как строятся числа: считываются закрытые сделки за последние до 37 дней по всем символам и всем магическим номерам - это картина по всему сч
SMC Session Scanner MT5 is a panel indicator for MetaTrader 5 that watches many symbols and timeframes for smart-money structure and session levels. For each symbol and timeframe it shows one of these: a fresh break of structure (BOS), a change of character (CHoCH), or a fresh liquidity sweep. It also shows price inside a live order block or fair value gap. Otherwise it shows the latest break and how long ago it was. A Session column shows the session now. It also shows today's first close beyon
Adaptive Trend Lines
Henri Salvatore Bigatti
4.76 (25)
This indicator shows the TLH and TLL and some trendlines that allow us to estimate the trend of market.  It also shows the values of the angles of the lines in percentage in points (pip) , the standard deviation, and the trend of each line, and when it breaks the lines of support and resistance (TLH and TLL). And finally, it also shows the points identified as supports and resistances through the fractal algorithm in the graph. The high and low trend lines are supported by the highs and lows, th
FREE
Apex Break PRO — не перерисовывающийся индикатор пробоя трендовых линий по пивотным точкам для MetaTrader 5. Он определяет пивотные максимумы и пивотные минимумы, рисует динамические наклонные трендовые линии между последовательными пивотами и генерирует сигналы на покупку и продажу, когда цена пробивает эти трендовые линии при подтверждённом закрытии бара. Каждый сигнал фильтруется через до четырёх независимых уровней подтверждения — тренд по EMA, границы RSI, определение всплеска объёма и сила
Supreme Power House reads market structure, grades every signal against seven filters and draws a complete trade plan for each one. It prints a BUY or a SELL when a candle closes beyond the latest swing: a change of character (CHoCH) when the break turns the structure, a break of structure (BOS) when it continues it. Each signal comes with an entry, a stop, up to three targets and a grade from A to C, surrounded by an adaptive trend ribbon, ICT zones and a dashboard of six timeframes. Everythin
С этим продуктом покупают
Trend Sniper X
Sarvarbek Abduvoxobov
4.86 (44)
Trend Sniper X — это трендовый индикатор для MetaTrader 5, работающий на нескольких таймфреймах, который помогает трейдерам точно и ясно определять направление тренда и потенциальные точки разворота. для MT4: https://www.mql5.com/en/market/product/193245 Информация о цене: Текущая цена является промо-ценой и может измениться по мере выхода предстоящих обновлений и новых функций. Бонусное предложение: Чтобы получить БЕСПЛАТНЫЙ авто-трейд советник Assistant EA для этого индикатора, пожалуйста, на
Новый король в городе — Индикатор + управление ордерами (TP1 + TP2 + TP3) + опциональный Telegram-сигнал-сендер ВКЛЮЧЁН (БЕСПЛАТНО) (ПОЛНОЦЕННАЯ ТОРГОВАЯ И СИГНАЛЬНАЯ СИСТЕМА) Gold Slayer EA Этот индикатор включает в себя продвинутую стратегию, торговую систему с настраиваемым управлением ордерами и систему mean reversion, которая сочетает расширения Envelope и поддерживается несколькими интеллектуальными фильтрами подтверждения, такими как RSI, для поиска высоковероятных точек разворота с сигн
Smart Trend Trading System — MetaTrader 5 После покупки напишите мне на MQL5, чтобы БЕСПЛАТНО получить Smart Universal Expert Advisor, а также доступ к онлайн-курсу, руководство в формате PDF и доступ к закрытой группе. STTS объединяет направление тренда, сигналы входа и выхода, зоны разворота и важные ценовые уровни прямо на графике. Торгуйте по системе вручную или подключите отдельный совместимый советник для автоматического исполнения с выбранными вами настройками. ОДНА СИСТЕМА. ЧЕТЫРЕ ТОРГОВ
Entry Points Pro показывает, где входить, где ставить стоп и каким лотом торговать — до того, как вы поставите ордер. ЦЕНА Сейчас 149 USD, и это последняя копия по этой цене. После неё цена вырастет до 199 USD, а финальная цена — 349 USD. Я зарабатываю торговлей на рынке и показываю это, поэтому мне не нужно продавать этот индикатор всем подряд. Это инструмент для трейдеров, которые думают своей головой, а не волшебная кнопка. Стрелка появляется на закрытии свечи и не перерисовывается. Две на
Получите своё торговое преимущество в поле зрения! M5 Sniper — это новый индикатор от MeanFX. Он сочетает точные торговые сигналы с адаптивными уровнями TP/SL — в результате создавая лучшие возможные статистические сделки! Цена увеличивается каждые 5 покупок, следующая цена — 69$ Напишите мне после покупки, чтобы получить советы/руководство и бонусного EA Что выделяет его среди других? Проверенная статистическая эффективность на Gold XAUUSD ( работает практически на каждом активе , с акцентом н
SuperScalp Pro
Van Minh Nguyen
4.54 (37)
SuperScalp Pro - Professional Multi-Layer Confluence Scalping System SuperScalp Pro — это продвинутый индикатор для скальпинга, который расширяет возможности классического Supertrend с помощью нескольких интеллектуальных фильтров подтверждения. Он помогает выявлять торговые возможности Buy/Sell с более высокой вероятностью успеха и значительно сокращать количество ложных сигналов. Чёткие стрелки Buy и Sell отображаются непосредственно на графике вместе с автоматически рассчитываемыми в реальном
Gold Trend Coach MT5
Cristhian Alexander Gaibor Cuasquer
4.2 (10)
Gold Trend Coach — трендовый индикатор по золоту (XAUUSD) для MetaTrader 5 с сигналами на покупку и продажу, стоп-лоссом и тремя тейк-профитами, подтверждёнными на закрытии свечи (без перерисовки), коучем, который ведёт вас от входа до TP3, мультитаймфреймовой панелью и оповещениями на телефон и в Telegram. Создан для скальпинга на M1 и M5 и интрадея на M15 в лондонскую и нью-йоркскую сессии. БОНУС: БЕСПЛАТНЫЙ советник для автоторговли по Gold Trend Coach. Напишите мне после покупки, и я отправл
SMC Intraday Formula
VividMind Digital Solutions
5 (26)
Давайте сначала будем честны. Ни один индикатор сам по себе не сделает вас прибыльным. Если кто-то говорит вам обратное — он продаёт вам мечту. Любой индикатор, который показывает идеальные стрелки покупки/продажи, можно сделать безупречным — просто увеличьте нужный участок истории и сделайте скриншот успешных сделок. Мы так делать не будем. SMC Intraday Formula — это инструмент. Он считывает структуру рынка за вас, определяет зоны с наивысшей вероятностью движения цены и точно показывает, как
Gann Made Easy   - это профессиональная, но при этом очень простая в применении Форекс система, основанная на лучших принципах торговли по методам господина У.Д. Ганна. Индикатор дает точные BUY/SELL сигналы, включающие в себя уровни Stop Loss и Take Profit. ПОЖАЛУЙСТА, СВЯЖИТЕСЬ СО МНОЙ ПОСЛЕ ПОКУПКИ, ЧТОБЫ ПОЛУЧИТЬ ТОРГОВЫЕ ИНСТРУКЦИИ И ОТЛИЧНЫЕ ДОПОЛНИТЕЛЬНЫЕ ИНДИКАТОРЫ БЕСПЛАТНО! Вероятно вы уже не раз слышали о торговли по методам Ганна. Как правило теория Ганна отпугивает от себя не только
ULTRA - это технический индикатор, который который работает по принципу “Все включено” - самостоятельно анализирует рынок, дает торговые сигналы, показывает уровни для установки стоп лосс, а также подсказывает когда нужно закрывать сделки, чтобы получить профит или минимизировать убыток. То есть, не важно, что ты не умеешь анализировать рынок, определять уровни - где поставить SL или плохо совладаешь с мани-менеджментом. ULTRA все это сделает вместо тебя! БОНУС ДЛЯ ПОКУПАТЕЛЯ : После покупки ULT
Boba Analysis Suite
Trade Ready Solutions LLC
5 (2)
Boba Analysis Suite Boba Analysis Suite — аналитический индикатор для MetaTrader 5. Он объединяет структуру рынка, значимые ценовые зоны и общий рыночный контекст в одном представлении на графике. Индикатор разработан на основе практического опыта трейдера и наставника по трейдингу. Он помогает выстроить последовательный процесс анализа: оценивать направление рынка, определять важные уровни и рассматривать несколько таймфреймов в совокупности. Анализ с учётом контекста Значение отдельных сигнало
Следующее обновление — версия 2.52 уже скоро! [НОВОЕ] Приготовьтесь к 4 новым важным функциям, призванным улучшить ваш анализ рынка и торговый процесс. Мы выводим анализ рынка на новый уровень с помощью 4 новых функций, разработанных с учётом ваших потребностей в трейдинге. Представляем: 1. TRADE OVERVIEW DASHBOARD 2. CONFLUENCE AT ZONE 3. STRONG & WEAK HIGH/LOW 4. OTE 1. TRADE OVERVIEW DASHBOARD Панель, которая помогает легче понимать общую картину рынка, предоставляя рекомендации для поддержк
M1 SNIPER   — это простая в использовании торговая система. Это стрелочный индикатор, разработанный для тайм фрейма M1. Индикатор можно использовать как отдельную систему для скальпинга на тайм фрейме M1, а также как часть вашей существующей торговой системы. Хотя эта торговая система была разработана специально для торговли на M1, ее можно использовать и с другими тайм фреймами. Первоначально я разработал этот метод для торговли XAUUSD и BTCUSD. Но я считаю этот метод полезным и для торговли на
FiboSniper Pro – Multi-Filter Fibonacci System with Auto SL/TP and Control Panel FiboSniper Pro — это технический индикатор, который объединяет динамические Fibonacci Envelopes с несколькими фильтрами подтверждения для формирования отборных сигналов Buy и Sell. Уровни Fibonacci рассчитываются на основе Moving Average и ATR, а затем фильтруются с помощью ADX, EMA, RSI, ATR, Volume, Time и структуры свечи. Индикатор отображает на графике автоматические уровни Stop Loss и Take Profit на основе ATR,
Auto Optimized SpeedAngle — это система векторизации импульса институционального уровня, которая исключает подгонку под исторические данные (curve-fitting) за счет непрерывной форвард-оптимизации (Walk-Forward Optimization, WFO). Вместо того чтобы полагаться на статические входные параметры, которые теряют эффективность при смене рыночных режимов, индикатор динамически перекалибрует свои настройки, используя валидацию на вневыборочных данных (Out-of-Sample, OOS). Это гарантирует, что отображаемы
Adaptive Price Action Engine Купи индикатор — получи советник (EA) к нему бесплатно Самооптимизирующийся мульти-таймфреймовый анализ тренда и свечных моделей Рынок постоянно меняется — и не каждая модель Price Action имеет одинаковую ценность в разных рыночных режимах. Adaptive Price Action Engine создан для адаптации к изменяющимся рыночным условиям, объединяя трендовую структуру, мульти-таймфреймовый анализ, свечные модели и статистическую оптимизацию в единой аналитической системе. Два адапти
Crystal Heikin Ashi Signals—Professional Trend & Signal Detection Indicator Advanced Heikin Ashi Visualization with Intelligent Signal System for Manual & Automated Trading Final Price: $149 ---------> Price goes up $10 after every 10 sales . Limited slots available — act fast . Overview User Guide PDF Crystal Heikin Ashi Signals is a professional-grade MetaTrader 5 indicator that combines pure Heikin Ashi candle visualization with an advanced momentum-shift detection system. Designed for both m
Scalper Vault — это мощная, полноценная торговая система, созданная для трейдеров, которые стремятся к стабильным результатам в внутридневной торговле. Этот высокоточный индикатор представляет собой комплексное, самостоятельное торговое решение, обеспечивающее аналитику профессионального (институционального) уровня как для торговли на рынке Forex, так и для работы с бинарными опционами. Пожалуйста, свяжитесь со мной после покупки, чтобы получить мои торговые советы, а также отличный бонус! Исклю
Trend Catcher   анализирует движения рыночных цен, используя комбинацию собственных и индивидуально разработанных адаптивных индикаторов анализа тренда. Он определяет истинное направление рынка, отфильтровывая краткосрочные шумы и фокусируясь на силе импульса, расширении волатильности и поведении ценовой структуры. Он также использует комбинацию сглаживающих и фильтрующих тренд индикаторов, таких как скользящие средние, RSI и фильтры волатильности. Мониторинг реальных операций, а также другие
Atomic Analyst — MetaTrader 5 После покупки напишите мне на MQL5, чтобы БЕСПЛАТНО получить Smart Universal Expert Advisor, а также доступ к онлайн-курсу, руководство в формате PDF и доступ к закрытой группе. Atomic Analyst объединяет анализ ценового движения, направление тренда, сигналы входа и выхода, уровни Stop Loss и несколько уровней Take Profit прямо на графике. УВИДЬТЕ СИГНАЛ. ОЦЕНИТЕ ТОРГОВУЮ СИТУАЦИЮ. Atomic Analyst представляет результаты анализа в понятном визуальном виде: • Стрелки п
Unix Scalper — MetaTrader 5 После покупки напишите мне на MQL5, чтобы БЕСПЛАТНО получить Smart Universal Expert Advisor, а также доступ к онлайн-курсу, руководство в формате PDF и доступ к закрытой группе. Найдите торговую ситуацию. Оцените план. Выберите способ торговли. UNIX Scalper объединяет анализ рынка, решения BUY/SELL/WAIT и уровни Entry, Stop Loss, TP1 и TP2 в одной удобной панели. УВИДЬТЕ СИГНАЛ И ТОРГОВЫЙ ПЛАН • Понятные решения: BUY, SELL или WAIT. • Определённые уровни: Entry, Stop
SIO Oscillator: самооптимизирующийся осциллятор дисбаланса семивариаций Купите индикатор и получите советник (EA) на его основе БЕСПЛАТНО. Большинство осцилляторов воспринимают любое движение цены одинаково. SIO разделяет давление покупателей и продавцов и измеряет дисбаланс между ними, показывая, какая сторона действительно контролирует рынок. Когда дисбаланс достигает экстремума, SIO выдаёт чёткий сигнал с уровнями входа, Stop Loss и Take Profit. Главное отличие SIO в том, что он не полагается
Volatility Master for MetaTrader is a real-time dashboard tool that scans up to  50 symbols  to identify high-volatility , trending markets instantly. With bullish/bearish signals, customizable alerts, and a user-friendly interface, it helps you avoid range-bound conditions and focus on high-probability trades. Clarity leads to confidence. Trade confidently and protect your capital effectively with this powerful dashboard. We don't offer free or bonus indicators in exchange of reviews from you.
Smc Pro ToolKit
Talal N Z Aljarusha
5 (14)
SMC PRO TOOLKIT — SMART MONEY ANALYSIS & STRUCTURED TRADE PLANNING SMC Pro ToolKit is a professional Smart Money Concepts analysis workspace for MetaTrader 5. It combines market structure, multi-timeframe analysis, institutional price zones, setup evaluation, confirmation tools, volume context, alerts, and risk planning inside one organized chart environment. One workspace. Multiple layers of confirmation. One structured trading plan. OPEN COMPLETE USER GUIDE MULTI-CONDITION SETUP ENGINE At
Мультивалютный индикатор силы и импульса MT5 Dynamic Forex28 Navigator — развитие наших давно популярных индикаторов, объединяющее силу пяти в одном: Advanced Currency Strength28 Indicator (700 отзывов) Advanced Currency IMPULSE with ALERT (530 отзывов) Currency Strength EXOTICS GOLD Impulse with Alert CS28 Combo Signals (текущий бонус) Не нужно покупать четыре индикатора и ставить их на графики. Всё объединено в одном мощном индикаторе: сила 28 пар Forex, импульс рынка, который их ведёт, и опов
AriFocus - Non-Repainting Buy/Sell Signals AriFocus - one clear signal. AriFocus marks buy and sell signals directly on the chart and suggests a stop-loss level for each one. Every signal is confirmed on bar close and never repaints. - Buy/sell arrows, confirmed on bar close - Suggested stop-loss level for every signal - Trend band and candle coloring to show direction at a glance - 10 ready-made presets, or your own settings (14 calculation methods) - Pop-up, push and email alerts with entr
Neuro Poseidon - новый индикатор от Дарьи Резуевой. Он сочетает точные торговые сигналы с адаптивными уровнями TP/SL , в результате создавая максимально выгодные сделки! TO SWITCH TO   ENG   PLEASE CHOOSE IT IN THE UPPER-RIGHT CORNER OF THE WEBSITE Напишите мне и получите  Neuro Poseidon Assistant  в подарок для автоматизации вашей торговли! Что отличает его от других индикаторов? 1. Доказанная прибыльность на всех активах и таймфреймах 2. На графике присутствуют только подтвержденные сигналы н
Свинг-трейдинг - это первый индикатор, предназначенный для обнаружения колебаний в направлении тренда и возможных разворотов. Он использует базовый подход свинговой торговли, широко описанный в торговой литературе. Индикатор изучает несколько векторов цен и времени для отслеживания направления совокупного тренда и выявляет ситуации, когда рынок перепродан или перекуплен и готов к исправлению. [ Руководство по установке | Руководство по обновлению | Устранение неполадок | FAQ | Все продукты ] П
Azimuth Pro
Ottaviano De Cicco
5 (7)
Azimuth Pro V2: Синтетический фрактальный структурный анализ и подтверждённые входы для MT5 Обзор Azimuth Pro — многоуровневый индикатор свинговой структуры от Merkava Labs . Четыре вложенных уровня свингов, привязанный к свингам VWAP, определение ABC-паттернов, трёхтаймфреймная структурная фильтрация и подтверждённые входы на закрытой свече — один график, один рабочий процесс от микро-свингов до макро-циклов. Это не слепой сигнальный продукт. Это рабочий процесс, основанный на структуре, для т
SkyHammer Signal Pro Профессиональный трендовый индикатор без перерисовки с фиксированными уровнями Entry, SL и TP SkyHammer Signal Pro — это структурированный индикатор тренда и momentum, созданный для трейдеров, которым нужны четкие, зафиксированные и проверяемые торговые сигналы. Лучше всего он работает на младших таймфреймах, таких как M1 и M5 . Индикатор не пытается предсказывать вершины или основания рынка. Вместо этого он ожидает подтвержденную рыночную структуру, направление тренда, силу
Другие продукты этого автора
Chart Pattern Navigator MT5 Overview Chart Pattern Navigator MT5 is a technical analysis indicator designed to automatically detect, classify and visualize classic chart patterns directly on your MetaTrader 5 charts. It helps traders identify potential market structures, monitor pattern development and evaluate possible trading scenarios without having to draw every formation manually. The indicator combines pattern recognition, configurable breakout and retest logic, projected entry levels, st
Фильтр:
Нет отзывов
Ответ на отзыв