MTF Pivot Projection

MTF Pivot Projection

Multi-Timeframe Market Structure and Forward Pivot Analysis

MTF Pivot Projection is a technical analysis indicator designed to combine multi-timeframe market structure, Fibonacci levels, Order Blocks and Fair Value Gaps into a single projected price path.

Instead of displaying independent pivot levels from multiple timeframes, the indicator builds one continuous sequence of potential future swing highs and lows, from the nearest projected retracement to subsequent extension targets.

The indicator also includes a performance tracking system that evaluates whether previously projected target zones were reached and compares the results with a mirrored reference target.

Main Features

1. Multi-Timeframe Pivot Analysis

Analyze four independently configurable timeframes simultaneously. The default configuration uses M1, M5, M15 and H1.

Each timeframe contributes its own market structure and projection candidates.

2. Unified Projected ZigZag

The indicator combines the projections from all selected timeframes into a single chronological path.

The projected path alternates between potential swing highs and swing lows, providing a visual representation of possible future price movements.

3. Fibonacci Retracements and Extensions

Retracement levels are used to calculate potential pullback targets.

Extension levels are used to estimate possible continuation targets.

The Fibonacci levels can be customized through the indicator settings.

4. Order Blocks and Fair Value Gaps

The indicator identifies unmitigated bullish and bearish Order Blocks and Fair Value Gaps.

These zones contribute to the confluence score and can be displayed directly on the chart.

5. Confluence Scoring

Each projected pivot receives a score based on several factors:

  • Fibonacci level weighting.

  • Order Block confluence.

  • Fair Value Gap confluence.

  • Market bias on the originating timeframe.

  • Higher-timeframe directional bias.

  • Distance from the current market price.

The displayed percentage is a normalized visual score. It is not a statistical probability of success.

6. Historical Performance Tracking

The indicator records the outcome of projected pivots over a rolling observation window.

A target is considered reached when price enters its configured tolerance zone before the projection expires or its invalidation condition occurs.

A mirrored reference target is also tracked to provide a comparison baseline.

The dashboard displays overall performance and additional statistics by timeframe, projection depth and score category.

7. Historical Backfill and Persistent Statistics

The indicator can reconstruct historical projection outcomes when first initialized.

Statistical records are saved locally and reused when the indicator is loaded again.

8. Integrated Dark Dashboard

A modern dashboard provides a compact overview of projected pivots and historical statistics without requiring separate windows.

Recommended Usage

MTF Pivot Projection is intended as an analytical tool for traders who use market structure, Fibonacci analysis and Smart Money Concepts.

It can be used on different chart timeframes. The analysis timeframes are configured independently from the chart timeframe.

The default M1, M5, M15 and H1 configuration is suitable as a starting point for intraday analysis.

Important Information

This indicator does not execute trades or provide guaranteed trading signals.

Projected pivots are analytical estimates based on the latest available market structure and selected confluences. They may change when new market data becomes available.

The displayed historical hit rate describes the indicator's own target-touch evaluation methodology. It does not represent a trading win rate or guarantee future performance.

Always use independent risk management and evaluate the indicator on your preferred instrument and trading conditions.


MTF Pivot Projection – User Guide

1. Installation

  1. Download and install the indicator through the MetaTrader 5 Market.

  2. Open MetaTrader 5.

  3. Open the Navigator window.

  4. Locate MTF Pivot Projection under Indicators.

  5. Drag the indicator onto the desired chart.

  6. Allow the indicator to load the required historical data.

The indicator can be attached to different chart timeframes. Its analysis timeframes are configured independently.

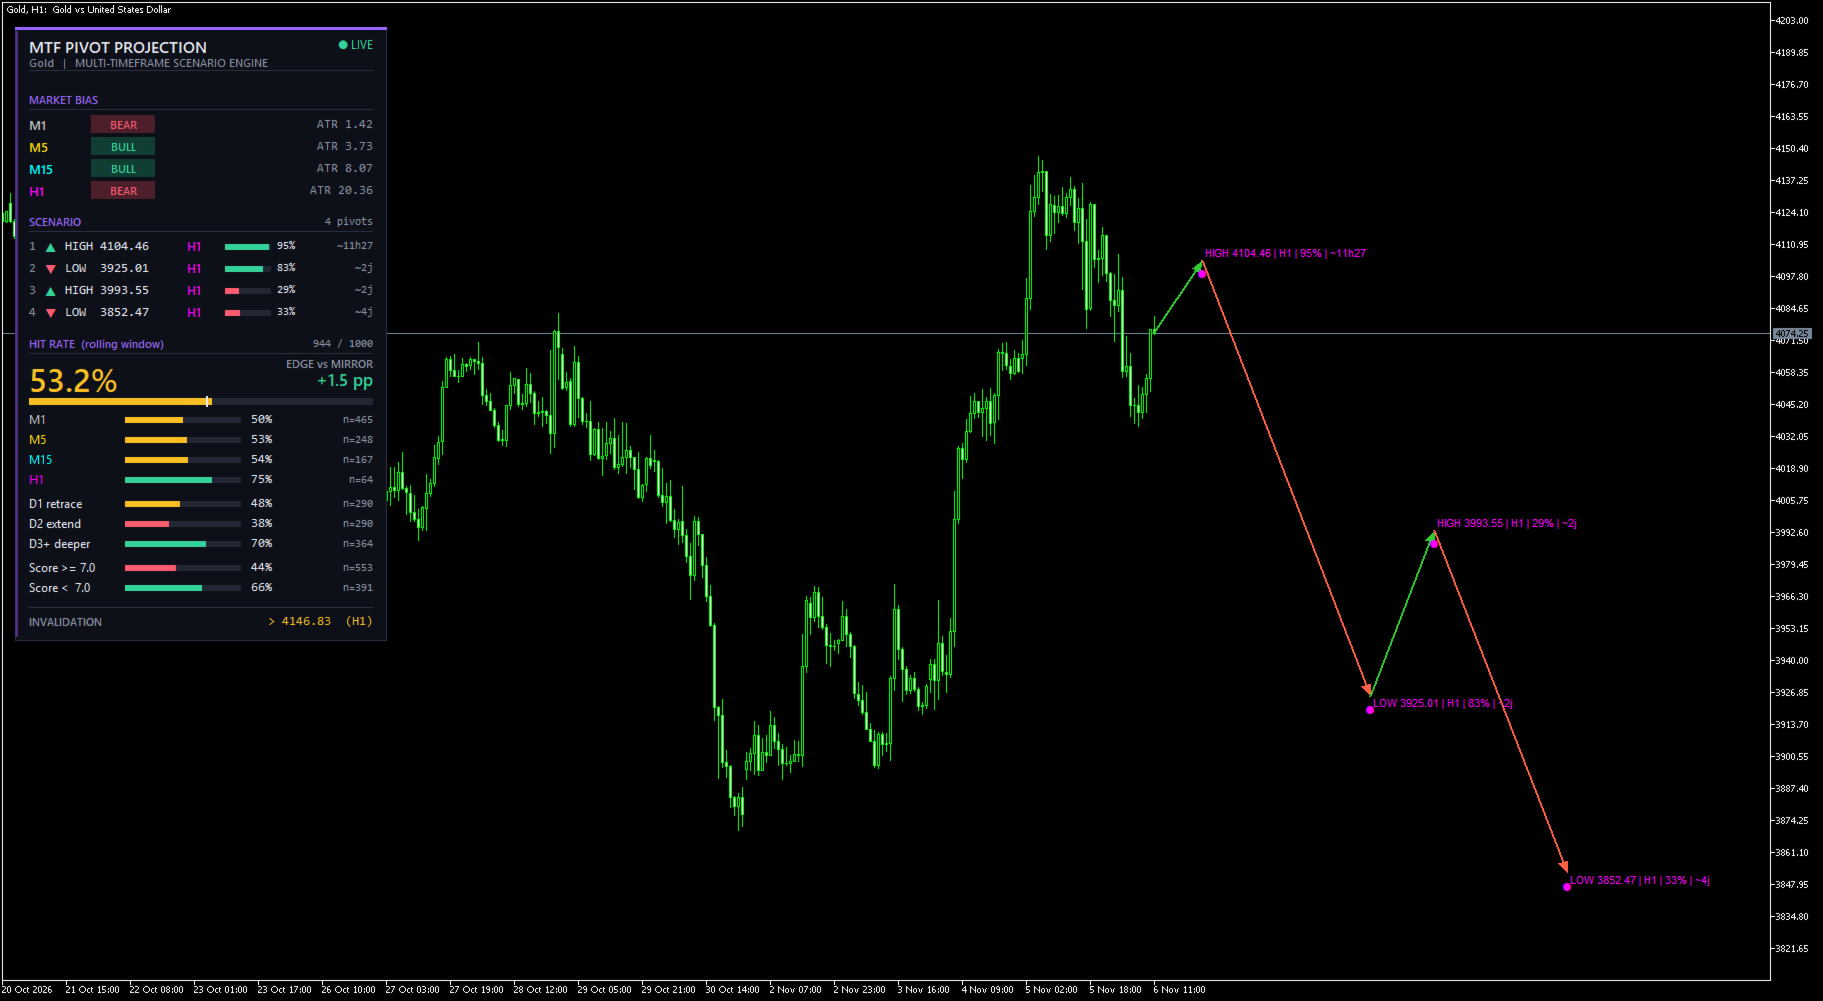
2. Understanding the Chart

Projected ZigZag

The projected path starts from the current market price and connects the estimated future pivot points.

  • Green segments represent upward projected movements.

  • Red segments represent downward projected movements.

  • Each projected pivot is marked with its estimated price.

  • Labels display the pivot type, source timeframe, score and estimated time.

The projections are estimates and may change as market conditions evolve.

Timeframe Colors

Each timeframe has its own marker and label color.

Default configuration:

  • M1: Silver

  • M5: Gold

  • M15: Aqua

  • H1: Magenta

Order Blocks

Order Blocks are displayed as colored chart zones.

  • Bullish Order Blocks represent potential demand areas.

  • Bearish Order Blocks represent potential supply areas.

Fair Value Gaps

Fair Value Gaps are displayed as separate colored zones.

  • Bullish FVG: blue.

  • Bearish FVG: purple.

Only zones meeting the indicator's detection and mitigation conditions are displayed.

3. Dashboard

The dashboard provides a summary of the current projected scenario and its historical evaluation.

The main statistics include:

Hit Rate

Percentage of resolved projected targets that reached their target zone before expiration or invalidation.

Baseline

A mirrored reference target is evaluated using the same tracking methodology. It provides a comparison against the original projected target.

Timeframe Statistics

Shows the historical results associated with each analysis timeframe.

Projection Depth

Separates statistics according to the position of the projected pivot in the scenario.

Score Categories

Compares projections with higher and lower confluence scores.

Important: the displayed score percentage is a normalized confluence score, not a probability of success.

4. Input Parameters

Analysis Timeframes

  • InpTF0: Lowest analysis timeframe. Default: M1.

  • InpTF1: Second analysis timeframe. Default: M5.

  • InpTF2: Third analysis timeframe. Default: M15.

  • InpTF3: Highest analysis timeframe. Default: H1.

  • InpBars: Number of historical candles analyzed per timeframe. Default: 800.

The selected timeframes should preferably be ordered from lowest to highest.

Market Structure

  • InpPivotStrength: Number of candles used on each side to confirm a pivot. Default: 5.

Higher values generally produce fewer, more selective pivots.

ATR

  • InpATRPeriod: ATR calculation period. Default: 14.

  • InpMaxDistATR: Maximum distance of the first projected pivot, expressed in ATR multiples. Default: 6.0.

Fair Value Gaps

  • InpFVGMinATR: Minimum FVG size relative to ATR. Default: 0.15.

  • InpMaxZones: Maximum number of detected zones per type and timeframe. Default: 5.

Order Blocks

  • InpOBDispATR: Minimum displacement candle body relative to ATR. Default: 1.2.

  • InpOBLookback: Number of candles searched for the opposing candle. Default: 5.

  • InpOBBodyOnly: Use only the candle body for the Order Block boundaries. Default: false.

Fibonacci

  • InpRetrLevels: Custom Fibonacci retracement levels. Default: 0.382;0.5;0.618;0.786.

  • InpExtLevels: Custom Fibonacci extension levels. Default: 1.0;1.272;1.618.

Separate multiple levels using semicolons.

Projected ZigZag

  • InpChainCycles: Number of projection cycles per timeframe. Default: 2.

  • InpMinScore: Minimum confluence score required for a projected pivot. Default: 4.0.

  • InpMaxNodes: Maximum number of projected pivots. Default: 14.

  • InpPathWidth: Projected path line width. Default: 2.

  • InpShowLabels: Show or hide projected pivot labels. Default: true.

Hit Rate Tracking

  • InpWindow: Rolling number of resolved projected pivots. Default: 1000.

  • InpHitTolATR: Target-zone tolerance relative to ATR. Default: 0.25.

  • InpTimeoutMult: Maximum tracking duration multiplier based on estimated time. Default: 3.0.

  • InpTimeoutMinBars: Minimum tracking duration in timeframe candles. Default: 5.

  • InpHiScore: Threshold separating higher-score and lower-score statistics. Default: 7.0.

  • InpMaxOpen: Maximum number of simultaneously tracked projections. Default: 600.

Historical Backfill

  • InpBackfill: Reconstruct historical statistics at initialization. Default: true.

  • InpForceBackfill: Force a complete reconstruction instead of loading saved history. Default: false.

  • InpBackfillBars: Number of lowest-timeframe candles used for reconstruction. Default: 5000.

  • InpBackfillStep: Number of candles between replay steps. Default: 10.

  • InpBackfillPerTick: Number of replay steps processed per timer cycle. Default: 3.

If the terminal becomes slow during reconstruction, reduce InpBackfillPerTick or increase InpBackfillStep.

Order Block and FVG Display

  • InpShowOB: Show or hide Order Blocks. Default: true.

  • InpShowFVG: Show or hide Fair Value Gaps. Default: true.

  • InpZoneDistATR: Maximum distance for displaying zones. Default: 4.0.

  • InpZoneExtend: Zone extension in chart candles. Default: 15.

  • InpHideLowerTF: Hide zones and structures from timeframes lower than the current chart timeframe. Default: true.

Dashboard

  • InpShowDashboard: Enable or disable the dashboard. Default: true.

  • InpDashX: Horizontal dashboard position. Default: 12.

  • InpDashY: Vertical dashboard position. Default: 24.

  • InpDashNodes: Number of projected pivots displayed in the dashboard. Default: 6.

  • InpDashDetails: Display detailed historical statistics. Default: true.

Additional Display Settings

  • InpShowStructure: Display the latest market structure leg for each timeframe. Default: false.

  • InpAutoShift: Automatically enable chart shift to provide space for projected movements. Default: true.

Timeframe and zone colors can also be customized.

5. Historical Statistics

When the indicator starts, it attempts to load previously saved statistical records.

If there is insufficient saved history and historical backfill is enabled, the indicator reconstructs historical projections using available market data.

The backfill process is an approximation based on closed higher-timeframe candles. Its results may differ from the live tracking process.

Statistics are maintained separately for the projected targets and mirrored reference targets.

6. Recommended Configuration

The default configuration is a suitable starting point for intraday analysis:

  • M1

  • M5

  • M15

  • H1

Allow the indicator to load sufficient historical data before interpreting its statistics.

For slower analysis, consider using higher timeframes and adjusting the number of historical candles accordingly.

7. Important Risk Notice

MTF Pivot Projection is a technical analysis indicator. It does not open, modify or close trading positions.

Projected prices, confluence scores and historical hit rates are analytical information only. They do not guarantee that future market movements will reach projected targets.

Market conditions can change rapidly. Always apply your own trading rules and risk management.

The indicator should be evaluated on the instrument, broker feed and timeframes on which it will be used.
Prodotti consigliati
SMC Workflow Auto EA
Choawana Malaikitsanachalee
English – Product Description (V1.42) SMC Workflow Auto EA — SR / OB / FVG with BOS–CHOCH Confirmation Smart-Money-Concepts Expert Advisor that trades only when a clean SMC setup appears: Order-Block retest after Break of Structure (BOS / CHOCH) confirmation, with optional SR and Fair Value Gap (FVG) confluence. The EA uses pending limit orders, fixed SL/TP or RR-based exits, step-lock trailing and strict risk-controls designed to pass broker validation. What it does Detects swing structure usi
FREE
Auto Fractal Support And Resistance is a powerful multi-timeframe indicator designed for traders who want to trade lower timeframes with higher timeframe accuracy. When your mouse cursor is on a line you can easily see fractal describtion and index of fractal candle  and timeframe of that fractal candle.  This indicator automatically detects H1 and D1 fractal levels and draws clean horizontal support and resistance lines on any lower timeframe chart (M1, M5, M15, M30). Now you can see where the
LT Support Resistance - Identifica supporti e resistenze in modo 100% automatico Sei stanco di perdere tempo a tracciare manualmente le linee di supporto e resistenza? O ti senti frustrato perché ti sfugge sempre quel livello importante? LT Support Resistance è stato sviluppato per eliminare questo lavoro, identificando e contrassegnando automaticamente le zone più rilevanti del tuo asset su molteplici timeframe simultanei. == L'AUTOMAZIONE INTELLIGENTE DEI LIVELLI CRITICI == Invece di disegnare
Supply and Demand with Fibonacci and Classic Pivot What it does This indicator draws supply and demand zones on your chart from pivot points. Ordinary pivot indicators draw thin lines. This one draws zones (price areas), because price usually reacts to an area and rarely to one exact price. You can show up to 10 different periods at once (for example H1, H4, Daily and Weekly), and the indicator highlights the places where zones from different periods overlap. Main features Fibonacci pivots, Clas
Elliott Wave Pro X
Murtadha Majid Jeyad Al-Khuzaie
Elliott Wave Pro X Professional Automatic Elliott Wave Analysis for MetaTrader 5 Elliott Wave Pro X is an advanced automatic Elliott Wave indicator designed for traders who want to identify high-probability market structures with precision and confidence. The indicator continuously analyzes price action and applies Elliott Wave rules and guidelines to detect impulse waves, corrective patterns, diagonals, triangles, and complex market corrections. The indicator helps traders understand the cur
Forex Uncovered PRO v4.60 Professional Support & Resistance Breakout Indicator for MetaTrader 5 Overview Forex Uncovered PRO v4.60 is a professional Support & Resistance Breakout indicator built for MetaTrader 5. Unlike traditional trend indicators, Forex Uncovered focuses on Price Action by automatically identifying significant swing highs and swing lows, building dynamic support and resistance zones, and detecting confirmed breakout opportunities. To reduce false signals, the indicator combine
Caicai L&S Yield Histogram Important Notice: This indicator is an integral tool of the automated EA Caicai Long and Short Pair Trading . This indicator visually displays the percentage deviation (Yield %) of a pair's current spread relative to its own historical mean. It is an excellent tool for quickly visualizing the gross financial potential of a market distortion in Long & Short operations. Main Features: Percentage Visualization: Understand the size of the distortion in palpable percentage
这是一个基于前一个交易日的最高价、最低价和收盘价来计算的枢轴点指标,具体公式如下: 计算前一日的 Pivot Point (枢轴点): Pivot = (High + Low + Close) / 3 计算 Resistance 1 (R1) 、 Support 1 (S1) ​ 等: R1 = (2 * Pivot) - Low S1 = (2 * Pivot) - High R2 = Pivot + (High - Low) S2 = Pivot - (High - Low) 与市面上其他的枢轴点指标相比,该指标主要有以下4个特点: 1、可以修改交易日的开始时间; 2、可以设定支撑压力线的颜色; 3、可以设定是否显示各个支撑压力线对应的价格; 4、可以设定天数用以显示枢轴点的历史记录; 开发这个指标的最初目的是为了解决设定交易日开始时间的问题,接下来会进一步说明。基于计算公式,我们需要获得上一个交易日的最高价、最低价和收盘价,在夏令时,北京时间6点是开市时间,大多数交易平台服务器的0点对应的是北京时间的6点,但是香港的服务器6点才是对应的是北京时间的6点。如果你有多个平台,且存在
Unmask Institutional Market Shifts with Precision Institutional Divergence Reversal Pro Most divergence indicators fail because they are "noisy"—they find every tiny curve in the market, leading to false signals. Institutional Divergence Reversal Pro is engineered to filter out retail noise and identify high-probability reversal zones where "Smart Money" is active. By combining multi-timeframe monitoring with a proprietary Quality Scoring System , this tool ensures you only focus on the setups t
Created by trader and journalist Larry Williams, Setup 9.1 is a simple strategy that is easy to understand and execute, which is why it is so well known and popular in the world of traders and technical analysis. It is a REVERSION setup, where operations are sought when the moving average changes direction. Setup Logic With the open candlestick chart, at any time chart, it is only necessary to add the 9-period Exponential Moving Average (MME9). That done, we look for assets in which the MME9
“Voglio verificare la direzione del trend sui timeframe superiori, ma cambiare continuamente il timeframe del grafico è fastidioso…” Per te esiste questo prodotto!! Trend Map Panoramica del prodotto Questo strumento registra la direzione del trend in ogni timeframe (o in ogni struttura frattale) e la visualizza sempre sul grafico. Anche se cambi il timeframe, il pannello resta visibile, ideale per chi guarda spesso il grafico cambiando timeframe. Puoi così verificare rapidamente la direzione del
N/B: All our product purchase comes with our free ‘’DAILY   SCALPER EA’’ -   bit.ly/4qlFLNh Whatsapp Developer for yours after successful purchase The Holy Grail MotherBar Indicator: Your Ultimate Path to Consistent Trading Profits   The Problem With Every Other Indicator You've Tried Let me guess - you've spent countless hours and hundreds (maybe thousands) of dollars on indicators that promise the world but deliver mediocre results. You've tried: · Lagging indicators that tell you what
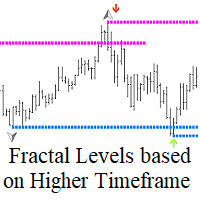
Fractal Levels based on Higher Timeframe è un potente strumento progettato per costruire accurati livelli di supporto e resistenza basati sui frattali del timeframe superiore, che fornisce segnali di acquisto e vendita con comodi avvisi. Come funziona: l'indicatore analizza i livelli frattali sul timeframe superiore e li visualizza sul grafico corrente. È possibile regolare facilmente il timeframe superiore nelle proprietà dell'indicatore per ottenere la massima precisione e rilevanza per le p
ZigZag Market Structure Breakout Pro ZigZag Extras Display BreakOut points is a MetaTrader 5 indicator for traders who use ZigZag, breakout points, market structure, BOS, CHoCH, swing high, swing low, support and resistance, and higher timeframe bias in their trading analysis. Main Benefits Displays confirmed ZigZag swing highs and swing lows Marks BOS Up, BOS Down, CHoCH Up and CHoCH Down Shows Depth Highest High and Depth Lowest Low lines Adds HH, HL, LH and LL structure labels Includes HTF bi
Delivery State Change Map
Martin Alberto Nunez Da Silveira Van Caester
CISD Delivery Map displays Change in State of Delivery levels from two configurable timeframes and summarizes whether the active context is aligned or mixed. Main functions - Two configurable timeframes; defaults are M15 and H1. - Bullish and bearish CISD detection. - ATR displacement filter for confirmation. - Configurable search for the delivery origin. - Active-level and broken-level management. - Forward projection of confirmed levels. - Multi-timeframe alignment dashboard. - Optional popu
HTF Open Markers + ICT Silver Bullet Zones — Usage & Strategy Guide What it draws Session 1 / Session 2 lines : vertical lines at the open of every bar on two independently configurable higher timeframes (defaults: H4 and D1), including a projected line for the rest of today's not-yet-opened bars on sub-daily timeframes, so you can see where the next candle will open before it happens. ICT Silver Bullet zones : shaded rectangles over the three classic ICT kill-zone windows, converted from New Yo
FREE
Future Predictor MT5
Shukurjon Beknazarov
PREDICATORE FUTURO - INDICATORE DI PREVISIONE ANALOGICO STORICO PANORAMICA Future Predictor confronta l'andamento dei prezzi più recente con modelli simili del passato e riassume gli eventi successivi. Mostra le probabilità di acquisto, vendita e neutralità, una proiezione del percorso dei prezzi con bande empiriche e l'elenco delle corrispondenze storiche alla base della stima. Tutti i risultati sono stime statistiche basate su dati passati e non garantiscono alcun risultato futuro. COME FU
Atbot
Zaha Feiz
4.69 (55)
AtBot:  Come funziona e come usarlo ### Come funziona L'indicatore "AtBot" per la piattaforma MT5 genera segnali di acquisto e vendita utilizzando una combinazione di strumenti di analisi tecnica. Integra la Media Mobile Semplice (SMA), la Media Mobile Esponenziale (EMA) e l'indice di Gamma Vero Medio (ATR) per identificare opportunità di trading. Inoltre, può utilizzare le candele Heikin Ashi per migliorare la precisione dei segnali. Lascia una recensione dopo l'acquisto e ricevi un regalo bon
Eazy RSI Divergence
Gawain Athur Stephan Cloete
Eazy Divergence is a non-repainting MT5 indicator designed to automatically detect and plot Regular and Hidden divergence signals in real time Key Features Dual-Window Plotting: Displays divergence trendlines and text badges directly on both the main price chart and the RSI subwindow. 100% Non-Repainting: Uses left/right pivot strength confirmation so signals stay fixed once drawn. Full Multi-Timeframe Support: Adapts instantly to whatever chart timeframe you are viewing. Fully Customizable: Eas
Fino a 7 livelli di pivot Fibonacci per lato. Per zone di domanda e offerta classificate con conteggio dei retest: Supply Demand RSJ PRO Pivot Point Fibo RSJ disegna il punto pivot giornaliero e i relativi livelli di supporto e resistenza calcolati con i rapporti di Fibonacci. Traccia fino a 7 livelli di supporto e 7 livelli di resistenza a partire da massimo, minimo e chiusura del giorno precedente. I trader usano questi livelli come aree di riferimento per pianificare entrate, uscite e il posi
FREE
ICT Institutional Zones Pro
Celestine Anyango Wabomba
ICT Institutional Zones Pro — Trade with Institutional Precision Stop wasting time manually drawing key ICT levels every day. ICT Institutional Zones Pro is a professional-grade MT5 indicator built for traders who use ICT (Inner Circle Trader) and Smart Money Concepts (SMC) to read market structure with precision. This indicator automatically maps the most important institutional levels directly on your chart, helping you instantly identify where smart money is likely accumulating, distributing
SPECIAL LAUNCH OFFER: $30 (1-Month Rent) Limited time offer to build our community and gather feedback! AmbM GOLD Institutional Scalper A high-precision M5 algorithm for XAUUSD (Gold) , engineered to trade exclusively at Institutional Liquidity Levels ($5/$10 psychological marks). PERFORMANCE DATA (BUY ONLY) • Win Rate: 87.09%. • Safe Growth: +$4,113 profit on $10k (13.75% Max Drawdown). • Extreme Stress Test: Successfully generated +$22,997 in a 5-year stress test (2020-2026), proving
CleanSMC Lite CleanSMC Lite is a MetaTrader 5 custom indicator designed to help traders analyze market structure using a clean Smart Money Concepts style workflow. The indicator focuses on visual structure mapping, demand and supply zones, fair value gap detection, equal highs and equal lows, and optional BUY/SELL signal arrows. The tool is built for discretionary technical analysis and is intended to support chart reading, not to replace a complete trading plan. It does not execute trades, open
Pivot Points MT5 is a universal color multicurrency/multisymbol indicator of the Pivot Points levels systems. You can select one of its three versions: Standard Old, Standard New and Fibo . It plots pivot levels for financial instruments in a separate window . The system will automatically calculate the Pivot Point on the basis of market data for the previous day ( PERIOD_D1 ) and the system of support and resistance levels, three in each. A user can choose colors for the indicator lines. The on
KT Horizontal Lines MT5
KEENBASE SOFTWARE SOLUTIONS
Su MetaTrader, tracciare più   linee orizzontali   e monitorare i rispettivi livelli di prezzo può essere un’attività noiosa. Questo indicatore disegna automaticamente più linee orizzontali a intervalli uguali per impostare avvisi di prezzo, tracciare livelli di supporto e resistenza, e per altri usi manuali. Questo indicatore è perfetto per i trader Forex alle prime armi che cercano opportunità per ottenere profitti rapidi tramite acquisto e vendita. Le linee orizzontali aiutano a identificare
Trading Discipline Trend Dashboard legge solo lo storico delle operazioni già chiuse del tuo conto e trasforma quattro schemi specifici in un andamento su 7 giorni, così puoi vedere se qualcosa accade una sola volta o si ripete ogni settimana. Non predice e non consiglia nulla. Ogni numero nel pannello è qualcosa che è già successo su questo conto. Come vengono costruiti i numeri: legge fino a 37 giorni di operazioni chiuse su tutti i simboli e tutti i magic number - è una vista dell'intero con
SMC Session Scanner MT5 is a panel indicator for MetaTrader 5 that watches many symbols and timeframes for smart-money structure and session levels. For each symbol and timeframe it shows one of these: a fresh break of structure (BOS), a change of character (CHoCH), or a fresh liquidity sweep. It also shows price inside a live order block or fair value gap. Otherwise it shows the latest break and how long ago it was. A Session column shows the session now. It also shows today's first close beyon
Adaptive Trend Lines
Henri Salvatore Bigatti
4.76 (25)
This indicator shows the TLH and TLL and some trendlines that allow us to estimate the trend of market.  It also shows the values of the angles of the lines in percentage in points (pip) , the standard deviation, and the trend of each line, and when it breaks the lines of support and resistance (TLH and TLL). And finally, it also shows the points identified as supports and resistances through the fractal algorithm in the graph. The high and low trend lines are supported by the highs and lows, th
FREE
Apex Break PRO MT5
Kestutis Balciunas
Apex Break PRO è un indicatore di rottura di linee di tendenza su pivot non ridisegnante per MetaTrader 5. Rileva massimi di pivot e minimi di pivot, traccia linee di tendenza dinamiche inclinate tra pivot consecutivi e genera segnali di acquisto e vendita quando il prezzo rompe quelle linee di tendenza alla chiusura confermata di una candela. Ogni segnale viene filtrato attraverso fino a quattro strati di confluenza indipendenti — tendenza EMA, limiti RSI, rilevamento di picchi di volume e forz
Supreme Power House reads market structure, grades every signal against seven filters and draws a complete trade plan for each one. It prints a BUY or a SELL when a candle closes beyond the latest swing: a change of character (CHoCH) when the break turns the structure, a break of structure (BOS) when it continues it. Each signal comes with an entry, a stop, up to three targets and a grade from A to C, surrounded by an adaptive trend ribbon, ICT zones and a dashboard of six timeframes. Everythin
Gli utenti di questo prodotto hanno anche acquistato
Trend Sniper X
Sarvarbek Abduvoxobov
4.86 (44)
Trend Sniper X è un indicatore trend-following multi-timeframe per MetaTrader 5 che aiuta i trader a identificare la direzione del trend e i potenziali punti di inversione con chiarezza e precisione. per MT4: https://www.mql5.com/en/market/product/193245 Informazioni sul prezzo: Il prezzo attuale è promozionale ed è soggetto a modifiche con il rilascio di futuri aggiornamenti e nuove funzionalità. Offerta Bonus: Per ricevere GRATIS l'Auto-Trade Assistant EA per questo indicatore, invia un messa
Un nuovo Re in città - Indicatore + Gestione ordini (TP1 + TP2 + TP3) + Invio opzionale di segnali Telegram INCLUSO (GRATIS) (SISTEMA COMPLETO DI TRADING e SEGNALI) Il nostro miglior EA per l’Oro: Gold Slayer Questo indicatore include una strategia avanzata, un sistema di trading con gestione ordini personalizzabile e un sistema mean reversion che combina estensioni di envelope, supportato da molteplici filtri intelligenti di conferma come RSI per individuare ingressi di inversione ad alta proba
Smart Trend Trading System — MetaTrader 5 Dopo l'acquisto, inviami un messaggio su MQL5 per ricevere GRATUITAMENTE Smart Universal Expert Advisor, insieme al corso online, al manuale PDF e all'accesso al gruppo privato. STTS riunisce la direzione del trend, i segnali di entrata e uscita, le zone di inversione e i livelli di prezzo importanti direttamente sul grafico. Segui il sistema manualmente oppure collega un EA compatibile separato per eseguire le operazioni automaticamente con le impostazi
Entry Points Pro vi mostra dove entrare, dove mettere lo stop e con quale lotto operare — prima di piazzare l'ordine. PREZZO Ora 149 USD, ed è l'ultima copia a questo prezzo. Dopo il prezzo sale a 199 USD, e il prezzo finale è di 349 USD. Guadagno facendo trading sui mercati e lo dimostro, quindi non ho bisogno di vendere questo indicatore a tutti. È uno strumento per trader che ragionano con la propria testa, non un pulsante magico. La freccia compare alla chiusura della candela e non si ridis
M5 Sniper
MeanFX
5 (4)
Porta il tuo vantaggio nel trading sotto i riflettori! M5 Sniper è un nuovo indicatore di MeanFX. Combina segnali di trading precisi con livelli TP/SL adattivi , creando così le migliori operazioni statistiche possibili! Il prezzo aumenta ogni 5 acquisti, il prossimo prezzo è di 69$ Scrivimi dopo l'acquisto per ricevere consigli/guida e un EA bonus Cosa lo rende diverso? Performance statistica comprovata su Gold XAUUSD ( funziona su quasi ogni asset , concentrandosi sulla padronanza di un singol
SuperScalp Pro
Van Minh Nguyen
4.54 (37)
SuperScalp Pro - Professional Multi-Layer Confluence Scalping System SuperScalp Pro è un indicatore di scalping avanzato che potenzia il Supertrend classico con diversi filtri intelligenti di conferma. Aiuta a individuare opportunità di trading Buy/Sell con una maggiore probabilità di successo, riducendo significativamente i falsi segnali. Le frecce Buy e Sell vengono visualizzate chiaramente direttamente sul grafico, insieme ai livelli di Stop Loss e Take Profit basati sull’ATR, calcolati autom
Gold Trend Coach MT5
Cristhian Alexander Gaibor Cuasquer
4.2 (10)
Gold Trend Coach è un indicatore di trend per l'oro (XAUUSD) su MetaTrader 5 con segnali di acquisto e vendita, stop loss e tre take profit confermati alla chiusura della candela (non ridisegna), un coach che ti guida dall'ingresso fino al TP3, un pannello multi-timeframe e avvisi sul telefono e su Telegram. Pensato per lo scalping su M1 e M5 e l'intraday su M15 nelle sessioni di Londra e New York. BONUS: EA di auto-trading GRATIS per Gold Trend Coach. Scrivimi dopo l'acquisto e ti invio l'EA ch
SMC Intraday Formula
VividMind Digital Solutions
5 (26)
Cominciamo con la verità. Nessun indicatore da solo ti renderà profittevole. Se qualcuno ti dice il contrario, ti sta vendendo un sogno. Qualsiasi indicatore che mostra frecce perfette di acquisto/vendita può essere reso impeccabile — basta ingrandire la giusta sezione della storia e catturare solo i trade vincenti. Noi non lo facciamo.  SMC Intraday Formula è uno strumento. Legge la struttura del mercato per te, identifica le zone a più alta probabilità e ti mostra esattamente come appare la t
Gann Made Easy è un sistema di trading Forex professionale e facile da usare che si basa sui migliori principi del trading utilizzando la teoria di mr. WD Gann. L'indicatore fornisce segnali ACQUISTA e VENDI accurati, inclusi i livelli di Stop Loss e Take Profit. Puoi fare trading anche in movimento utilizzando le notifiche PUSH. CONTATTAMI DOPO L'ACQUISTO PER RICEVERE GRATUITAMENTE LE ISTRUZIONI DI TRADING E OTTIMI INDICATORI EXTRA! Probabilmente hai già sentito parlare molte volte dei metodi d
Ultra Indicator
Ihor Otkydach
5 (1)
ULTRA è un indicatore tecnico che funziona secondo un approccio “tutto in uno”: analizza autonomamente il mercato, genera segnali di trading, visualizza i livelli per l’impostazione degli ordini stop-loss e suggerisce quando chiudere le operazioni per realizzare profitti o ridurre al minimo le perdite. In altre parole, non importa se non sai come analizzare il mercato, determinare i livelli — dove impostare lo stop-loss — o se hai difficoltà con la gestione del capitale. ULTRA farà tutto questo
Boba Analysis Suite
Trade Ready Solutions LLC
5 (2)
Boba Analysis Suite Boba Analysis Suite è un indicatore di analisi per MetaTrader 5. Riunisce la struttura del mercato, le zone di prezzo rilevanti e il contesto generale del mercato in un’unica visualizzazione del grafico. Sviluppato sulla base dell’esperienza pratica come trader e formatore di trading, supporta un processo di analisi strutturato: valutare la direzione del mercato, individuare livelli importanti e analizzare congiuntamente più intervalli temporali. Analisi nel contesto del merc
Prossimo aggiornamento — Versione 2.52 in arrivo! [NOVITÀ] Preparati a 4 nuove funzionalità principali progettate per migliorare la tua analisi di mercato e il tuo flusso di lavoro nel trading Portiamo l’analisi di mercato a un livello superiore con 4 nuove funzionalità progettate per soddisfare le tue esigenze di trading. Ecco le novità: 1. TRADE OVERVIEW DASHBOARD 2. CONFLUENCE AT ZONE 3. STRONG & WEAK HIGH/LOW 4. OTE 1. TRADE OVERVIEW DASHBOARD Una dashboard che ti aiuta a comprendere più fa
M1 Sniper MT5
Oleg Rodin
5 (7)
M1 SNIPER   è un sistema di indicatori di trading facile da usare. Si tratta di un indicatore a freccia progettato per l'intervallo temporale M1. L'indicatore può essere utilizzato come sistema autonomo per lo scalping sull'intervallo temporale M1 e come parte del tuo sistema di trading esistente. Sebbene questo sistema di trading sia stato progettato specificamente per il trading sull'intervallo temporale M1, può comunque essere utilizzato anche con altri intervalli temporali. Inizialmente ho p
FiboSniper Pro
Van Minh Nguyen
5 (4)
FiboSniper Pro – Multi-Filter Fibonacci System with Auto SL/TP and Control Panel FiboSniper Pro è un indicatore tecnico che combina Fibonacci Envelopes dinamici con diversi filtri di conferma per generare segnali Buy e Sell selezionati. I livelli di Fibonacci vengono calcolati sulla base di Moving Average e ATR e successivamente filtrati tramite ADX, EMA, RSI, ATR, Volume, Time e struttura delle candele. L’indicatore visualizza direttamente sul grafico i livelli automatici di Stop Loss e Take Pr
Auto Optimized SpeedAngle è un sistema di vettorizzazione del momento di livello istituzionale che elimina l'overfitting ( curve-fitting ) attraverso l'ottimizzazione continua Walk-Forward (WFO). Invece di affidarsi a input statici che si degradano quando i regimi di mercato cambiano, l'indicatore recalibra dinamicamente i suoi parametri utilizzando la validazione Out-of-Sample (OOS), assicurando che i segnali visualizzati rappresentino reali vantaggi statistici anziché anomalie storiche. Quadro
Adaptive Price Action Engine Acquista un indicatore, ricevi l'EA gratis Analisi Auto-Ottimizzata del Trend e dei Pattern Candlestick Multi-Timeframe I mercati cambiano continuamente e non tutti i pattern di Price Action hanno lo stesso valore in ogni condizione di mercato. Adaptive Price Action Engine è progettato per adattarsi alle condizioni di mercato in continua evoluzione, combinando struttura del trend, analisi Multi-Timeframe, pattern Candlestick e ottimizzazione statistica in un unico fr
Crystal Heikin Ashi Signals
Muhammad Jawad Shabir
5 (5)
Crystal Heikin Ashi Signals—Professional Trend & Signal Detection Indicator Advanced Heikin Ashi Visualization with Intelligent Signal System for Manual & Automated Trading Final Price: $149 ---------> Price goes up $10 after every 10 sales . Limited slots available — act fast . Overview User Guide PDF Crystal Heikin Ashi Signals is a professional-grade MetaTrader 5 indicator that combines pure Heikin Ashi candle visualization with an advanced momentum-shift detection system. Designed for both m
Scalper Vault è un sistema di trading potente e completo, progettato per i trader che desiderano ottenere risultati costanti nel trading intraday. Questo indicatore ad alta precisione funge da sistema di trading autonomo, offrendo analisi di livello istituzionale sia per il mercato Forex che per le Opzioni Binarie. CONTATTAMI DOPO L'ACQUISTO PER RICEVERE I MIEI CONSIGLI DI TRADING E UN FANTASTICO BONUS! Eliminando le congetture e le complesse analisi manuali, Scalper Vault ti permette di concen
Trend Catcher ind mt5
Ramil Minniakhmetov
5 (18)
INDICATORE TREND CATCHER L'indicatore Trend Catcher analizza i movimenti dei prezzi di mercato, utilizzando una combinazione di indicatori di analisi del trend proprietari dell'autore e personalizzati. Identifica la vera direzione del mercato filtrando il rumore a breve termine e concentrandosi sulla forza del momentum sottostante, sull'espansione della volatilità e sul comportamento della struttura dei prezzi. Utilizza inoltre una combinazione di indicatori personalizzati di smoothing e filtr
Atomic Analyst MT5
Issam Kassas
4.5 (64)
Atomic Analyst — MetaTrader 5 Dopo l'acquisto, inviami un messaggio su MQL5 per ricevere GRATUITAMENTE Smart Universal Expert Advisor, insieme al corso online, al manuale PDF e all'accesso al gruppo privato. Atomic Analyst riunisce l’azione del prezzo, la direzione del trend, i segnali di entrata e uscita, lo Stop Loss e diversi livelli di Take Profit direttamente sul grafico. INDIVIDUA IL SEGNALE. COMPRENDI IL CONTESTO OPERATIVO. Atomic Analyst organizza la sua analisi in informazioni visive ch
Unix Scalper
Issam Kassas
4 (4)
Unix Scalper — MetaTrader 5 Dopo l'acquisto, inviami un messaggio su MQL5 per ricevere GRATUITAMENTE Smart Universal Expert Advisor, insieme al corso online, al manuale PDF e all'accesso al gruppo privato. Individua il setup. Esamina il piano. Scegli come operare. UNIX Scalper riunisce analisi di mercato, indicazioni BUY/SELL/WAIT e livelli Entry, Stop Loss, TP1 e TP2 in un unico pannello organizzato. VISUALIZZA IL SEGNALE E IL PIANO • Indicazioni chiare: BUY, SELL o WAIT. • Livelli definiti: E
SIO Oscillator: oscillatore auto-ottimizzante dello squilibrio di semivarianza Acquista l’indicatore e ricevi GRATIS l’Expert Advisor (EA) basato su di esso. La maggior parte degli oscillatori tratta ogni movimento di prezzo allo stesso modo. SIO separa la pressione rialzista da quella ribassista e misura lo squilibrio tra le due, mostrando quale parte controlla davvero il mercato: compratori o venditori. Quando lo squilibrio raggiunge un estremo, SIO genera un segnale chiaro con livelli di ingr
Volatility Master for MetaTrader is a real-time dashboard tool that scans up to  50 symbols  to identify high-volatility , trending markets instantly. With bullish/bearish signals, customizable alerts, and a user-friendly interface, it helps you avoid range-bound conditions and focus on high-probability trades. Clarity leads to confidence. Trade confidently and protect your capital effectively with this powerful dashboard. We don't offer free or bonus indicators in exchange of reviews from you.
Smc Pro ToolKit
Talal N Z Aljarusha
5 (14)
SMC PRO TOOLKIT — SMART MONEY ANALYSIS & STRUCTURED TRADE PLANNING SMC Pro ToolKit is a professional Smart Money Concepts analysis workspace for MetaTrader 5. It combines market structure, multi-timeframe analysis, institutional price zones, setup evaluation, confirmation tools, volume context, alerts, and risk planning inside one organized chart environment. One workspace. Multiple layers of confirmation. One structured trading plan. OPEN COMPLETE USER GUIDE MULTI-CONDITION SETUP ENGINE At
Indicatore multi-valuta di forza e momentum MT5 Dynamic Forex28 Navigator è l'evoluzione dei nostri indicatori popolari da lunga data, che riunisce la potenza di cinque in uno: Advanced Currency Strength28 Indicator (700 recensioni) Advanced Currency IMPULSE with ALERT (530 recensioni) Currency Strength EXOTICS GOLD Impulse with Alert CS28 Combo Signals (bonus attuale) Non serve acquistare quattro indicatori e impilarli sui grafici. Tutto è riunito in un solo indicatore potente: la forza delle 2
AriFocus
Temirlan Kdyrkhan
AriFocus - Non-Repainting Buy/Sell Signals AriFocus - one clear signal. AriFocus marks buy and sell signals directly on the chart and suggests a stop-loss level for each one. Every signal is confirmed on bar close and never repaints. - Buy/sell arrows, confirmed on bar close - Suggested stop-loss level for every signal - Trend band and candle coloring to show direction at a glance - 10 ready-made presets, or your own settings (14 calculation methods) - Pop-up, push and email alerts with entr
Neuro Poseidon MT5
Daria Rezueva
4.68 (53)
Neuro Poseidon is a new indicator by Daria Rezueva. It combines precise trading signals with adaptive TP/SL levels - creating best possible trades as a result! Message me and get  Neuro Poseidon Assistant  as a gift to automize your trading process! What makes it stand out? 1. Proven profitability on all assets and timeframes 2. Only confirmed BUY and SELL signals present on the chart 3. Adaptive TP & SL levels generated by the software for each trade 4. Easy to understand - suitable for al
PZ Swing Trading MT5
PZ TRADING SLU
5 (5)
Protect against whipsaws: revolutionize your swing trading approach Swing Trading is the first indicator designed to detect swings in the direction of the trend and possible reversal swings. It uses the baseline swing trading approach, widely described in trading literature. The indicator studies several price and time vectors to track the aggregate trend direction and detects situations in which the market is oversold or overbought and ready to correct. [ Installation Guide | Update Guide | Tro
Azimuth Pro
Ottaviano De Cicco
5 (7)
Azimuth Pro V2: Synthetic Fractal Structure and Confirmed Entries for MT5 Overview Azimuth Pro is a multi-level swing structure indicator by Merkava Labs . Four nested swing layers, swing-anchored VWAP, ABC pattern detection, three-timeframe structural filtering, and closed-bar confirmed entries — one chart, one workflow from micro-swings to macro-cycles. This is not a blind signal product. It is a structure-first workflow for traders who care about location, context, and timing. Halloween P
SkyHammer Signal Pro Indicatore professionale di segnali trend no-repaint con livelli Entry, SL e TP bloccati SkyHammer Signal Pro è un indicatore strutturato di trend e momentum, progettato per trader che desiderano segnali chiari, fissi e verificabili. Funziona al meglio su timeframe bassi, come M1 e M5 . L’indicatore non cerca di prevedere massimi o minimi del mercato. Attende invece una struttura di mercato confermata, una chiara direzione del trend, forza del momentum, volatilità sana e spa
Altri dall’autore
Chart Pattern Navigator MT5
Alexis Jean Francois Gemehl
Chart Pattern Navigator MT5 Overview Chart Pattern Navigator MT5 is a technical analysis indicator designed to automatically detect, classify and visualize classic chart patterns directly on your MetaTrader 5 charts. It helps traders identify potential market structures, monitor pattern development and evaluate possible trading scenarios without having to draw every formation manually. The indicator combines pattern recognition, configurable breakout and retest logic, projected entry levels, st
Filtro:
Nessuna recensione
Rispondi alla recensione