VWAP Sentinel MT4
- Indicators
- Version: 1.30
- Updated: 7 November 2026
- Activations: 5

VWAP Sentinel is a comprehensive VWAP analysis system, combining multiple VWAP calculation layers, persistent historical VWAP levels, deviation analysis and a dynamic multi-symbol VWAP Matrix into one integrated trading tool.
This is more than a conventional VWAP indicator. VWAP Sentinel introduces a multi-core calculation structure that preserves previous VWAP references and their deviation levels, keeping them visible on the chart until price reaches them.
By combining current and historical VWAP calculations with dynamic multi-symbol analysis, VWAP Sentinel provides a broader perspective on market positioning, structure and price behaviour.
Key Features
-
Multi-Core VWAP Engine – Multiple VWAP calculation layers with independently maintained VWAP references and historical levels.
-
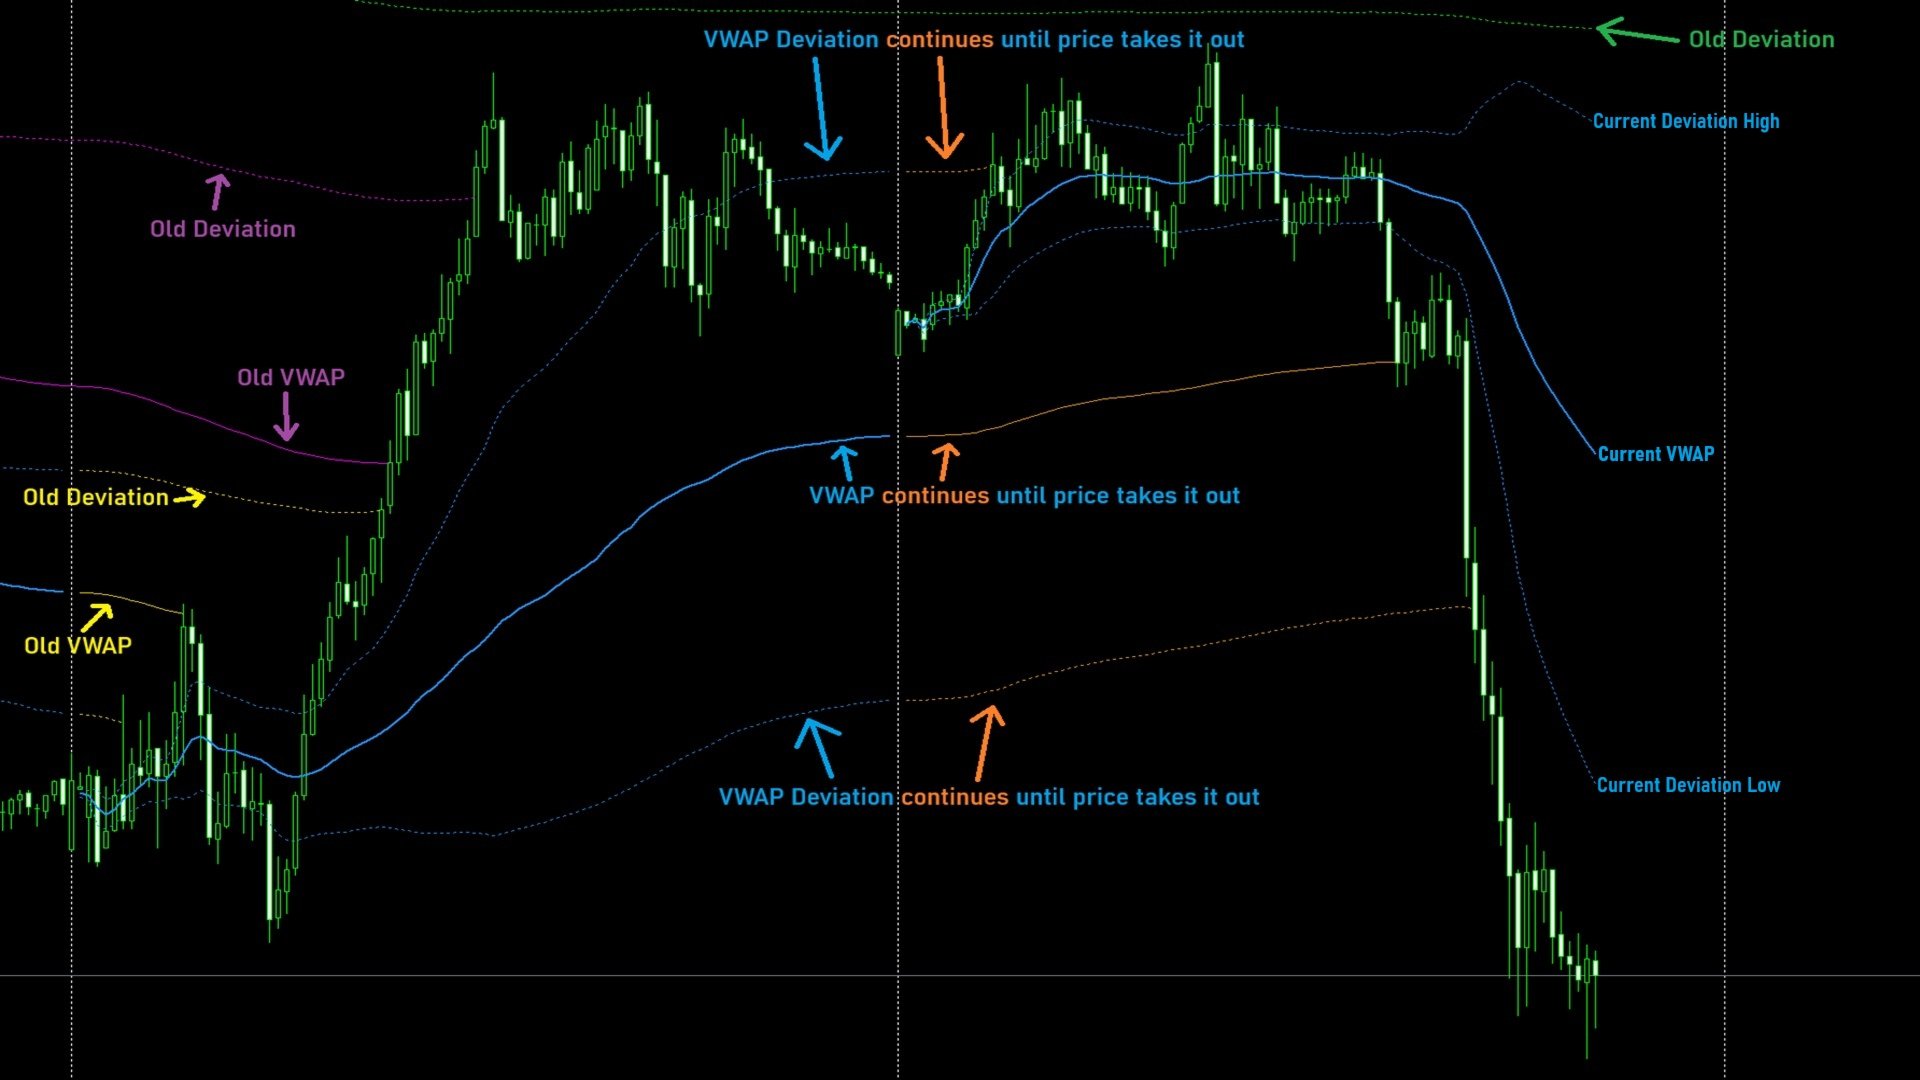
Persistent VWAP Hangar System – Previous VWAP calculations and their deviation bands remain on the chart until price touches them, rather than disappearing when a new calculation period begins.
-
Multi-Timeframe Calculation – Select your VWAP anchoring period according to your trading approach: M15, M30, H1, H4, Daily, Weekly, Monthly or Yearly.
-
Historical VWAP Levels – Display up to eight previous calculation periods, each maintaining its own VWAP and deviation levels.
-
Deviation Analysis – VWAP deviation bands provide additional information about price extension, market positioning and potential areas of interest.
-
Dynamic VWAP Matrix – A multi-symbol analysis panel that evaluates price direction and distance relative to VWAP and its deviation boundaries.
-
Interactive Symbol Selection – Switch directly between market symbols from the Matrix without manually navigating Market Watch.
Understanding VWAP and Market Positioning
VWAP (Volume Weighted Average Price) provides a volume-weighted reference for evaluating where price is trading in relation to its average transaction price.
The relationship between price, VWAP and its deviation levels can help traders evaluate directional positioning, market strength, price extension and potential trading opportunities.
A basic approach to interpreting VWAP:
Bullish Market Context
-
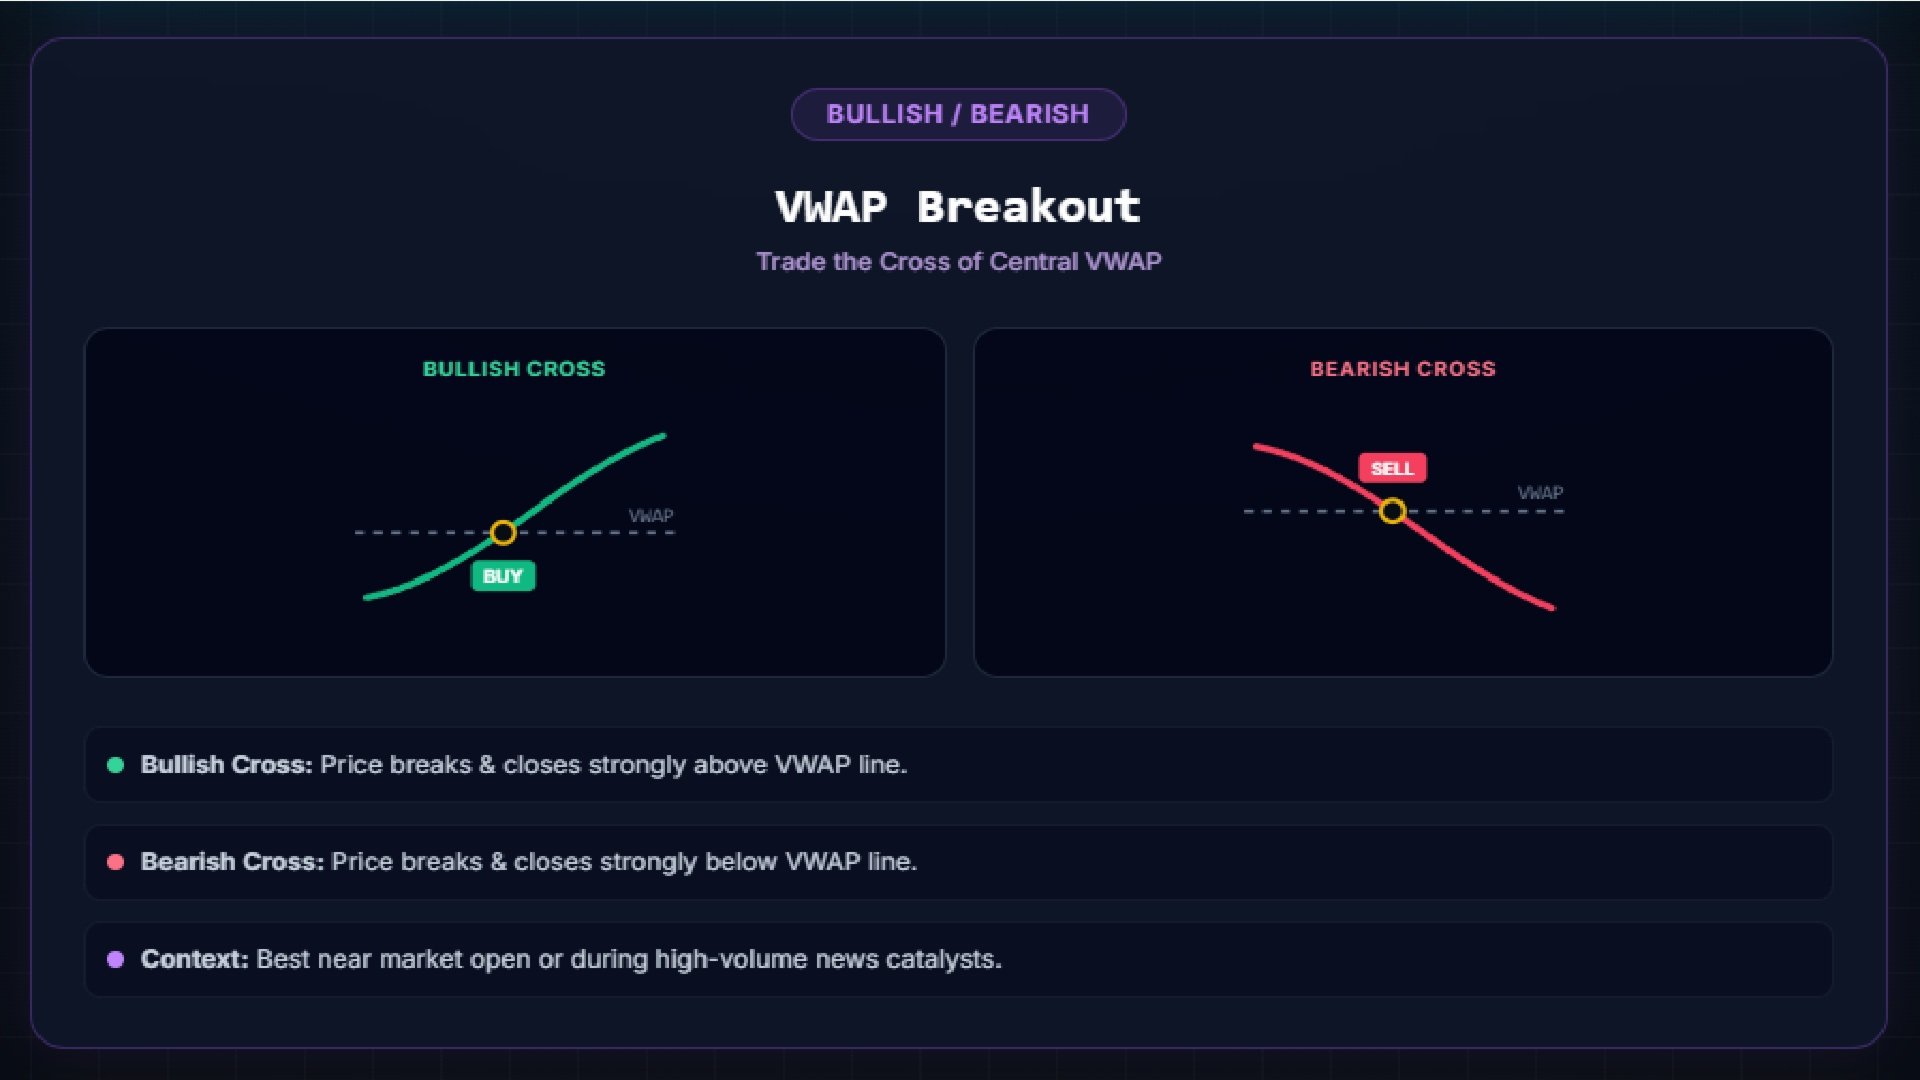
Price trading above VWAP indicates positive positioning relative to the volume-weighted reference.
-
Price moving further away from VWAP towards Deviation High indicates increasing upside extension.
-
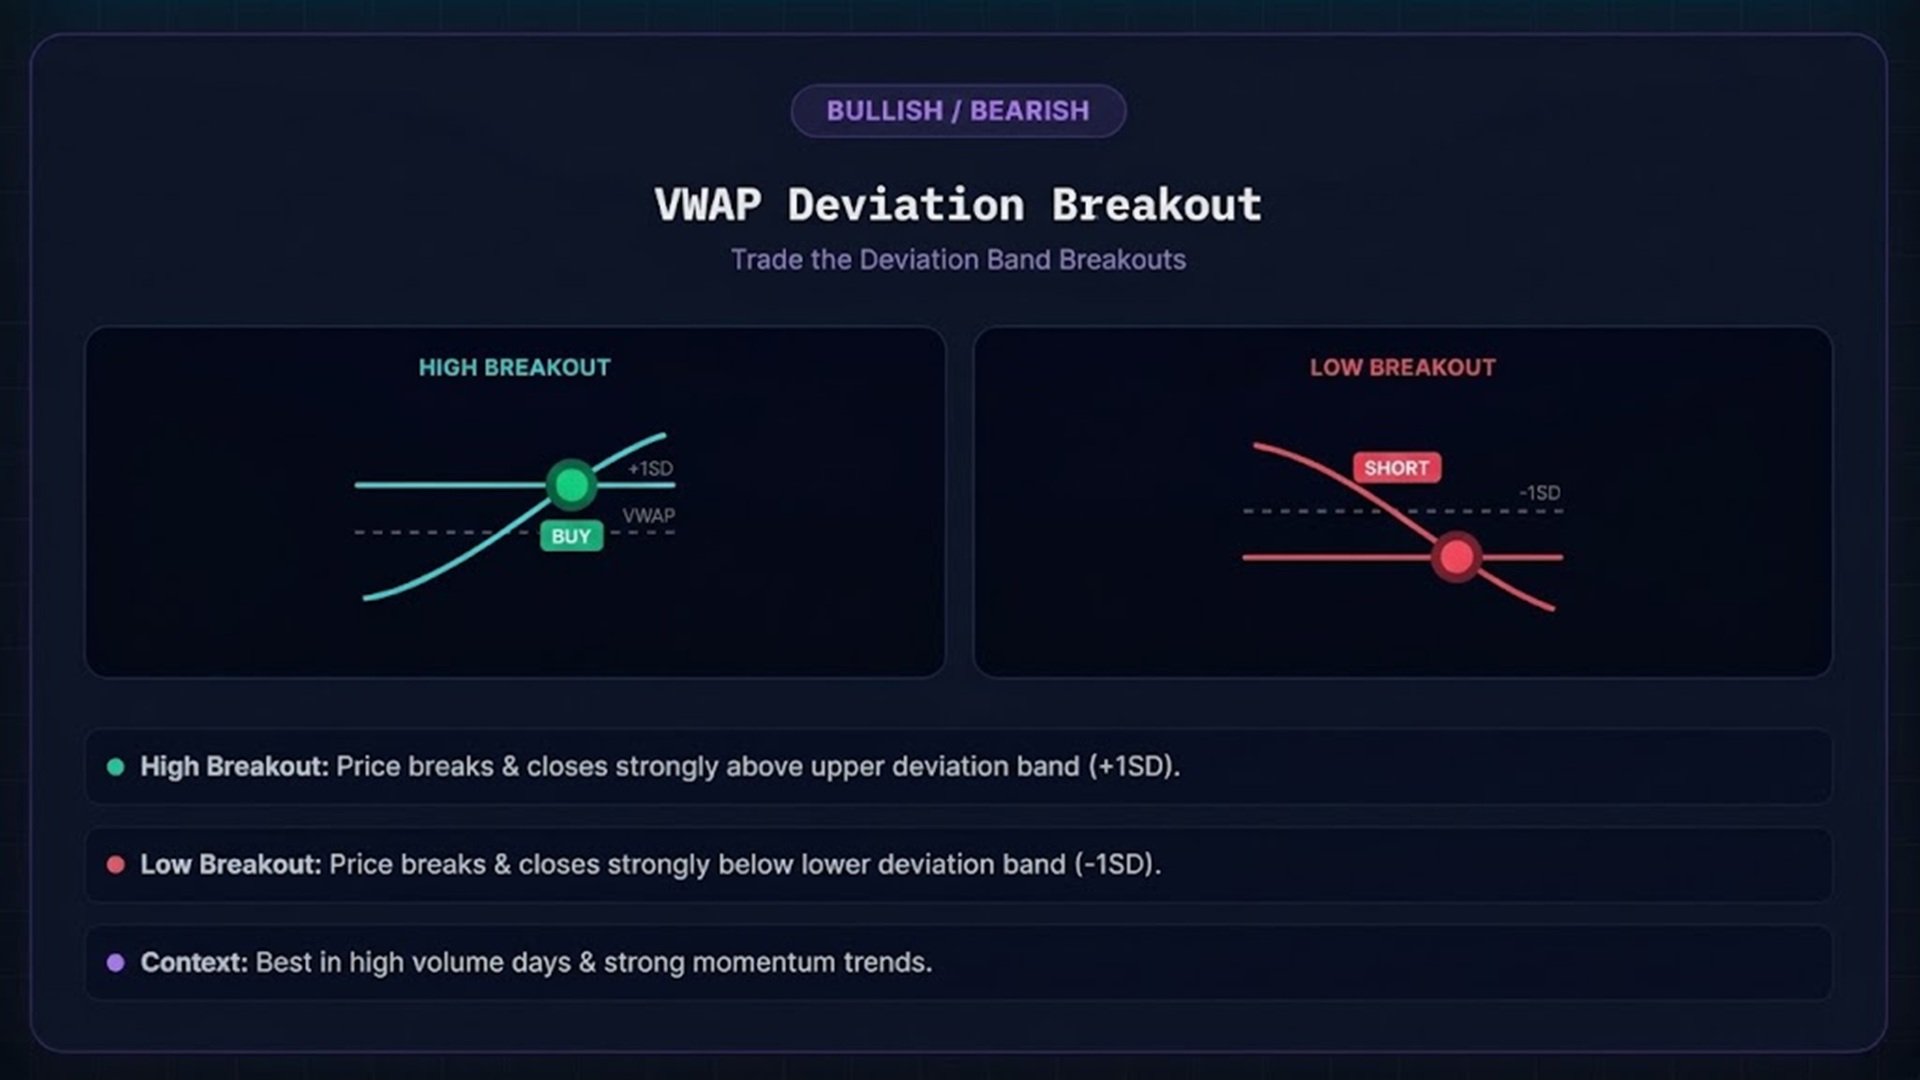
Price trading above Deviation High indicates that price has moved beyond the upper deviation boundary, highlighting stronger upside positioning.
Bearish Market Context
-
Price trading below VWAP indicates negative positioning relative to the volume-weighted reference.
-
Price moving further away from VWAP towards Deviation Low indicates increasing downside extension.
-
Price trading below Deviation Low indicates that price has moved beyond the lower deviation boundary, highlighting stronger downside positioning.
VWAP also provides a useful reference for evaluating mean-reversion conditions, potential reactions around the VWAP level and possible returns towards the volume-weighted average after significant price extensions.
These observations provide analytical context rather than standalone trading signals.
The VWAP Hangar System – Persistent Historical References
One of the defining characteristics of VWAP Sentinel is its persistent VWAP Hangar system.
In conventional VWAP implementations, previous calculations are typically replaced or reset when a new anchoring period begins.
VWAP Sentinel takes a different approach.
When a new calculation period begins, previous VWAP references and their deviation levels remain on the chart. Instead of being automatically removed, they continue to provide historical reference points until price reaches them.
This creates an evolving collection of volume-weighted reference levels that remain part of the current market structure.
Why does this matter?
-
Market Context: See where previous VWAP calculations are positioned relative to current price.
-
Potential Price Targets: Identify outstanding historical VWAP levels that price may revisit.
-
Swing Structure Analysis: Use historical VWAP references as additional structural points when evaluating market swings.
-
Price Reactions: Observe how price interacts with previously established VWAP and deviation levels.
-
Market Extension: Evaluate how far price has moved from earlier volume-weighted reference points.
Rather than treating every new VWAP period as an isolated calculation, the Hangar system allows historical VWAP information to remain relevant to the current market picture.
VWAP Matrix – Dynamic Multi-Symbol Analysis
VWAP Sentinel includes a dedicated VWAP Matrix that provides a visual overview of how multiple market symbols are positioned relative to their respective VWAP calculations.
Unlike a conventional directional matrix that simply identifies whether price is bullish or bearish, the VWAP Matrix uses dynamic colour intensity to visualize the distance and direction of price relative to VWAP.
This makes it possible to assess market positioning across multiple symbols at a glance.
How to Read the Matrix
Neutral – Near VWAP
When price is trading close to VWAP, the Matrix cell maintains a neutral, dark appearance without directional colour emphasis.
This indicates that price remains relatively close to its volume-weighted reference.
Bullish – Above VWAP
As price moves progressively further above VWAP, the Matrix cell transitions from dark blue to increasingly brighter blue.
The increasing colour intensity represents increasing distance from VWAP.
When price moves above Deviation High, the cell border turns bright green, highlighting that price has crossed the upper deviation boundary.
Bearish – Below VWAP
As price moves progressively further below VWAP, the Matrix cell transitions from dark red to increasingly brighter red.
The increasing colour intensity represents increasing downside distance from VWAP.
When price moves below Deviation Low, the cell border turns light pink, highlighting that price has crossed the lower deviation boundary.
Matrix Colour Guide
-
Neutral Dark Background – Price trading near VWAP.
-
Dark to Bright Blue – Increasing distance above VWAP.
-
Bright Green Border – Price above Deviation High.
-
Dark to Bright Red – Increasing distance below VWAP.
-
Light Pink Border – Price below Deviation Low.
The Matrix updates dynamically, providing an immediate visual overview of VWAP positioning across the available symbols in Market Watch.
A Complete VWAP Analysis Framework
VWAP Sentinel brings several complementary analytical components together in one integrated system:
-
Current VWAP Positioning – Evaluate price relative to its active volume-weighted reference.
-
Persistent Historical References – Keep previous VWAP calculations and deviation levels available until price reaches them.
-
Deviation-Based Analysis – Identify price extension beyond established VWAP reference levels.
-
Market Structure Context – Use historical VWAP levels as additional references when evaluating swings, reactions and potential targets.
-
Multi-Symbol Overview – Monitor VWAP positioning and directional distance across multiple instruments through the dedicated Matrix.
The result is a more comprehensive approach to VWAP analysis, allowing traders to evaluate not only where price is trading now, but also how current price relates to previous volume-weighted calculations.
VWAP Sentinel – More than VWAP. A complete multi-core VWAP analysis system.