GDformerVertexFinder
- Indicators
- Version: 1.0
- Activations: 5

Purpose of the Indicator
AdaptiveATR_ZigZag_BB_GDformer_Predictor is an analytical indicator for MetaTrader 5 that combines classical wave analysis (ATR-based ZigZag) with adaptive Bollinger Bands and a proprietary forecasting technology called GDformer (Graph Decomposition Transformer). The indicator does not perform any trading operations on its own — it is designed for visual analysis of market structure and preliminary marking of future price reversal points. Its main task is to show the trader where the next "leg" of the zigzag is most likely to form, and to pre-mark the assumed levels of future peaks and troughs.
The indicator runs in a separate chart window, draws a ZigZag line with an adaptive multiplier, builds Bollinger Bands around the last confirmed point, displays a market status panel, and plots GDformer forecast arrows on the chart with the type of expected extremum (peak or trough), the projected price, and the model's confidence level.
GDformer Technology Strategy
GDformer is a simplified implementation of the graph transformer concept, adapted for the task of predicting reversal points in a price series. The technology works as follows.
First, the indicator builds a feature sequence from the last N bars (100 by default). Each bar is described by four normalized characteristics: the difference between open and close, the position of the high relative to the close, the position of the low relative to the close, and the candle direction. All values are normalized by the bar's range, which makes the features comparable across any timeframe and any instrument.
Next, graph decomposition of the signal is performed. Each feature is decomposed into three components: trend, seasonal, and volatility. The trend component reflects directional movement, the seasonal component reflects cyclical oscillations, and the volatility component reflects the amplitude of market fluctuations. This allows the model to analyze separately "where the market is going" and "how strongly it is fluctuating."
After decomposition, an attention mechanism is applied. Each point in the sequence receives a weight based on its similarity to other points — the model looks for repeating patterns and amplifies those parts of history that resemble the current situation. To avoid excessive computational load, the attention window is limited to 20 neighboring points around each bar.
Based on the weighted sequence, GDformer identifies local extrema in the attention space and estimates the typical interval between them. This interval is used to calculate how many bars ahead the next reversal point is most likely to form.
The final stage is forecast generation. The indicator takes the last confirmed ZigZag extremum as the base and projects an amplitude equal to the product of ATR and an adaptive coefficient. The type of expected extremum is determined automatically: if the last confirmed extremum was a peak, a trough is expected, and vice versa. The direction of the projected amplitude corresponds to the type of the predicted extremum: for a peak, price moves up from the base; for a trough, price moves down. This is exactly what ensures the visual correspondence between the forecast and the last formed zigzag leg, as clearly seen in the attached screenshot.
How It Looks on the Chart
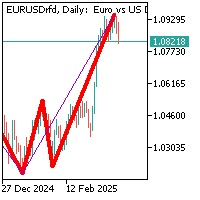
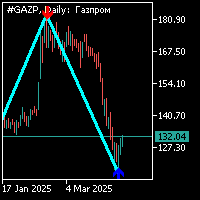
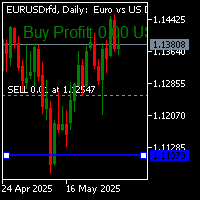
The screenshot shows the ZigZag markup, the Bollinger Band channel around the last confirmed point, green and red labels with numbers (these are the pips traveled between extrema), and GDformer arrows labeled SELL and BUY, indicating the assumed future peaks and troughs. The panel on the left shows the current state: direction, ATR value in pips, adaptive multiplier, last completed wave, signal, and GDformer forecast parameters. The forecast SELL arrow is placed opposite the last formed zigzag leg, which confirms the correct operation of the fixed direction.
Instruments for Trading
The indicator is not tied to a specific asset class and works on any instrument with sufficient bar history. The best results are observed in the following categories.
Major currency pairs with high liquidity: EURUSD, GBPUSD, USDJPY, AUDUSD, USDCAD, NZDUSD, USDCHF. These instruments have stable volatility and a well-defined wave structure, which is important for ZigZag and GDformer.
Cross rates: EURJPY, GBPJPY, EURGBP, AUDJPY, EURAUD. They provide wider amplitudes, which makes the zigzag markup more visually clear.
Metals: XAUUSD (gold), XAGUSD (silver). Their high volatility makes them attractive, but requires increasing the AtrPeriod parameter and the BbMultiplier.
Cryptocurrencies: BTCUSD, ETHUSD. They work, but require parameter tuning due to round-the-clock trading and sharp moves.
It is not recommended to use the indicator on low-liquidity exotic pairs and instruments with a small amount of historical bars, since GDformer requires at least 20 bars to form a forecast, and about 100 bars for stable operation.
Advantages of the Strategy
The indicator automatically adapts to market volatility. The multiplier for ZigZag is calculated dynamically based on the current ATR, which allows it to work equally well in both calm and active market phases.
The GDformer forecast is tied to the last confirmed ZigZag extremum, not to an abstract moving average. This makes the markup intuitive — the arrows stand opposite the already formed leg, exactly as the trader expects.
The model accounts not only for direction but also for the typical interval between extrema. This allows it to forecast not only the price but also the time of formation of the next reversal point (the bars_ahead parameter).
The visualization includes the model's confidence levels in percent, which helps the trader filter out weak signals.
The indicator handles timeframe and instrument changes correctly: GDformer weights and forecasts are automatically reset, object caches are cleared, which prevents memory leaks and visual artifacts.
The status panel displays all key information in a compact form, including direction, ATR in pips, adaptive multiplier, statistics of extrema and reversals, and GDformer parameters.
Disadvantages of the Strategy
The indicator is not a trading system and does not provide ready-to-use entry signals. It shows probable future reversal points but does not guarantee their formation. The trader must interpret the markup and make decisions independently.
GDformer is a heuristic model, not a trained neural network. The weights are set analytically and are not optimized on historical data. This means forecasts may be less accurate than those of full-fledged ML models.
The forecast arrows are not redrawn retroactively but may change position when new confirmed ZigZag extrema appear. This is normal behavior but requires understanding on the trader's side.
During sharp news moves and periods of abnormal volatility, forecast accuracy decreases, since the model relies on the statistics of previous oscillations.
The indicator is demanding on computational resources on weak machines with a large amount of bar history, although optimizations (attention window, calling GDformer only on a new bar) significantly reduce the load.
GDformer parameters (sequence length, horizon, confidence threshold) require tuning for a specific instrument and timeframe. There are no universal values that work equally well everywhere.
Usage Recommendations
The indicator is best suited for medium-term and intraday trading on timeframes from M15 to H4. On M1 and M5, GDformer forecasts are too sensitive to noise; on D1 and higher, they are too inert.
Optimal scenario: use GDformer as a tool for preliminary markup, and make decisions based on confirmation from other tools — support and resistance levels, candlestick patterns, divergences, volumes.
GDformer arrows with confidence above 60 percent deserve more attention than weak signals. The confidence threshold can be adjusted via the GDformerConfidenceThreshold parameter.
The Bollinger Band channel around the last ZigZag point is convenient to use as a dynamic zone of a potential reversal: touching the upper band when a peak is expected, or the lower band when a trough is expected, can serve as additional confirmation.
When changing the instrument or timeframe, it is recommended to give the indicator 100–200 bars to stabilize its forecasts.