XCycle
- Indicators
- Version: 1.1
- Activations: 5

XCycle - Cycle-Based Trading Indicator for MT5
General Description
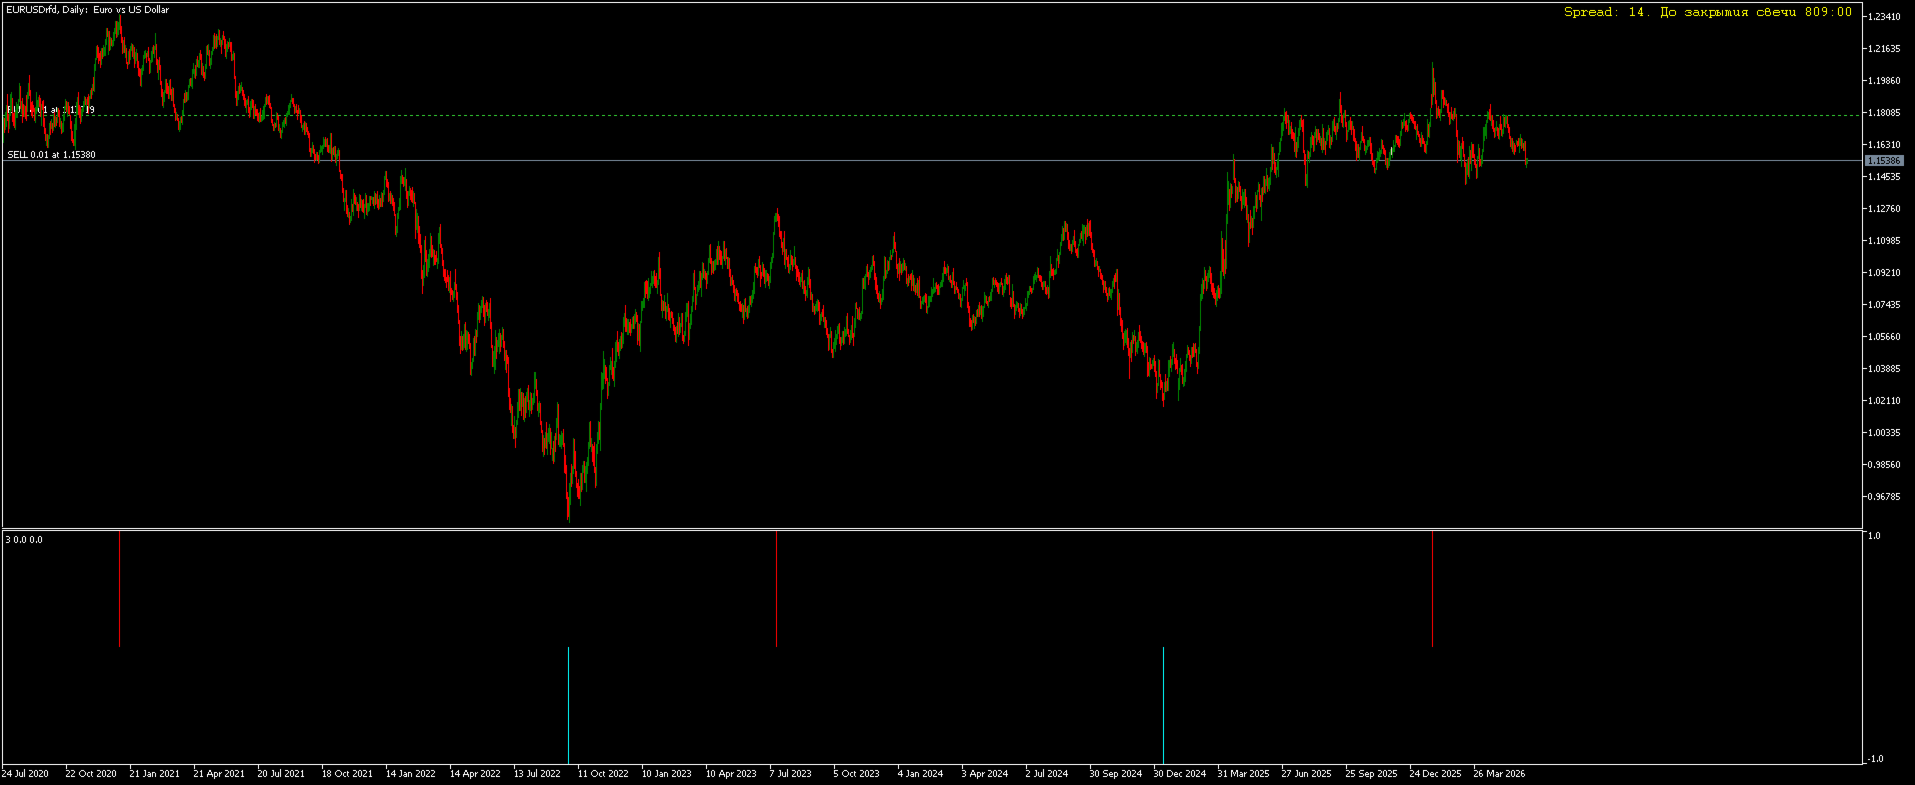
XCycle is a professional technical analysis indicator based on market cycle theory. The indicator detects minor (short-term) and major (long-term) market cycles, generating buy and sell signals while considering the current trend and market volatility.
Application Areas
Markets:
- Forex - all major, cross, and exotic currency pairs
- Cryptocurrencies - Bitcoin, Ethereum, altcoins (BTC/USD, ETH/USD, etc.)
- Indices - S&P 500, DAX, NASDAQ, and others
- Commodities - gold (XAU/USD), silver, oil (WTI, Brent)
- Stocks - liquid blue-chip securities
Timeframes:
- Scalping: M1, M5, M15
- Intraday trading: M30, H1, H4
- Medium-term trading: D1, W1
- Long-term trading: MN
Recommended Instruments:
- High liquidity: EUR/USD, GBP/USD, USD/JPY, BTC/USD
- Medium volatility: GBP/JPY, AUD/JPY, ETH/USD
- Trending pairs: XAU/USD, oil, indices
Operating Modes
Standalone Use
The indicator can be used as an autonomous trading system:
- Entry signals (UpCycle/DownCycle histograms)
- Cycle reversal identification
- False signal filtering
Combined Use with Other Indicators
XCycle combines excellently with:
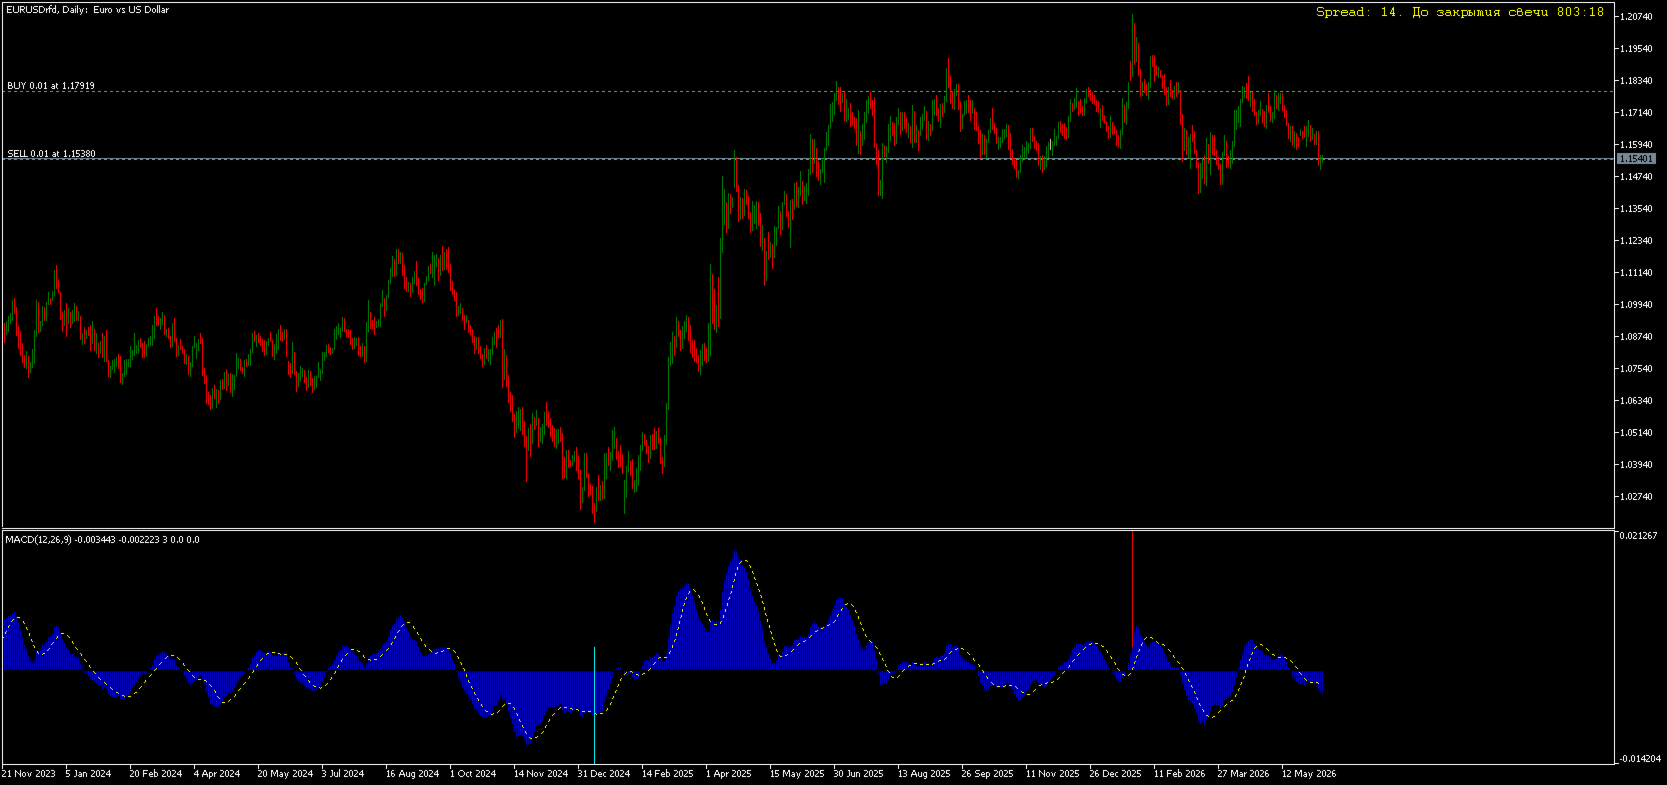
- Trend indicators: Moving Average, MACD, ADX - for trend direction confirmation
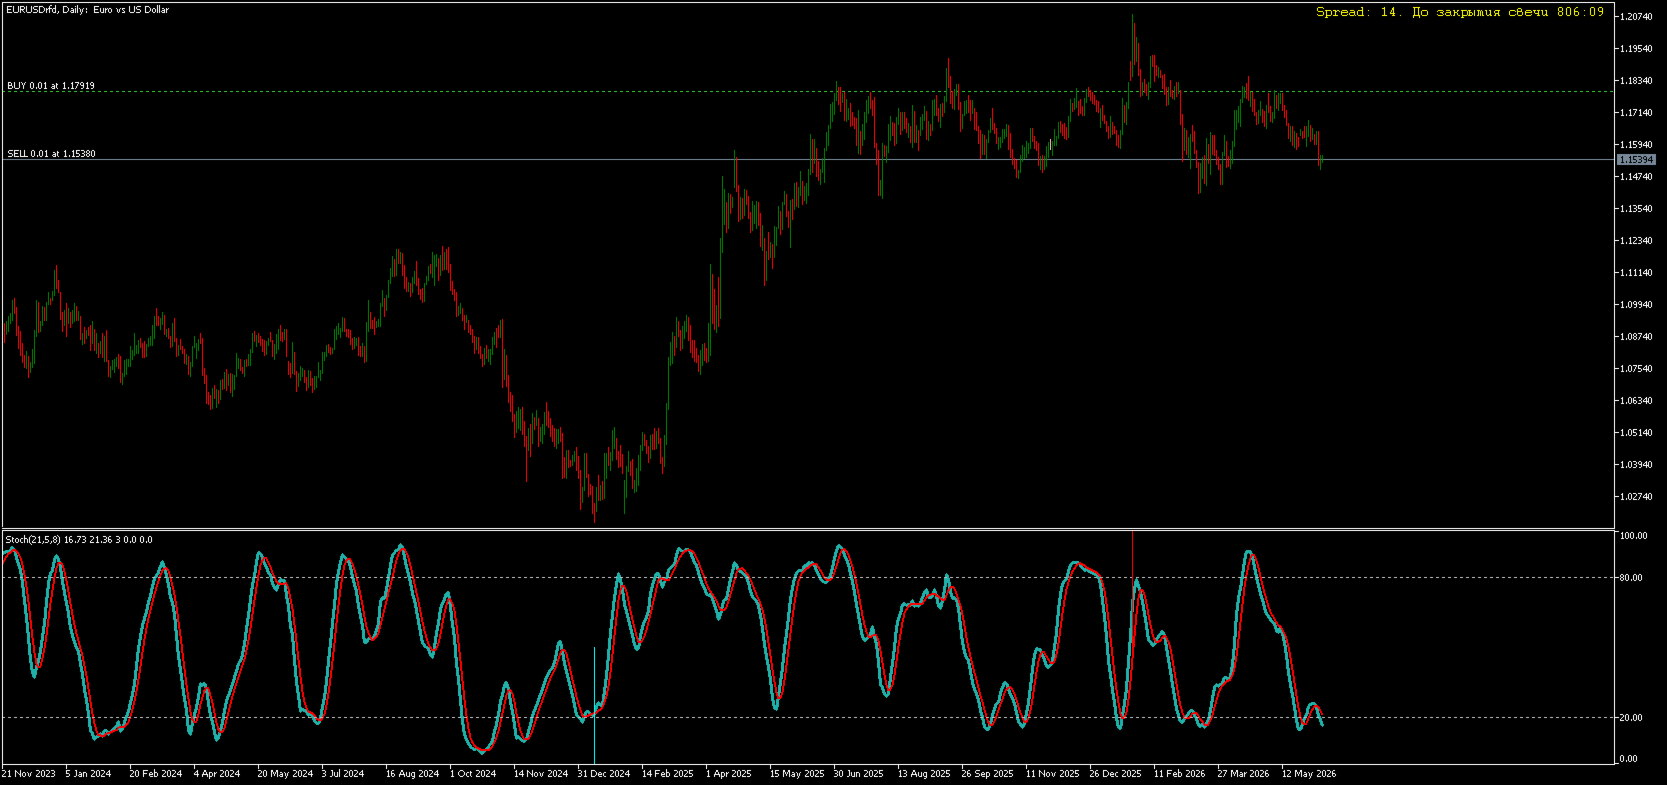
- Oscillators: RSI, Stochastic, CCI - for overbought/oversold conditions
- Support/resistance levels: Pivot Points, Fibonacci
- Volume indicators: OBV, Volume Profile
- Volatility: Bollinger Bands, ATR
Main Features
1. Dual Cycle System
- Minor cycles (Length = 3) - for short-term signals
- Major cycles (MajorCycleStrength = 4) - for long-term trends
2. Flexible Filtering System
- No filter (FILTER_NONE) - pure cycles
- SMA filter (FILTER_SMA) - smoothing via moving average
- RSI filter (FILTER_RSI) - filtering via relative strength index
3. Adaptive Volatility
The indicator automatically adjusts to current market volatility, calculating dynamic thresholds for signals.
4. Visualization
- UpCycle (red) - bullish cycle, buy signal
- DownCycle (aqua) - bearish cycle, sell signal
Advantages
1. Versatility
- Works on any markets and timeframes
- Adapts to different market conditions
2. Minimal Signal Lag
- ZeroLag filter usage reduces lag
- Early cycle reversal detection
3. Noise Filtering
- Eliminates false signals in sideways markets
- Considers volatility for signal quality
4. Flexible Configuration
- 8 adjustable parameters
- Ability to optimize for specific instruments
5. Clarity
- Simple visualization (histogram)
- Clear signals without chart clutter
6. Multifunctionality
- Simultaneous analysis of minor and major cycles
- Built-in trend filtering system
Disadvantages
1. Lag on Strong Trends
- Cycle indicators may give false signals during strong unidirectional movements
- Solution: use with trend indicators (ADX, MA)
2. Requires Configuration
- Default parameters may not suit all instruments
- Solution: conduct optimization on historical data
3. Volatility Sensitivity
- Sharp volatility spikes may cause false triggers
- Solution: use volatility filter (ATR)
4. Does Not Detect Fundamental Reversals
- Does not account for news and macroeconomic events
- Solution: avoid trading during major news releases
5. Requires Confirmation
- Signals need confirmation by other methods for reliability
- Solution: use in combination with Price Action or levels
6. Computational Load
- Volatility calculation over 250 bars may slow down work on weak computers
- Solution: reduce volatility calculation period
Usage Recommendations
Optimal Settings for Different Markets:
Forex (EUR/USD, GBP/USD):
- Length = 3
- MajorCycleStrength = 4
- UseCycleFilter = true
- UseFilterSMAorRSI = FILTER_SMA
- FilterStrengthSMA = 12
Cryptocurrencies (BTC/USD, ETH/USD):
- Length = 5
- MajorCycleStrength = 6
- UseCycleFilter = true
- UseFilterSMAorRSI = FILTER_RSI
- FilterStrengthRSI = 21
Gold (XAU/USD):
- Length = 4
- MajorCycleStrength = 5
- UseCycleFilter = true
- UseFilterSMAorRSI = FILTER_SMA
- FilterStrengthSMA = 21
Trading Strategy:
Buy Entry:
1. Red UpCycle histogram appears
2. Price is above moving average (if filter is enabled)
3. Confirmation from another indicator (RSI > 50, MACD above signal line)
Sell Entry:
1. Aqua DownCycle histogram appears
2. Price is below moving average (if filter is enabled)
3. Confirmation from another indicator (RSI < 50, MACD below signal line)
Exit:
- Appearance of opposite signal
- Achievement of Take Profit target level
- Stop Loss trigger
Important Notes
1. Do not use the indicator in isolation - always confirm signals
2. Test on demo account before live trading
3. Avoid trading during news releases - false signals are possible
4. Regularly optimize parameters for current market conditions
5. Follow risk management - do not risk more than 1-2% of deposit per trade
Conclusion
XCycle is a powerful tool for market cycle analysis that, when used correctly, can significantly improve trading efficiency. Its main strength is revealed in combination with other analysis methods and proper risk management. The indicator is suitable for both beginners and experienced traders willing to invest time in studying its features and configuring it for their trading objectives.
General Description
XCycle is a professional technical analysis indicator based on market cycle theory. The indicator detects minor (short-term) and major (long-term) market cycles, generating buy and sell signals while considering the current trend and market volatility.
Application Areas
Markets:
- Forex - all major, cross, and exotic currency pairs
- Cryptocurrencies - Bitcoin, Ethereum, altcoins (BTC/USD, ETH/USD, etc.)
- Indices - S&P 500, DAX, NASDAQ, and others
- Commodities - gold (XAU/USD), silver, oil (WTI, Brent)
- Stocks - liquid blue-chip securities
Timeframes:
- Scalping: M1, M5, M15
- Intraday trading: M30, H1, H4
- Medium-term trading: D1, W1
- Long-term trading: MN
Recommended Instruments:
- High liquidity: EUR/USD, GBP/USD, USD/JPY, BTC/USD
- Medium volatility: GBP/JPY, AUD/JPY, ETH/USD
- Trending pairs: XAU/USD, oil, indices
Operating Modes
Standalone Use
The indicator can be used as an autonomous trading system:
- Entry signals (UpCycle/DownCycle histograms)
- Cycle reversal identification
- False signal filtering
Combined Use with Other Indicators
XCycle combines excellently with:
- Trend indicators: Moving Average, MACD, ADX - for trend direction confirmation
- Oscillators: RSI, Stochastic, CCI - for overbought/oversold conditions
- Support/resistance levels: Pivot Points, Fibonacci
- Volume indicators: OBV, Volume Profile
- Volatility: Bollinger Bands, ATR
Main Features
1. Dual Cycle System
- Minor cycles (Length = 3) - for short-term signals
- Major cycles (MajorCycleStrength = 4) - for long-term trends
2. Flexible Filtering System
- No filter (FILTER_NONE) - pure cycles
- SMA filter (FILTER_SMA) - smoothing via moving average
- RSI filter (FILTER_RSI) - filtering via relative strength index
3. Adaptive Volatility
The indicator automatically adjusts to current market volatility, calculating dynamic thresholds for signals.
4. Visualization
- UpCycle (red) - bullish cycle, buy signal
- DownCycle (aqua) - bearish cycle, sell signal
Advantages
1. Versatility
- Works on any markets and timeframes
- Adapts to different market conditions
2. Minimal Signal Lag
- ZeroLag filter usage reduces lag
- Early cycle reversal detection
3. Noise Filtering
- Eliminates false signals in sideways markets
- Considers volatility for signal quality
4. Flexible Configuration
- 8 adjustable parameters
- Ability to optimize for specific instruments
5. Clarity
- Simple visualization (histogram)
- Clear signals without chart clutter
6. Multifunctionality
- Simultaneous analysis of minor and major cycles
- Built-in trend filtering system
Disadvantages
1. Lag on Strong Trends
- Cycle indicators may give false signals during strong unidirectional movements
- Solution: use with trend indicators (ADX, MA)
2. Requires Configuration
- Default parameters may not suit all instruments
- Solution: conduct optimization on historical data
3. Volatility Sensitivity
- Sharp volatility spikes may cause false triggers
- Solution: use volatility filter (ATR)
4. Does Not Detect Fundamental Reversals
- Does not account for news and macroeconomic events
- Solution: avoid trading during major news releases
5. Requires Confirmation
- Signals need confirmation by other methods for reliability
- Solution: use in combination with Price Action or levels
6. Computational Load
- Volatility calculation over 250 bars may slow down work on weak computers
- Solution: reduce volatility calculation period
Usage Recommendations
Optimal Settings for Different Markets:
Forex (EUR/USD, GBP/USD):
- Length = 3
- MajorCycleStrength = 4
- UseCycleFilter = true
- UseFilterSMAorRSI = FILTER_SMA
- FilterStrengthSMA = 12
Cryptocurrencies (BTC/USD, ETH/USD):
- Length = 5
- MajorCycleStrength = 6
- UseCycleFilter = true
- UseFilterSMAorRSI = FILTER_RSI
- FilterStrengthRSI = 21
Gold (XAU/USD):
- Length = 4
- MajorCycleStrength = 5
- UseCycleFilter = true
- UseFilterSMAorRSI = FILTER_SMA
- FilterStrengthSMA = 21
Trading Strategy:
Buy Entry:
1. Red UpCycle histogram appears
2. Price is above moving average (if filter is enabled)
3. Confirmation from another indicator (RSI > 50, MACD above signal line)
Sell Entry:
1. Aqua DownCycle histogram appears
2. Price is below moving average (if filter is enabled)
3. Confirmation from another indicator (RSI < 50, MACD below signal line)
Exit:
- Appearance of opposite signal
- Achievement of Take Profit target level
- Stop Loss trigger
Important Notes
1. Do not use the indicator in isolation - always confirm signals
2. Test on demo account before live trading
3. Avoid trading during news releases - false signals are possible
4. Regularly optimize parameters for current market conditions
5. Follow risk management - do not risk more than 1-2% of deposit per trade
Conclusion
XCycle is a powerful tool for market cycle analysis that, when used correctly, can significantly improve trading efficiency. Its main strength is revealed in combination with other analysis methods and proper risk management. The indicator is suitable for both beginners and experienced traders willing to invest time in studying its features and configuring it for their trading objectives.