DailyEndPotential
- Indicators
- Version: 1.28
- Activations: 5

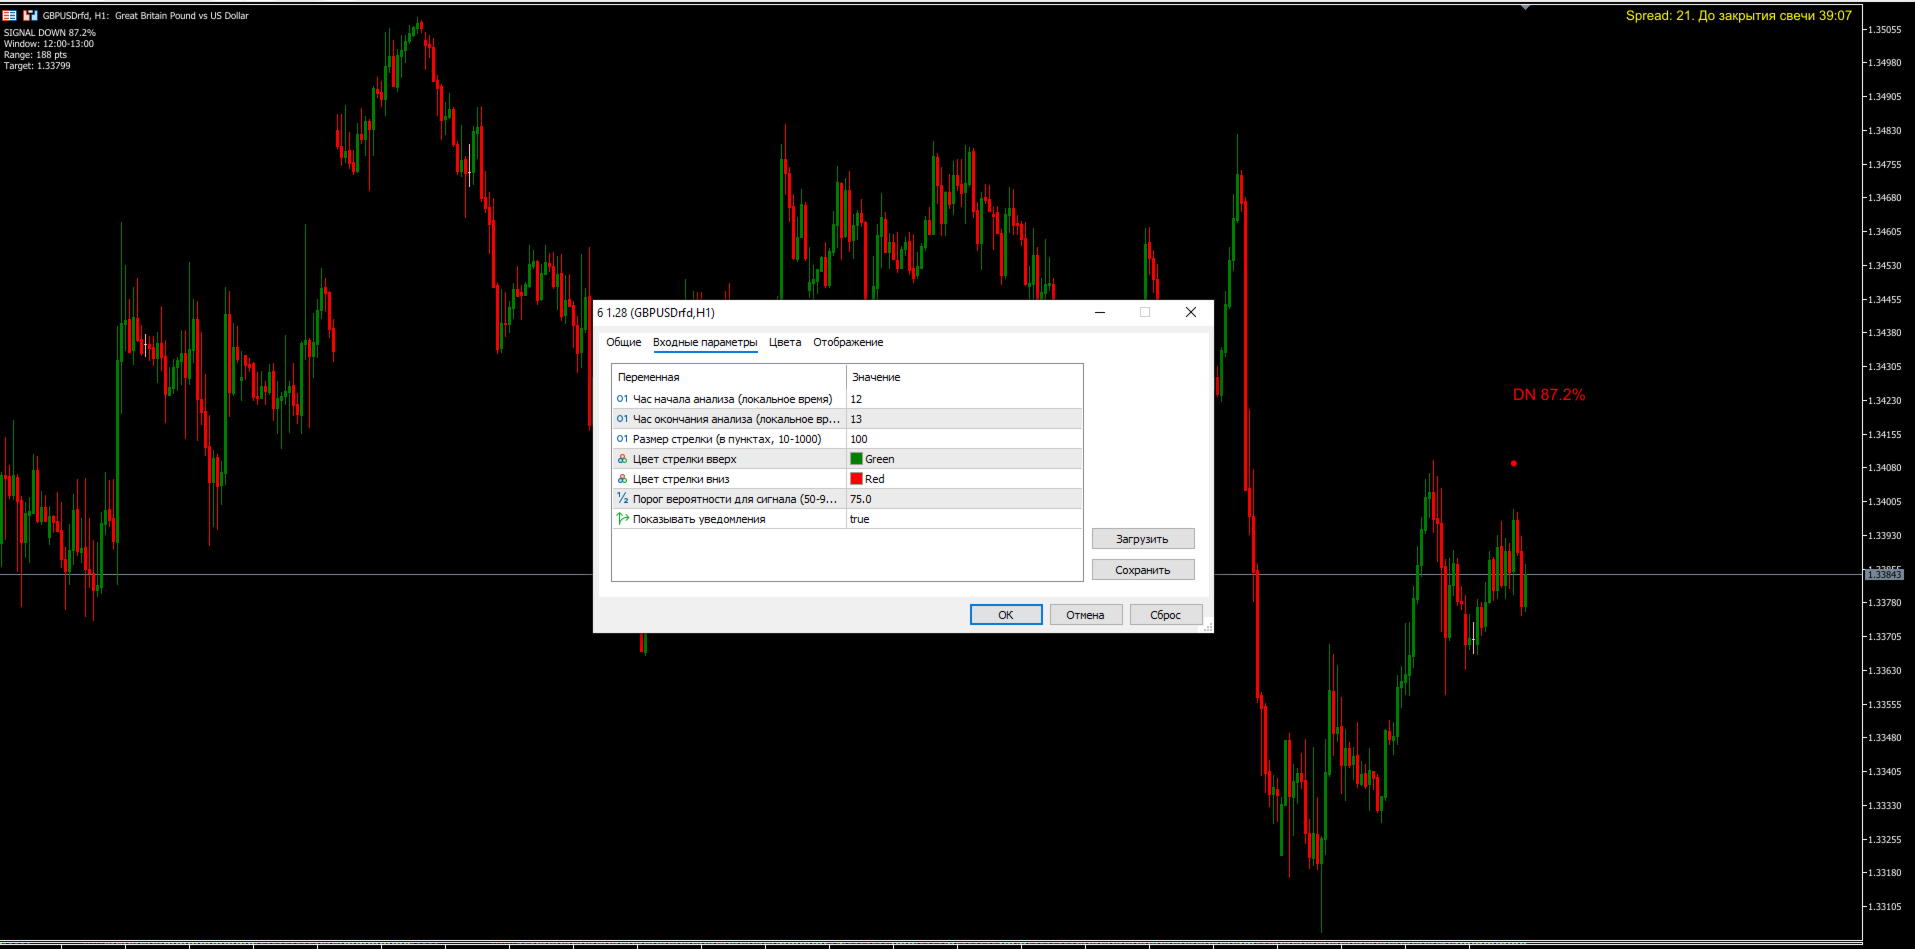
Daily End Potential (DEP) v1.20 is a technical indicator for MetaTrader 5 that analyzes the price range in a specified time window and calculates the probability of price movement up or down until the end of the trading day.
INDICATOR PURPOSE
The indicator helps traders determine the most likely direction of intraday movement after the formation of a key price range. If the price is closer to the upper boundary of the range, the downward movement potential is greater, and vice versa. The indicator calculates this potential as a percentage and issues a signal when the probability exceeds a specified threshold.
HOW IT WORKS
First, the trader sets a time interval (for example, from 12:00 to 13:00) during which the price range is formed. After the analysis window closes, the indicator determines where the current price is relative to the range boundaries. If the probability of movement in one direction exceeds the threshold value (default 75%), the indicator displays an arrow on the chart and issues a notification indicating the target level.
APPLICABLE MARKETS AND INSTRUMENTS
The indicator is suitable for the Forex currency market, stock market, commodity market, cryptocurrency market, and stock indices. Recommended currency pairs include EUR/USD, GBP/USD, USD/JPY, AUD/USD, as well as cross rates EUR/GBP, EUR/JPY, GBP/JPY. It shows good results on gold (XAU/USD), oil (BRENT, WTI), and cryptocurrencies BTC/USD, ETH/USD. Optimal timeframes are M30 and H1 for intraday trading, M15 for aggressive trading with short targets, and H4 for determining the overall direction of the day.
ADVANTAGES
Automatic time synchronization allows the indicator to work correctly on any broker servers regardless of time zone. The indicator is universal and works on all timeframes with any trading instruments. It has built-in reliable protection against division by zero, array out of bounds, incorrect parameters, and missing bars. Flexible settings allow adjusting the analysis window, probability threshold, arrow size and color, and disabling notifications. The indicator displays colored arrows on the chart, text labels with probability percentages, and an informative comment. When a signal appears, a pop-up notification is issued indicating the symbol, probability, and target level. The indicator is easy to use and does not require deep knowledge of technical analysis.
DISADVANTAGES AND LIMITATIONS
The signal appears only after the analysis window closes, so in a fast-moving market, part of the potential may already be realized. In low-volatility periods with a narrow range, signals are less reliable, and in consolidation, frequent false signals are possible. The indicator does not take into account fundamental factors such as news and economic data. On small timeframes M1-M5, the range may not be sufficiently representative due to high market noise. An incorrectly chosen analysis window time may give incorrect signals, requiring optimization for a specific instrument. There are no built-in filters for trend, volatility, or volumes. The indicator does not show intermediate calculations during the analysis window and issues only one signal per day, not tracking changes in the situation after the first signal.
RECOMMENDATIONS FOR USE
It is recommended to optimize the analysis window for a specific instrument and trading session: for the European session from 9:00 to 10:00 or from 10:00 to 11:00 CET, for the American session from 16:00 to 17:00 CET, for the Asian session from 2:00 to 3:00 CET. It is advisable to use additional filters: consider the overall daily trend, pay attention to support and resistance levels, and check the economic calendar before entering a trade. For risk management, it is recommended to place a stop loss behind the opposite boundary of the range, set a take profit at the target level, or partially fix profits. Do not risk more than 1-2% of capital per trade. Optimal probability thresholds are: 75-80% for a conservative approach with fewer signals but higher accuracy, 65-70% for a moderate approach, and 50-60% for an aggressive approach with maximum signals but requiring additional filtering.
CONCLUSION
Daily End Potential is a useful tool for intraday traders, helping to formalize market entry based on the price range. The indicator is particularly effective on liquid instruments during periods of normal market activity but requires competent risk management and additional confirmation of signals by other methods of analysis.