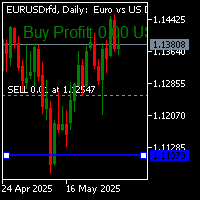
ATR ZigZag with Bollinger Bands Pro Pips Predict

ATR Zigzag With Bollinger Bands Pro Pips Predict

Indicator Description

ATR Zigzag With Bollinger Bands Pro Pips Predict is a professional technical indicator for the MetaTrader 5 platform that combines several powerful market analysis tools:

  • ATR-based ZigZag — constructs zigzag based on volatility (ATR)

  • Bollinger Bands — dynamic volatility channels

  • Median Segment — median support and resistance line

  • Predictive Mode — forecasting the next move

  • Pips Display — showing movement size in pips

  • Auto Anti-Flicker — protection against flickering on all timeframes

Purpose of the Indicator

The indicator is designed for:

  1. Identifying trend movements — zigzag shows market structure

  2. Finding entry and exit points — BUY and SELL signals at reversals

  3. Volatility assessment — through ATR and Bollinger Bands

  4. Target forecasting — calculating potential movement in pips

  5. Risk management — support and resistance levels from Median Segment

Markets and Instruments

Supported markets:

  • Forex (all currency pairs)

  • Cryptocurrencies (BTC, ETH, and others)

  • Commodity markets (gold, silver, oil)

  • Stocks (individual stocks)

  • Indices (S&P 500, NASDAQ, and others)

Recommended timeframes:

M1-M15 — for scalping and intraday trading
M30-H1 — for short-term trading
H4-D1 — for medium-term trading
W1-MN1 — for long-term investing

Advantages

  1. Comprehensive Analysis
    Combines multiple indicators in one window. No need to clutter the chart with numerous tools.

  2. Accurate Signals
    BUY signals after trough formation. SELL signals after peak formation. Minimization of false signals through Anti-Flicker.

  3. Forecasting
    Calculation of the next move in the opposite direction. Display of potential movement size in pips. Assistance in setting take-profit levels.

  4. Adaptability
    Adaptive multiplier based on ATR. Automatic adjustment to the current timeframe. Works on any instruments.

  5. Ease of Use
    All information in one panel. Pips displayed directly on the chart. Customizable parameters for any trading style.

  6. Stability
    Anti-flicker on all timeframes. Safe memory management. Correct updates when parameters change.

Disadvantages

  1. Signal Lag
    Like any ZigZag-based indicator, signals come with a delay. May miss the beginning of strong movements.

  2. Sensitivity to Settings
    Incorrect ATR Period selection may generate false signals. Requires optimization for specific instruments.

  3. Not Suitable for All Styles
    Not recommended for beginners without understanding the basics. Requires additional signal confirmation.

  4. Dependence on Volatility
    During low volatility periods, may generate frequent false signals. During high volatility periods, may miss movements.

  5. Resource Intensive
    On weak computers, may slow down with large amounts of historical data. May repaint when changing timeframes.

  6. Not an Independent System
    Requires additional analysis before entering the market. Does not account for fundamental factors. No automated position management.

Usage Recommendations

For maximum effectiveness:

  1. Confirm signals with other indicators (MACD, RSI, volume)

  2. Use price support and resistance levels

  3. Consider the news background before entering

  4. Start with a demo account for testing

  5. Optimize parameters for your instrument

Default optimal settings:

  • ATR Period: 50 (for H1)

  • Min and Max Period: 3 and 10

  • ATR Multiplier: 1.5

  • BB Multiplier: 2.0

Conclusion

ATR Zigzag With Bollinger Bands Pro Pips Predict is a powerful analytical tool for traders who want to:

  • See market structure in real time

  • Receive clear signals at reversals

  • Forecast potential movement

  • Manage risks based on volatility

Suitable for:

  • Medium-term and long-term traders

  • Intraday traders with signal confirmation

  • Professionals using multi-factor analysis

Not recommended for:

  • Scalping without additional filtering

  • Trading during high volatility periods (news)

  • Beginner traders without market analysis experience

Important: The indicator is an analytical tool, not a trading system. Always use additional analysis methods and risk management before opening positions.



More from author
ATRZigMACD
Igor Nagorniuk
ATRZigMACD - Brief Indicator Description 1. Purpose and Concept ATRZigMACD is an advanced oscillator that combines the classic MACD with an ATR-ZigZag algorithm for filtering false signals. The indicator identifies trend reversal points considering volatility, confirms trend strength, and generates clear trading signals. 2. Principle of Operation Components: MACD histogram (blue) – difference between fast and slow EMA Signal line (yellow) – smoothing MA of the histogram SELL arrows (green, upw
Daily End Potential (DEP) v1.26 is a technical indicator for MetaTrader 4 that analyzes the price range in a specified time window and calculates the probability of price movement up or down until the end of the trading day. INDICATOR PURPOSE The indicator helps traders determine the most likely direction of intraday movement after the formation of a key price range. If the price is closer to the upper boundary of the range, the downward movement potential is greater, and vice versa. The indica
Two zigzags with different periods of 13 and 55 are formed in this indicator.  When two segments of the indicator form and connect in place, thereby forming a minimum or maximum of the price on a certain timeframe, the indicator signals a possible price reversal in the opposite direction. If, when forming a zigzag with the smallest period (period 13), the largest period (period 55) remains at the same minimum  or the maximum, this means that a corrective movement to the previous maximum or minim
The zig-zag indicator is standard with a period of 34 with an additional arrow signal. The additional signal is calculated separately from the zig-zag indicator.The work on this indicator is as follows: 1. when forming a segment of the zig-zag indicator and an additional arrow signal appears, you need to open a position in the direction of the arrow; 2. when forming another arm of the zig-zag indicator in the opposite direction of the additional signal (arrow) at the top of the previous arm, it
Balance line
Igor Nagorniuk
The specified indicator is one of the versions of the indicator displaying profit (loss) on the current symbol. You can easily move the level with the mouse, determining the total profit or loss. The features of this indicator are: 1. that the profit or loss will not be displayed near the line, in the place where the trade is taking place, but in the upper-left corner of the screen, which means that calculating the loss or profit will not interfere with your trading. 2. The indicator will automa
Full Description of the WPRV2 Indicator The WPRV2 indicator is an enhanced version of the classic technical analysis tool known as Williams' Percentage Range (%R). It is primarily used in financial markets such as stock exchanges, Forex, and cryptocurrency platforms to analyze market trends and identify optimal entry and exit points for trades. Purpose of the Indicator The main goal of the WPRV2 indicator is to measure the current price relative to its recent high and low extremes. This helps t
Detailed Description of the GannZigZagMACD Indicator Purpose and Concept GannZigZagMACD is a hybrid technical indicator for the MetaTrader 5 platform that combines the classic MACD indicator with elements of Gann's zigzag. It is designed to identify trend reversals and generate trading signals based on extreme patterns. The main idea of the indicator is to detect significant highs and lows using Gann's method and then project signals onto the MACD histogram. Principle of Operation Main Componen
ZigZag3LZZ
Igor Nagorniuk
ZigZag_3LZZ — Three-Level ZigZag Indicator  What It Is For The ZigZag_3LZZ indicator is designed for technical analysis of financial markets. It displays three multi-colored broken ZigZag lines with different periods (5, 13, 34) on the chart, allowing the trader to: Visually identify key price reversal levels Filter out insignificant price fluctuations and market noise Build trend lines based on the latest extremums Automatically calculate Fibonacci levels (0.24, 0.382, 0.5, 0.618, 0.76) Identi
X Sensors Pro is a professional volume profile indicator that visualizes the distribution of trading volume across price levels over a selected period. The indicator automatically identifies local extremes (HH and LL), calculates the Point of Control (POC) — the level with maximum volume, and builds support and resistance levels based on the identified range. Key Features: Visualization of volume profile as colored histograms Automatic POC (Point of Control) detection Construction of HH (Highe
Dual ZigZag SSRC is a trading indicator for technical analysis designed to generate buy and sell signals based on a combination of two ZigZags with different periods and an SSRC filter. The indicator automatically identifies local extremes, confirms them with the filter, and provides signals with entry and stop loss levels. Purpose Identifying reversal points - the dual ZigZag highlights significant lows and highs, filtering out market noise. Filtering false signals - the SSRC oscillator confir
ZigZag_Keel is a technical indicator for MetaTrader 5 based on a double zigzag. It is designed to determine trend direction and generate buy and sell signals. How It Works The indicator uses two zigzags with different periods. KeelOver with a longer period determines the global price direction. Slalom with a shorter period finds local extremes. Signals are generated only in the direction of the global trend, which filters out false entries. Trading Signals A green arrow up indicates a buy signal
XCycle
Igor Nagorniuk
XCycle - Cycle-Based Trading Indicator for MT5 General Description XCycle is a professional technical analysis indicator based on market cycle theory. The indicator detects minor (short-term) and major (long-term) market cycles, generating buy and sell signals while considering the current trend and market volatility. Application Areas Markets: - Forex - all major, cross, and exotic currency pairs - Cryptocurrencies - Bitcoin, Ethereum, altcoins (BTC/USD, ETH/USD, etc.) - Indices - S&P 500,
Daily End Potential (DEP) v1.20 is a technical indicator for MetaTrader 5 that analyzes the price range in a specified time window and calculates the probability of price movement up or down until the end of the trading day. INDICATOR PURPOSE The indicator helps traders determine the most likely direction of intraday movement after the formation of a key price range. If the price is closer to the upper boundary of the range, the downward movement potential is greater, and vice versa. The indicat
ATR ZigZag with BBands Pro is a professional indicator for MetaTrader 5 that combines ATR ZigZag (trend line identification based on volatility), Bollinger Bands (dynamic support/resistance levels) and Pips labels (visual display of movement size in points). The indicator automatically detects market reversals, displaying the last 5 confirmed movements with their size. Entry Signals BUY: Price reaches the LOWER Bollinger Band (red label at bottom) Reversal occurs upward (TROUGH) GREEN label app
Filter:
No reviews
Reply to review