YazanPro Pattern Scanner
- Indicators
-
Yazan Adnan Ramadan Ibrahim
 Algorithmic trader and MQL5 developer based in Jordan. I build Expert Advisors for MetaTrader 5 focused on gold (XAUUSD) and major FX pairs: multi-module confluence systems, short-hold scalping tools and manual trade panels. Each product is tested in the Strategy Tester on real ticks with
- Version: 1.2
- Updated: 2 November 2026
- Activations: 10
YazanPro Pattern Scanner is a MetaTrader 5 indicator that checks up to 150 symbols on the timeframes you choose for classic chart patterns and candlestick patterns, and lists them in one table with the stage each chart pattern has reached: forming, completed, breakout, retest, confirmed or failed.
It reads closed bars only. It places no orders and gives no buy or sell signals.
What you see on the chart
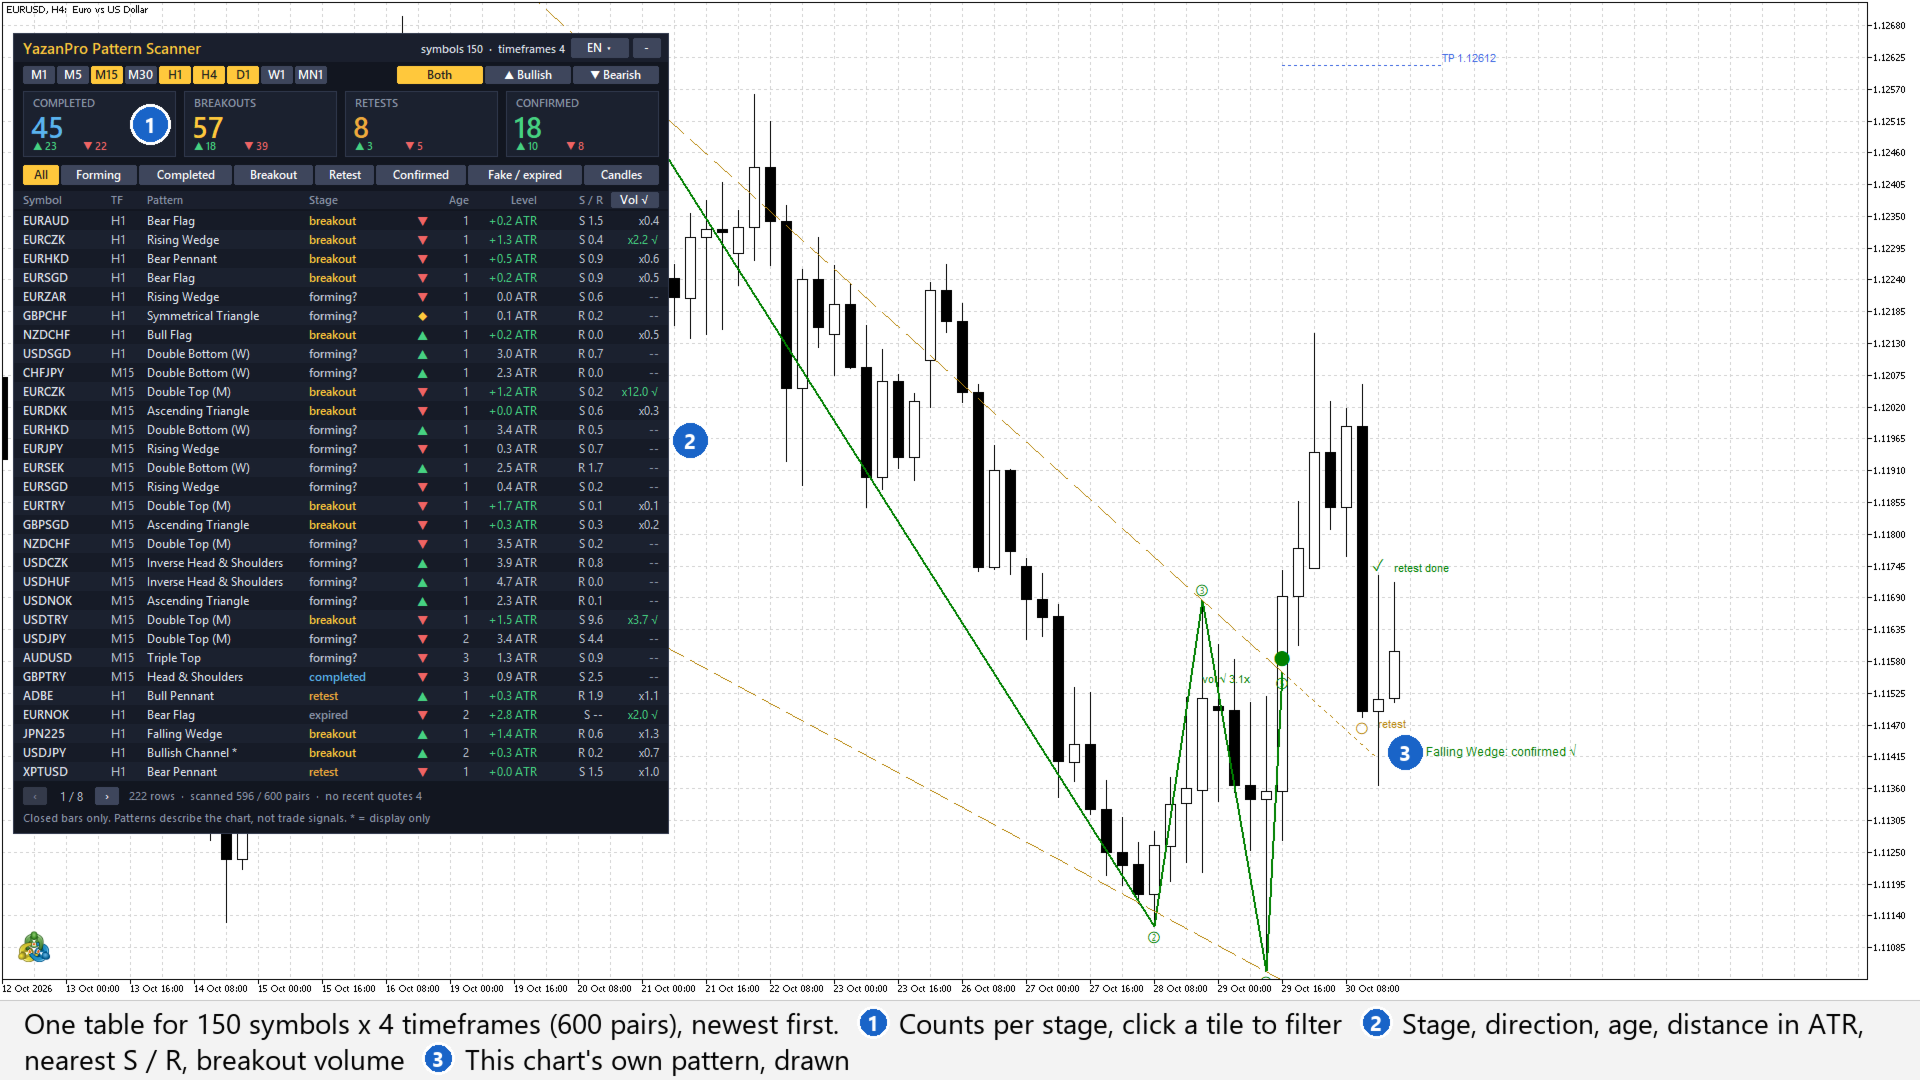
- Counts per stage: four large tiles count the patterns that are completed, broke out, are retesting and are confirmed, split into ▲ bullish and ▼ bearish. Click a tile to list only those.
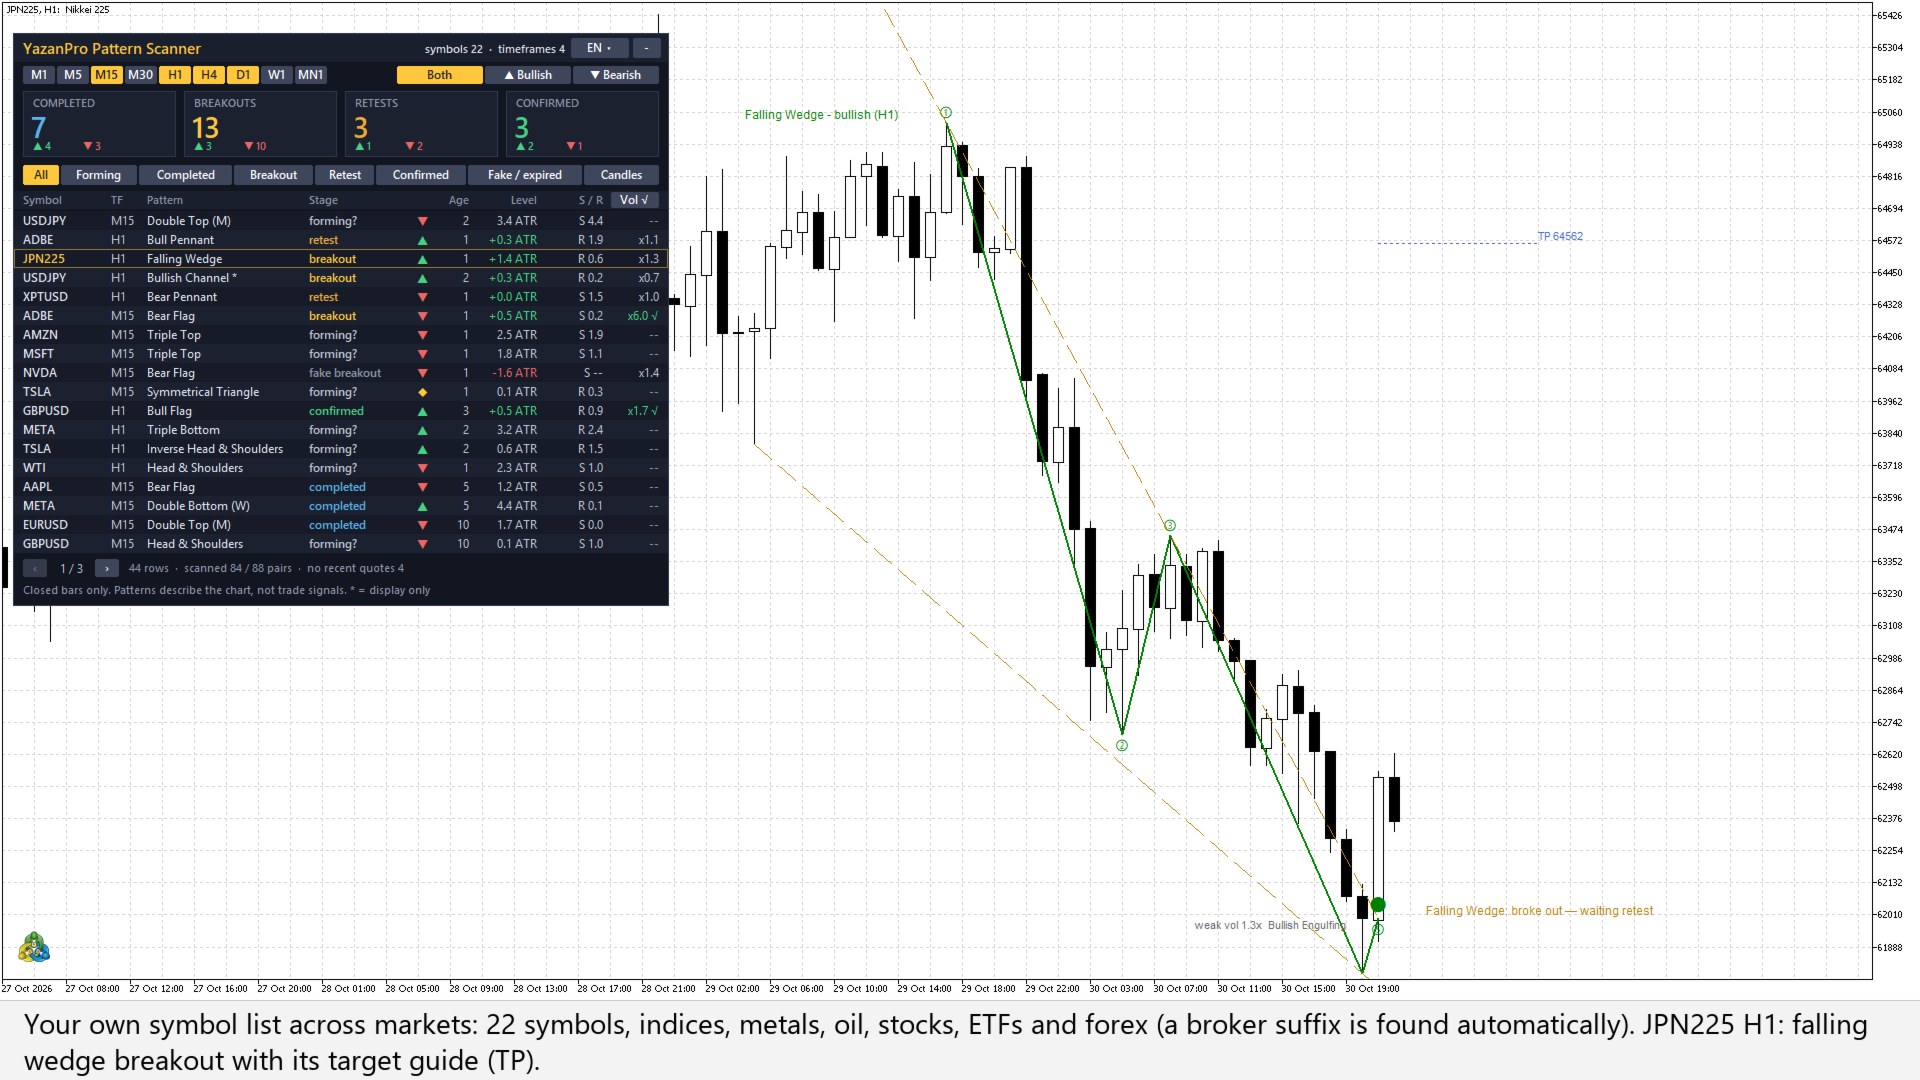
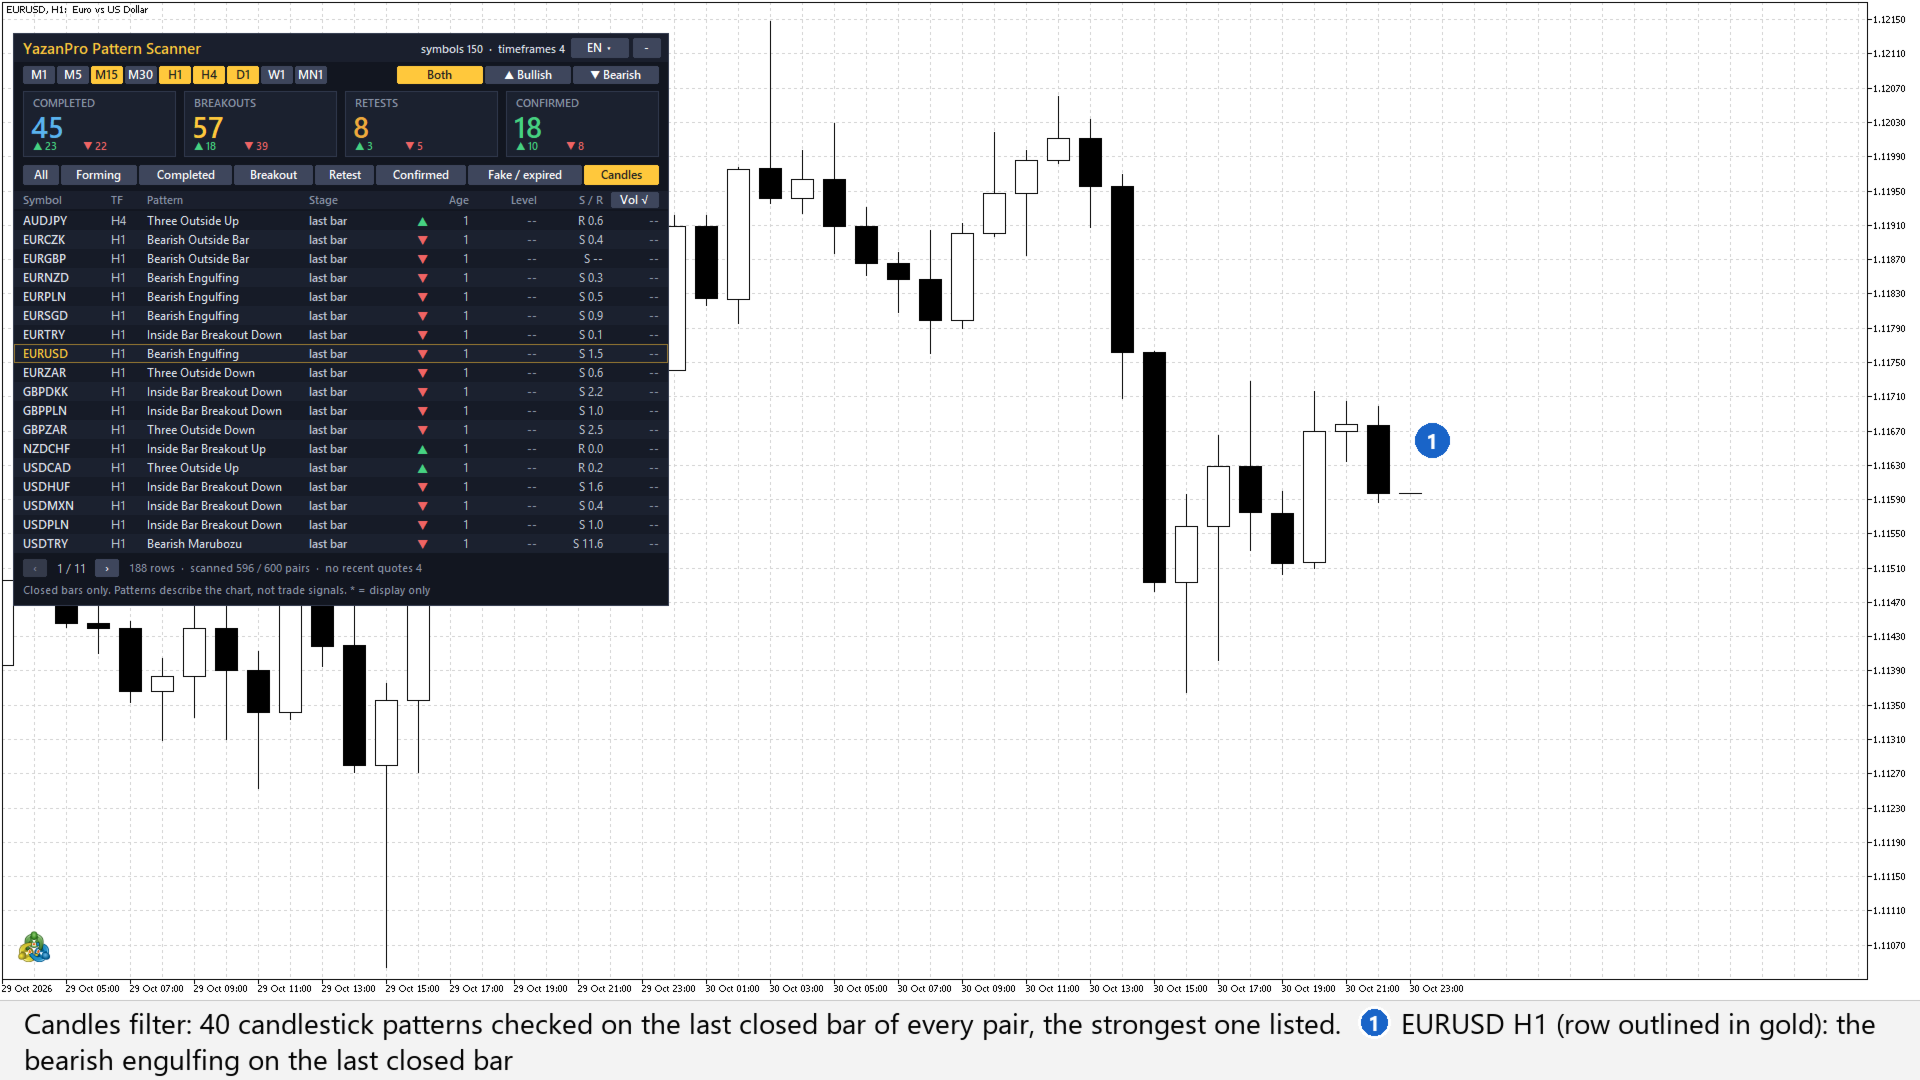
- The table: one row per pattern, newest first: symbol, timeframe, pattern, stage, direction (▲ ▼), age in bars, Level (distance from the last close to the breakout line, in ATR), S / R (the nearest support or resistance zone in the pattern's direction, in ATR) and Vol (breakout volume). The row of the chart's own symbol and timeframe is outlined in gold. 18 rows per page (5 to 30, input); 150 symbols on several timeframes fill as many pages as needed.
- The pattern of this chart: when the chart's own symbol and timeframe are part of the scan, its pattern is drawn with numbered points and boundary lines. Click a row to switch the chart to that symbol and timeframe (or to open it in a new chart, input).
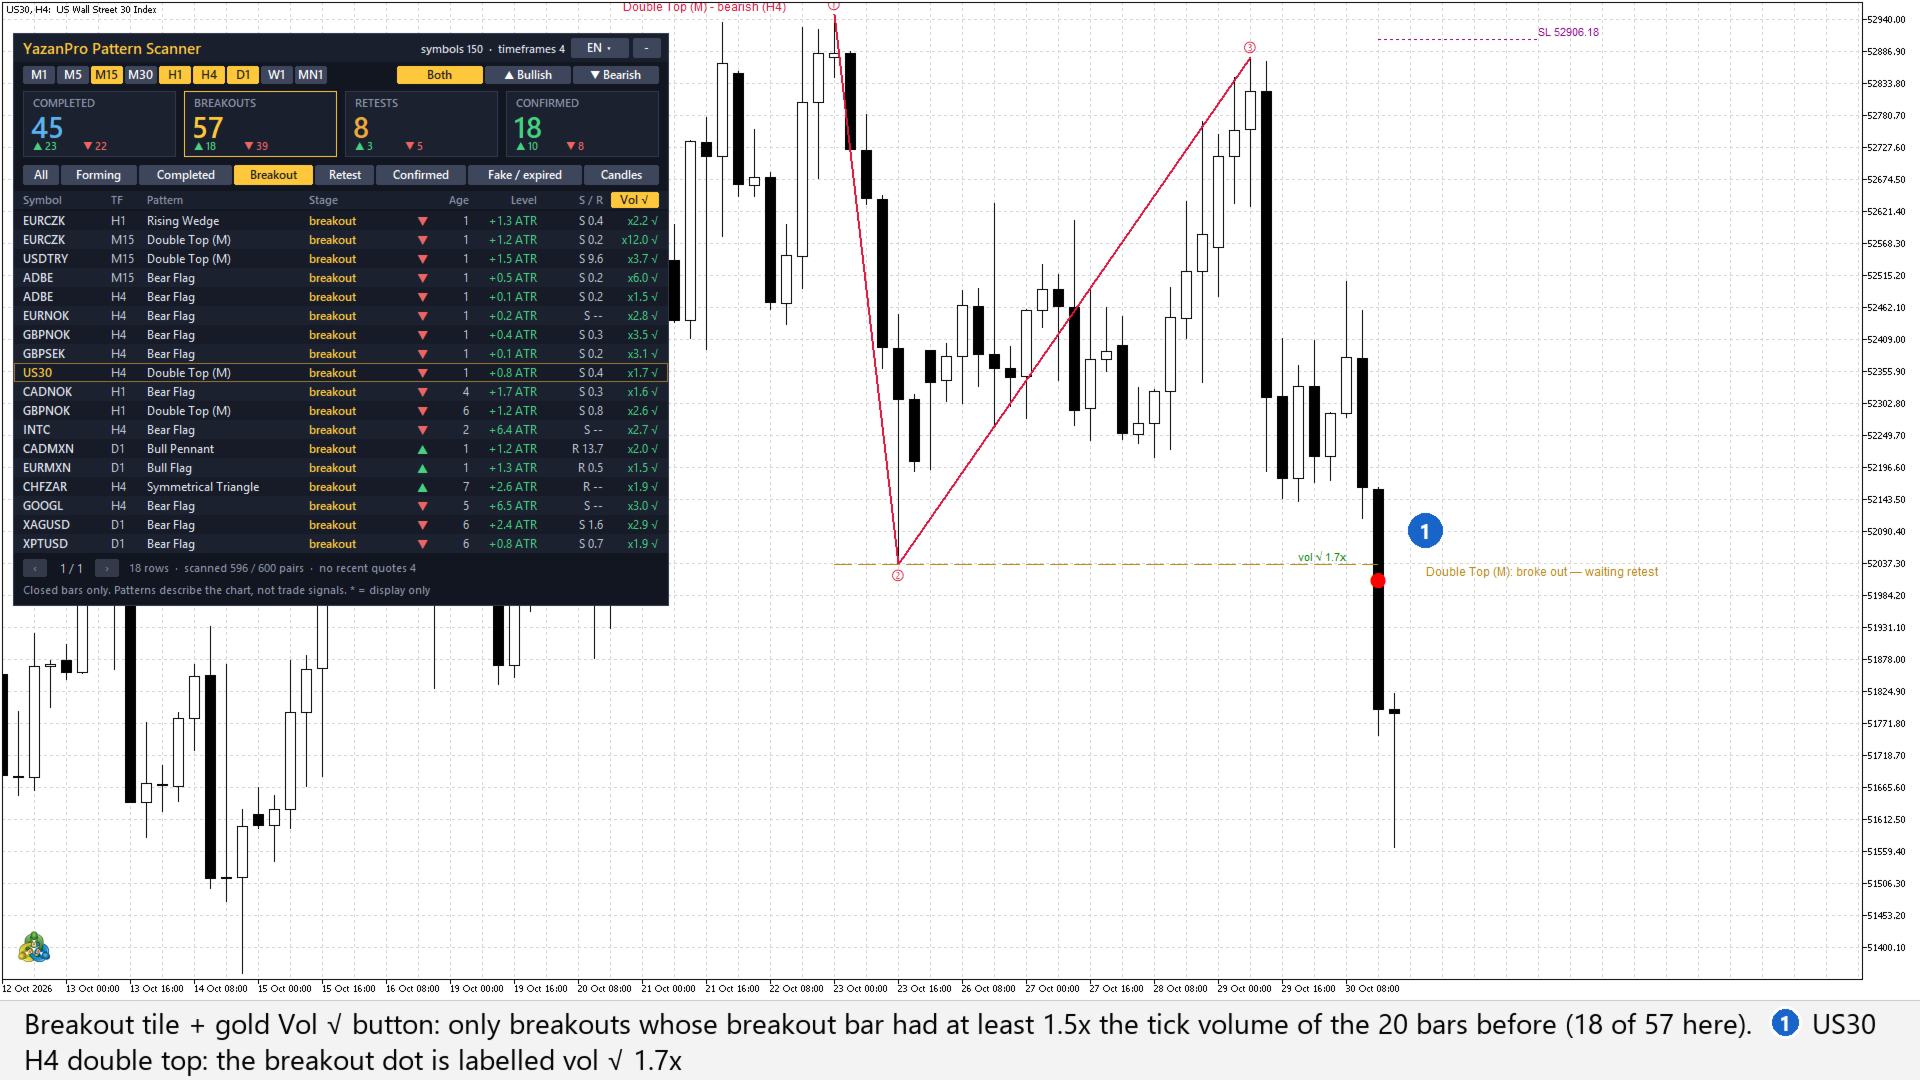
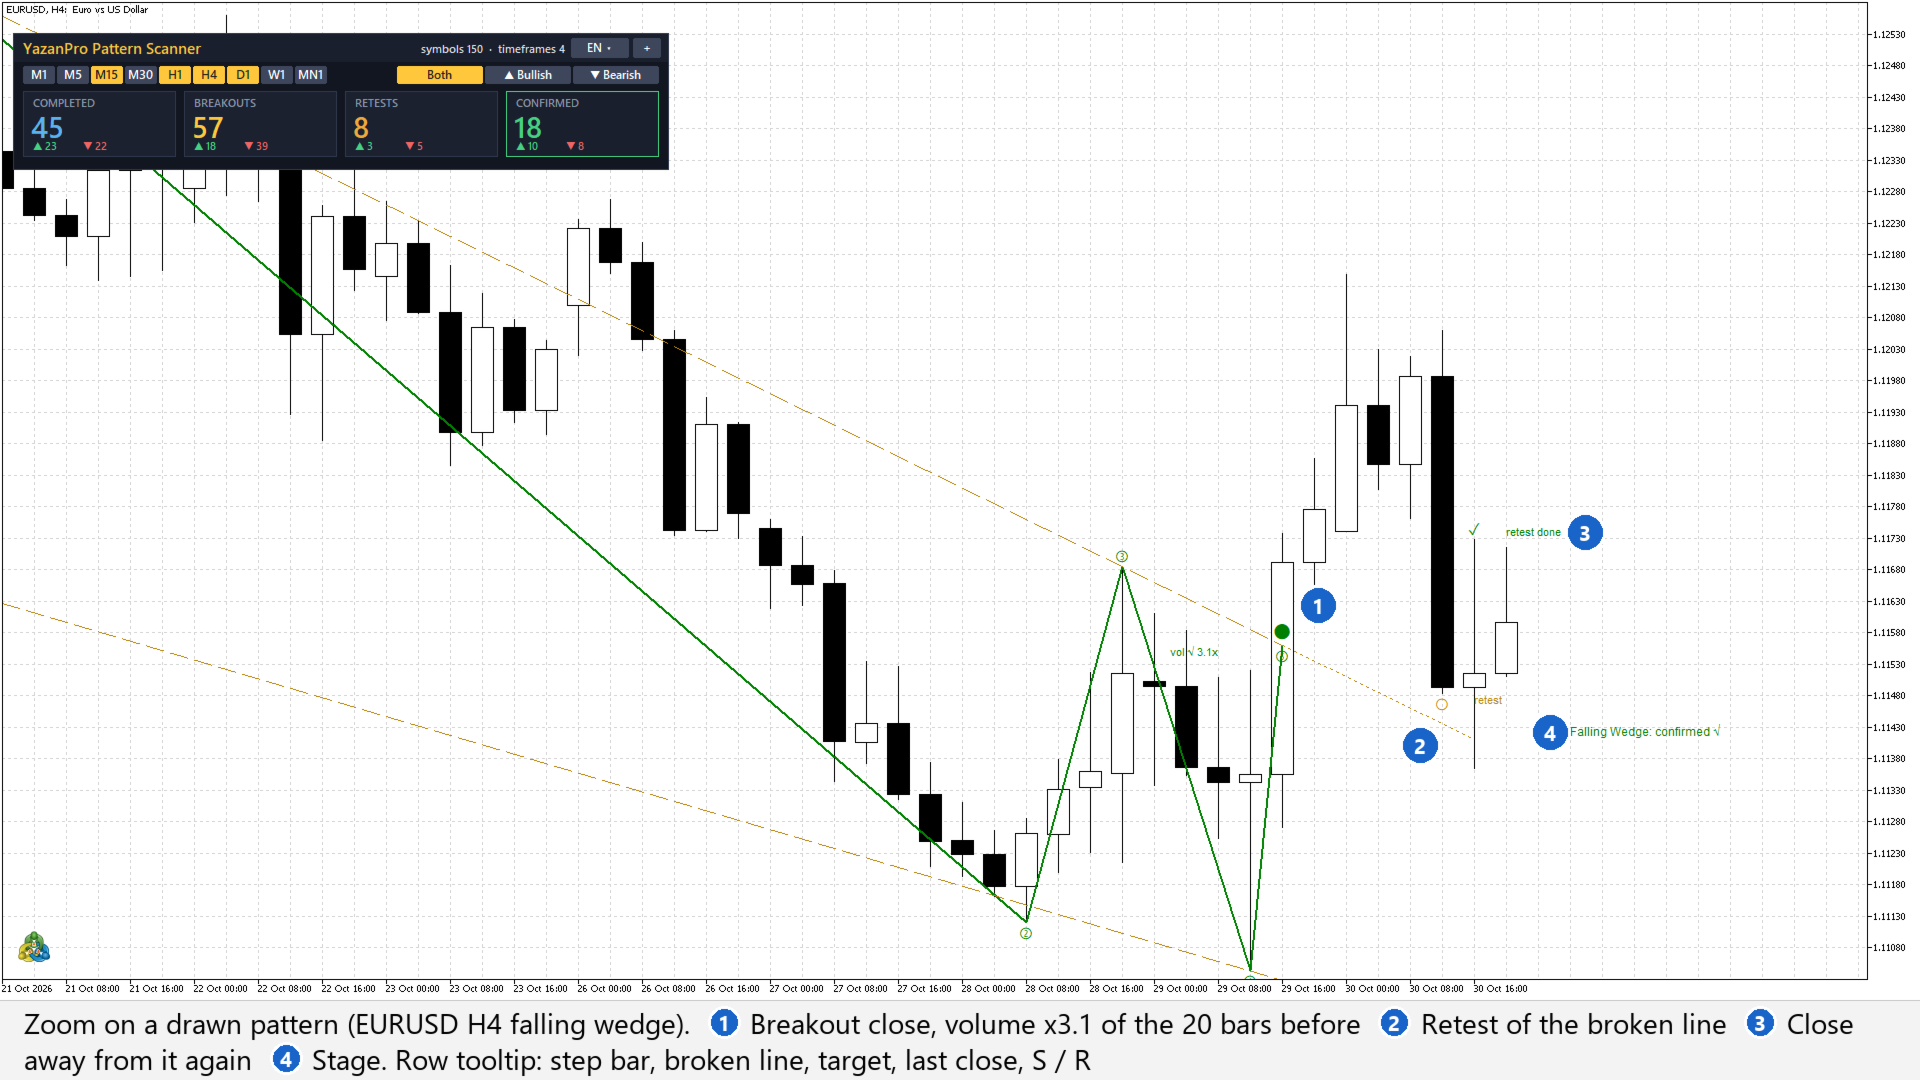
- Breakout dot: the bar that closed beyond the line, labelled with its volume, for example "vol √ 1.7x" (at least the input value, 1.5) or "weak vol 0.4x".
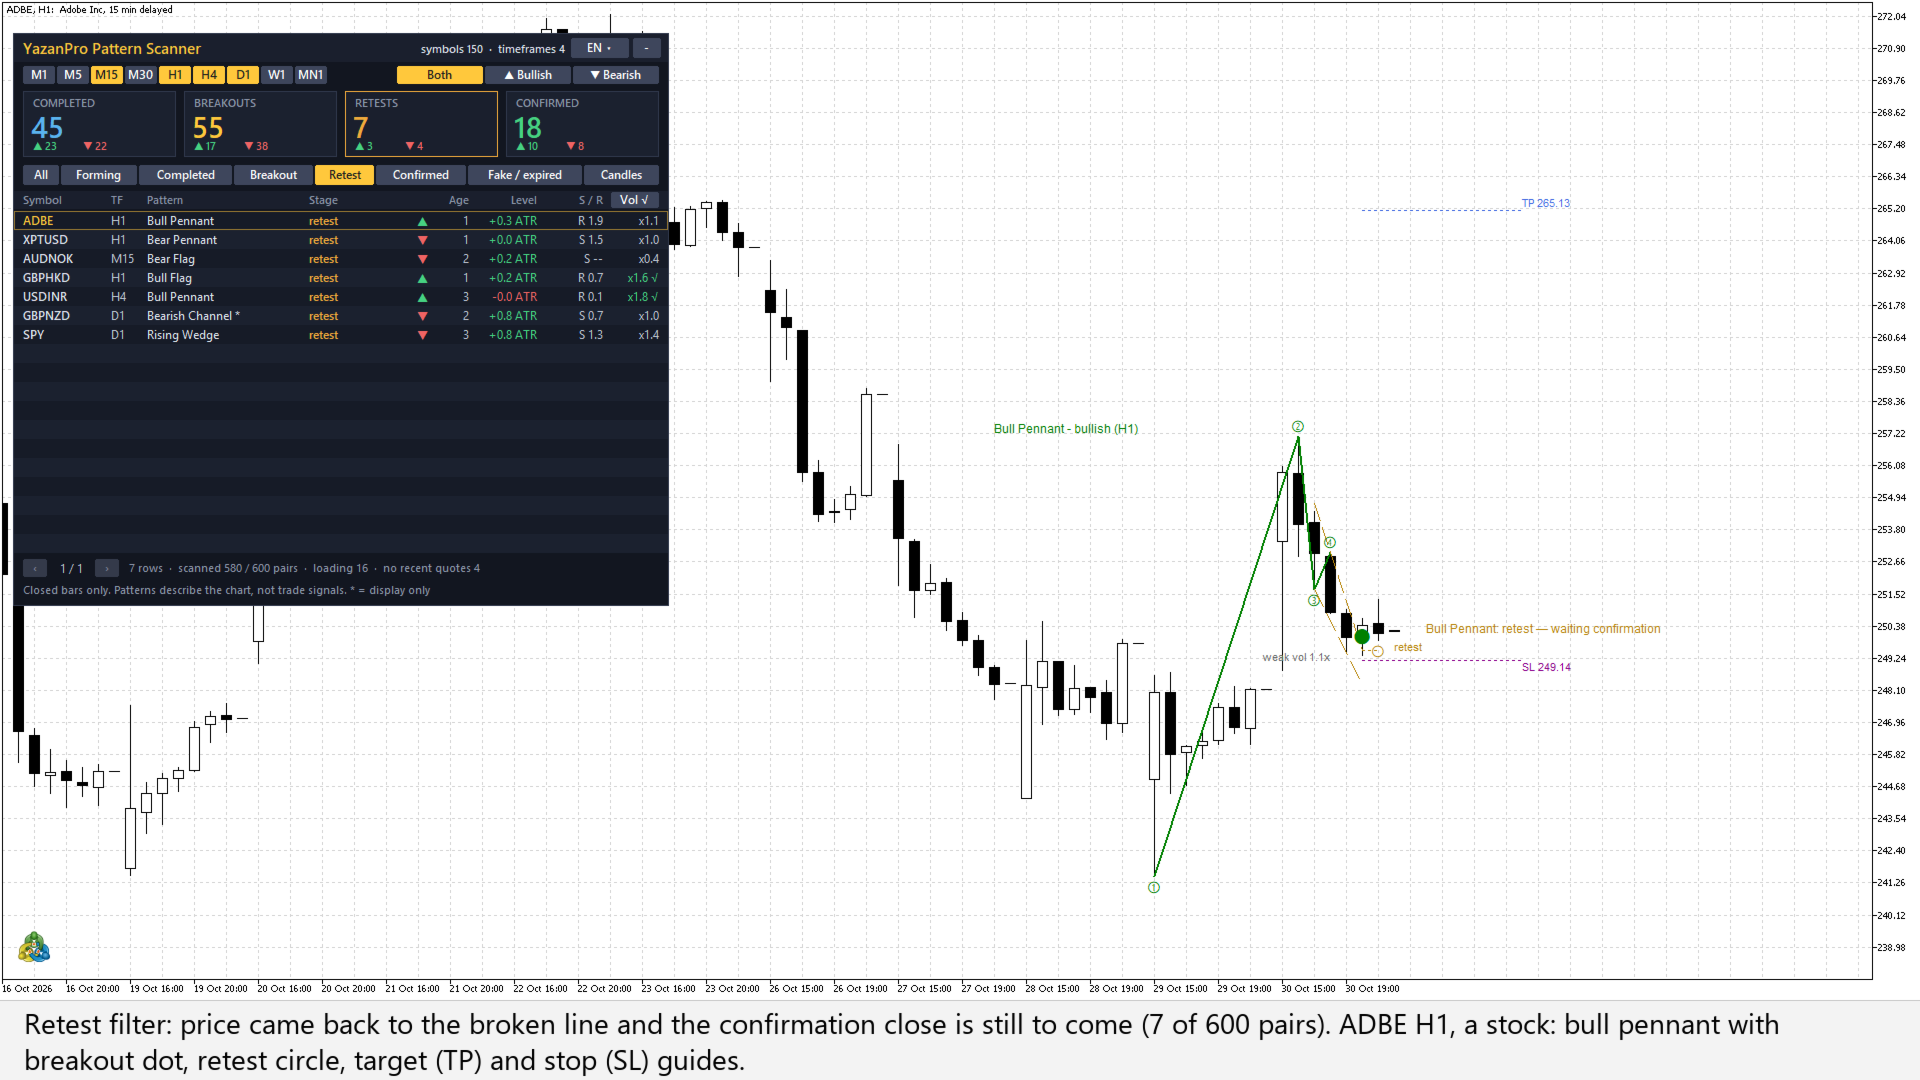
- Retest circle: where price came back to the broken line.
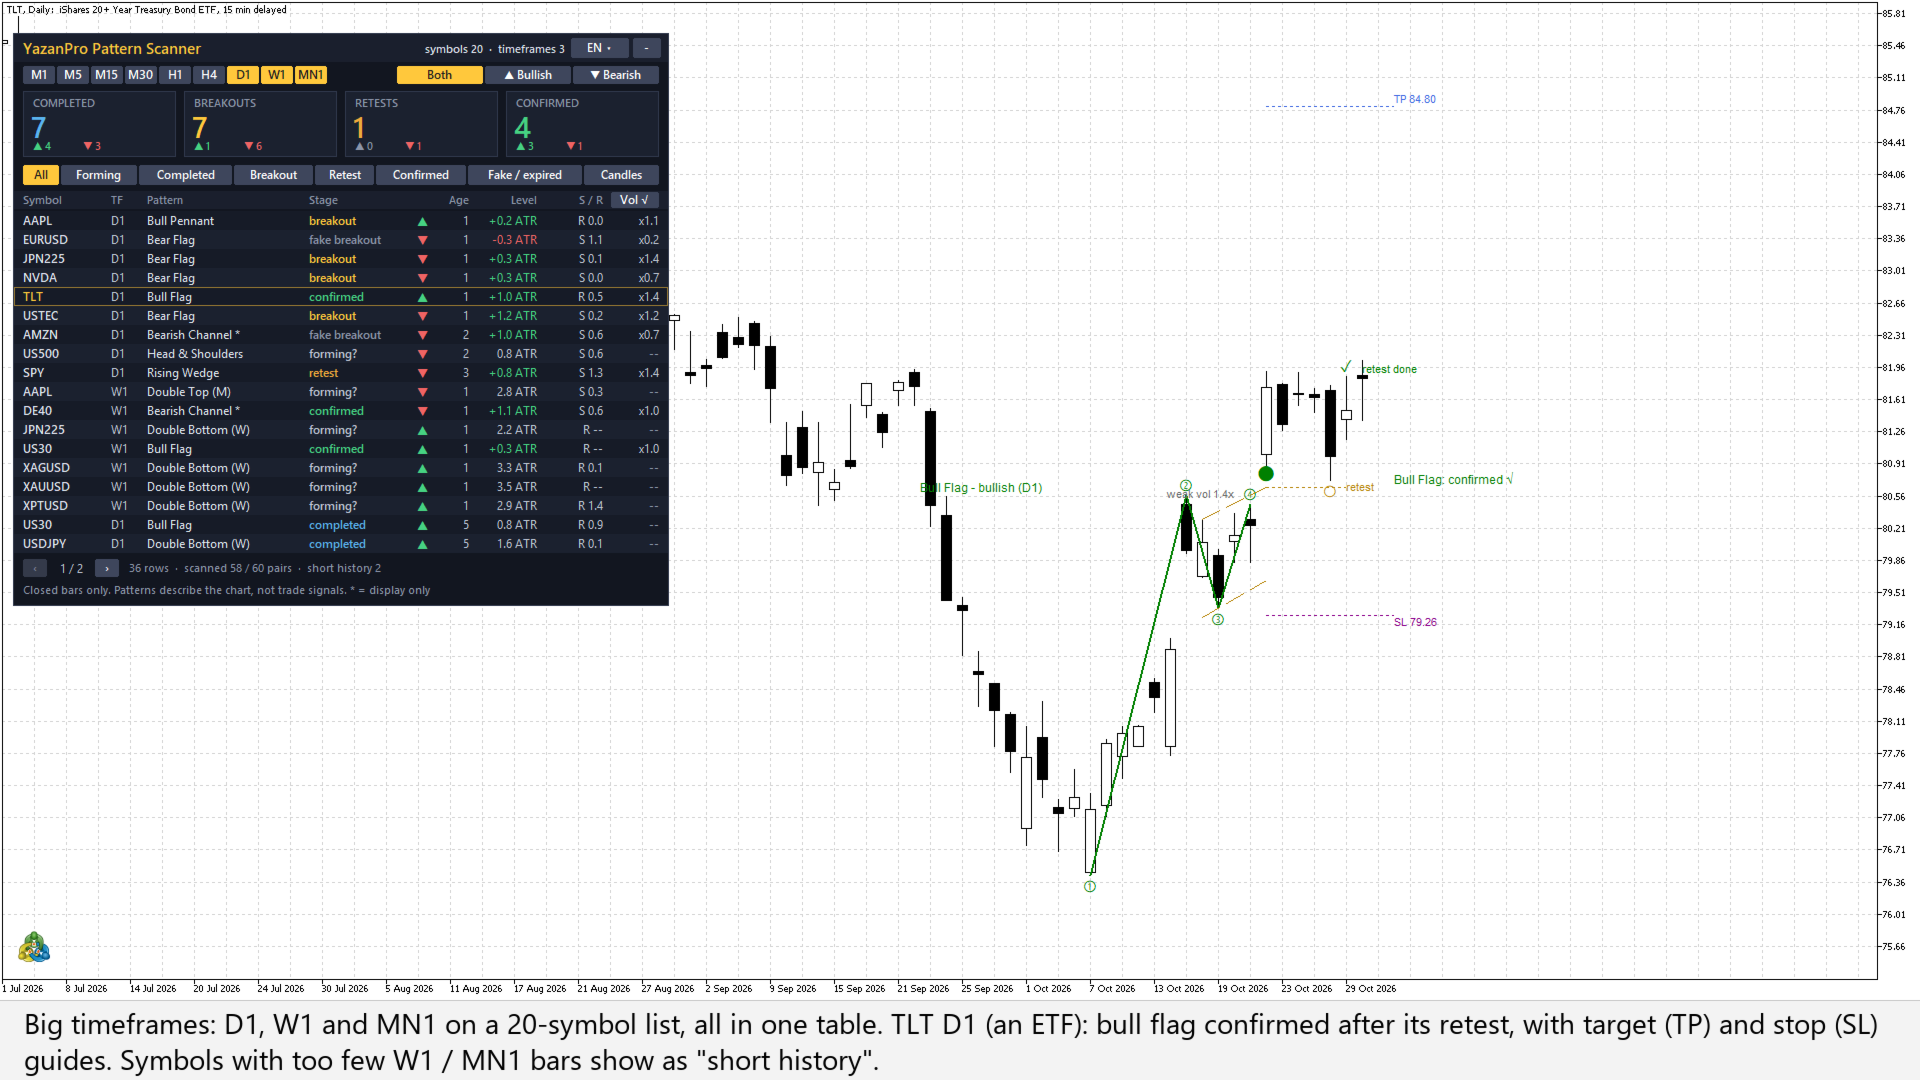
- Confirmation tick: "retest done" where a bar closed away from the line again; a cross marks a failed one.
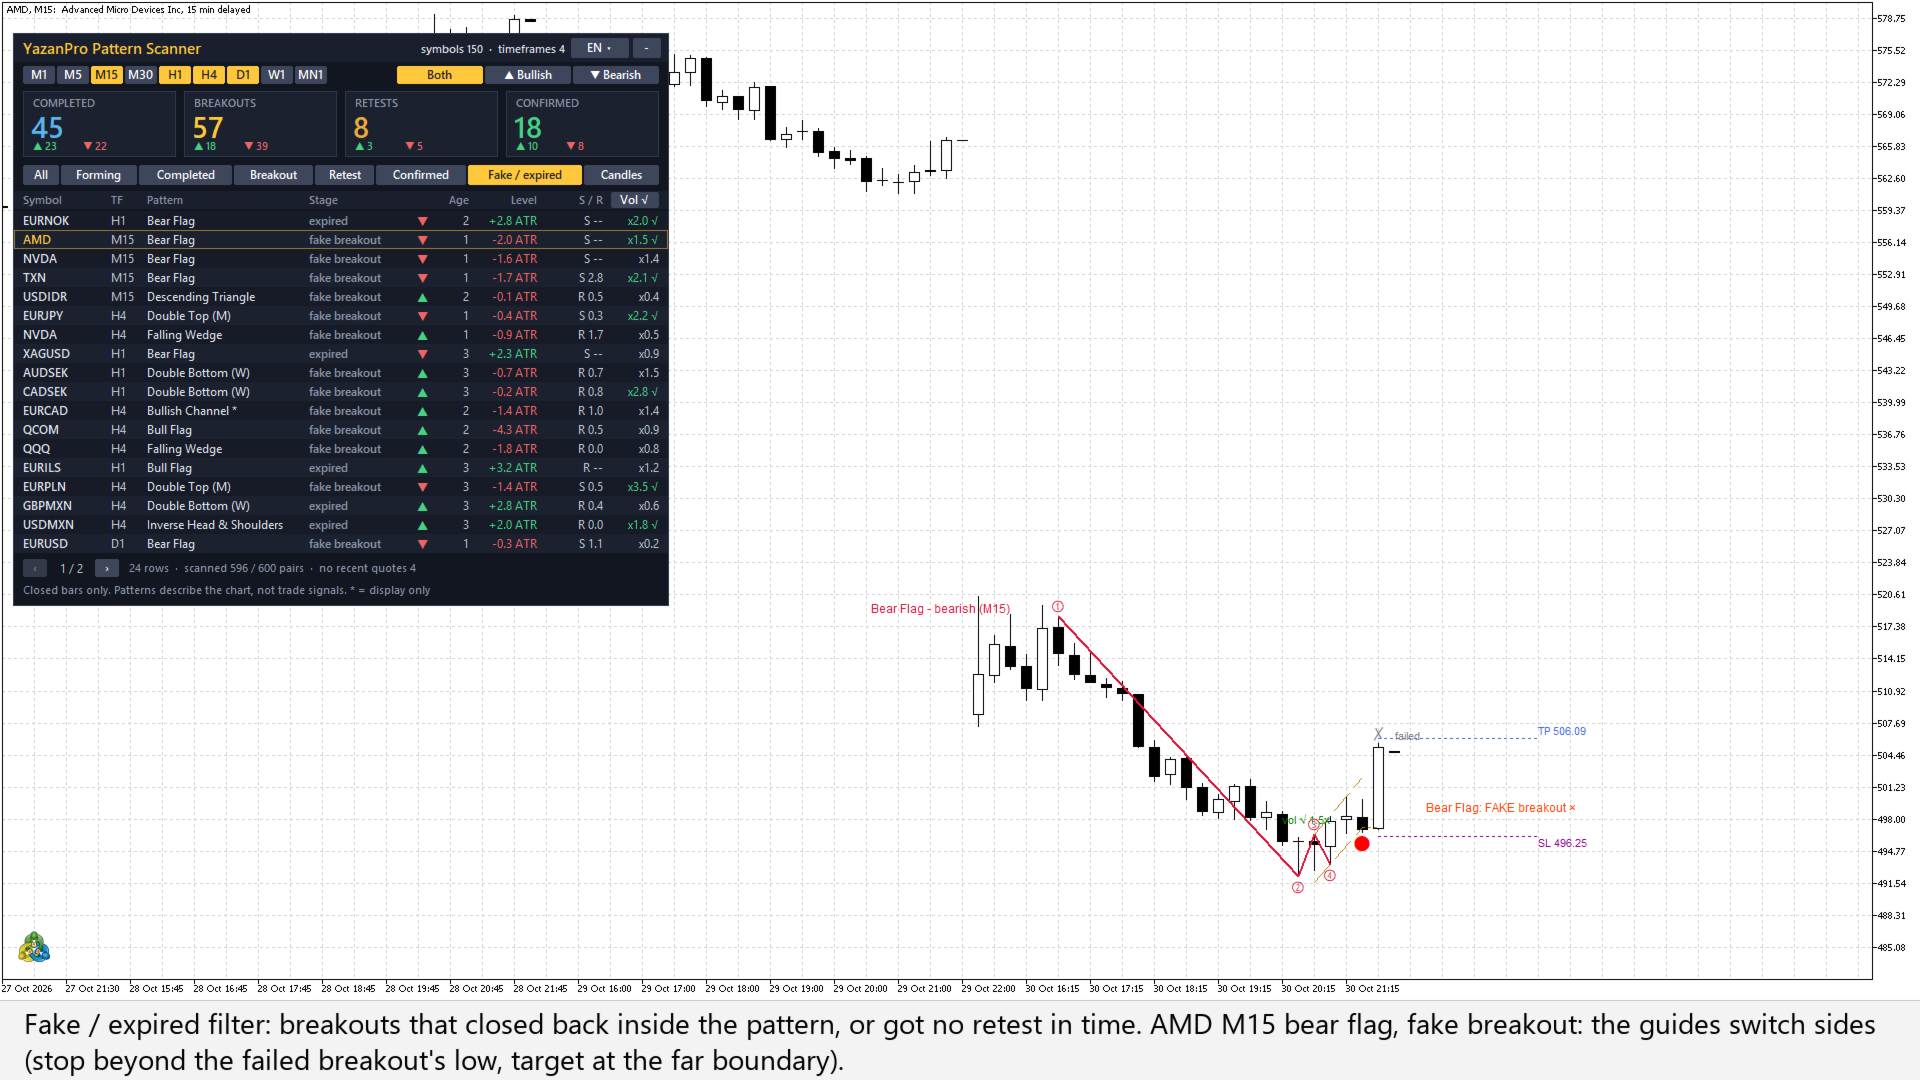
- Stage label and guides: for example "Falling Wedge: confirmed √", a target guide (TP, the measured move) and a stop guide (SL, beyond the last swing). After a fake breakout the two guides belong to the other side: the stop beyond the high or low the failed breakout reached (+ 0.1 ATR) and the target at the pattern's opposite boundary.
- Buttons: timeframes (M1 to MN1, gold = scanned), direction (Both, Bullish, Bearish), stage filter (All, Forming, Completed, Breakout, Retest, Confirmed, Fake / expired, Candles), Vol √ (only rows whose breakout volume reached the input value), language, fold, pages. The footer shows the progress, for example "scanned 596 / 600 pairs".
How to read it
- Look at the tiles: how many patterns sit in each stage. Click one, or a stage button, to list only those.
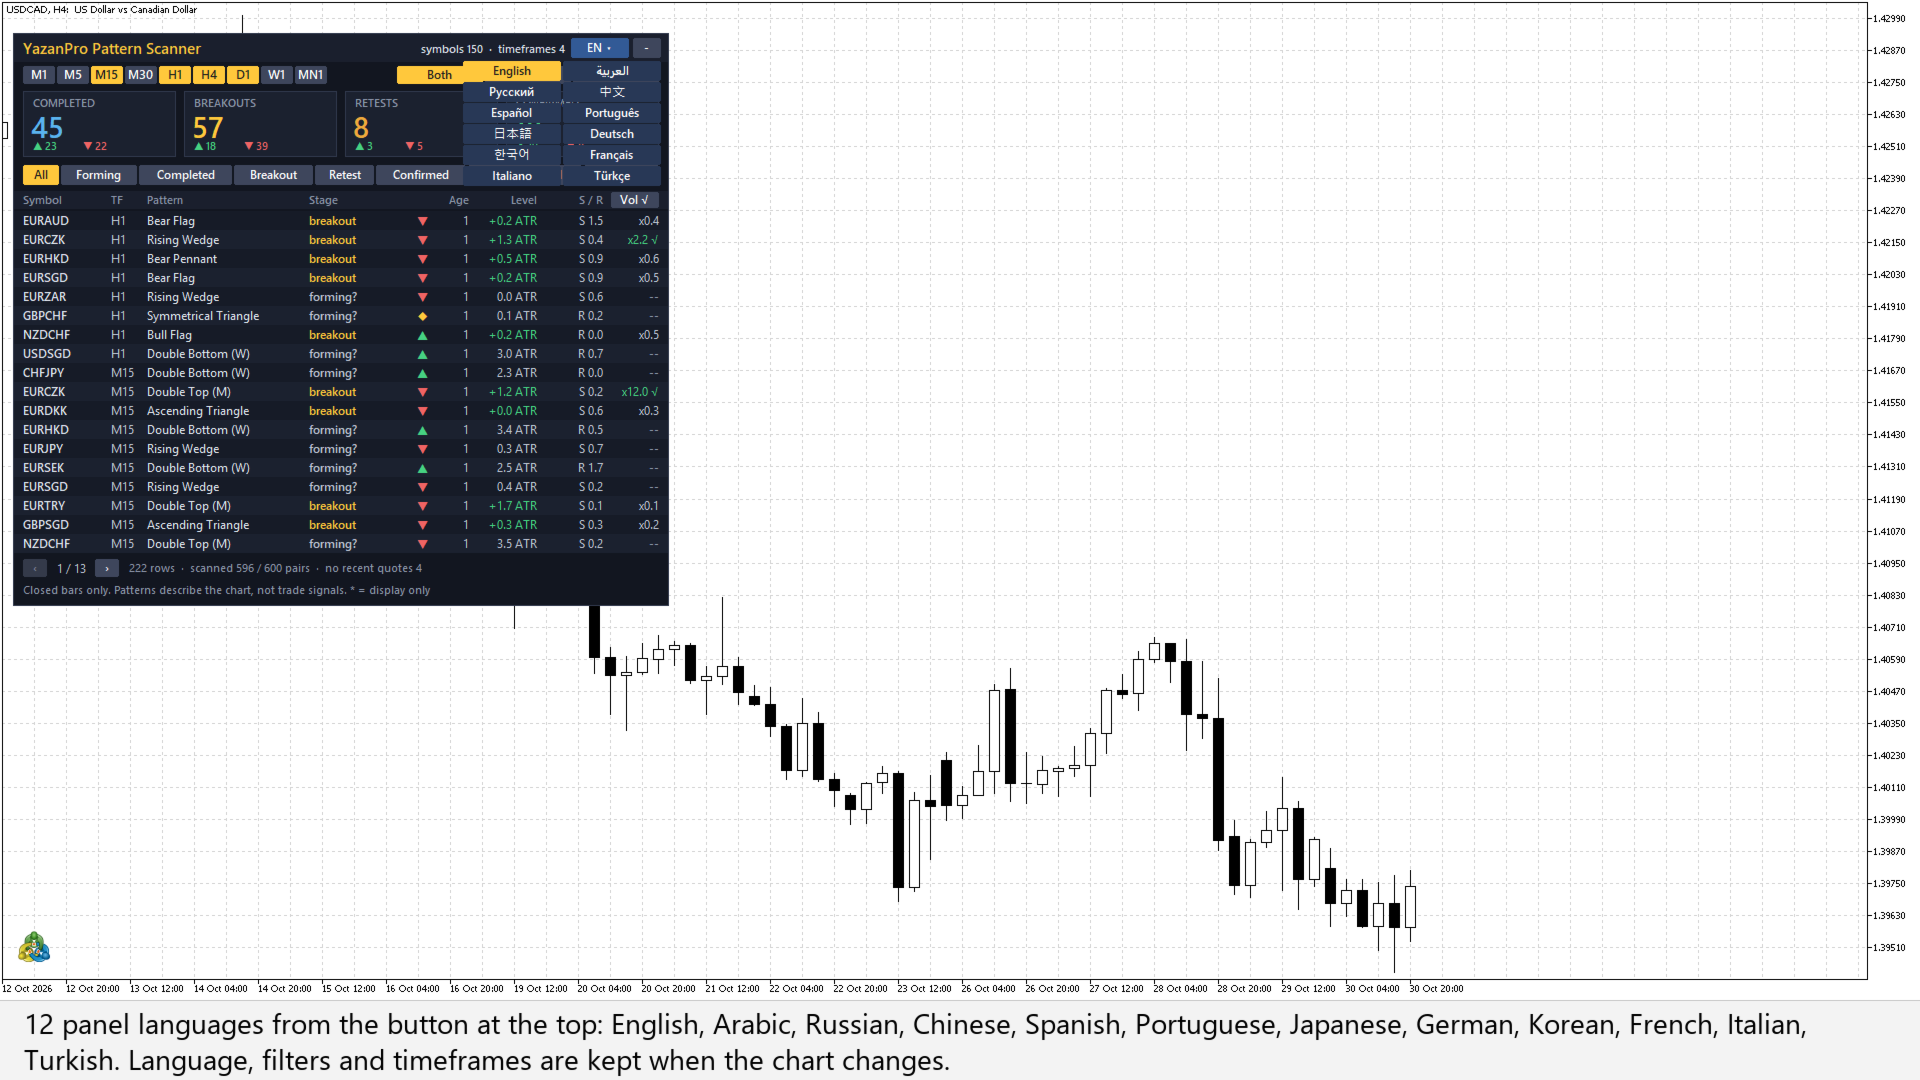
- Read a row from left to right. EURAUD · H1 · Bear Flag · breakout · ▼ · 1 · +0.2 ATR · S 1.5 · x0.4 means: on EURAUD H1 a bear flag broke out downwards, the breakout bar closed 1 bar ago, the last close is 0.2 ATR beyond the broken line, the nearest support zone lies 1.5 ATR below, and the breakout bar had 0.4 times the average volume of the 20 bars before it. Before a breakout the Level column shows how far the last close still is from the breakout line.
- Check Vol: from x1.5 (input) the value is green with a √. MetaTrader 5 gives tick volume for CFDs and forex (the number of price changes), not traded volume.
- Rest the mouse on a row: the tooltip gives the bar time of the step, the breakout level, the target, the last close and the nearest support and resistance with their strength.
- Click the row and read the drawing: points, breakout dot, retest circle, confirmation tick and guides show where each step happened.
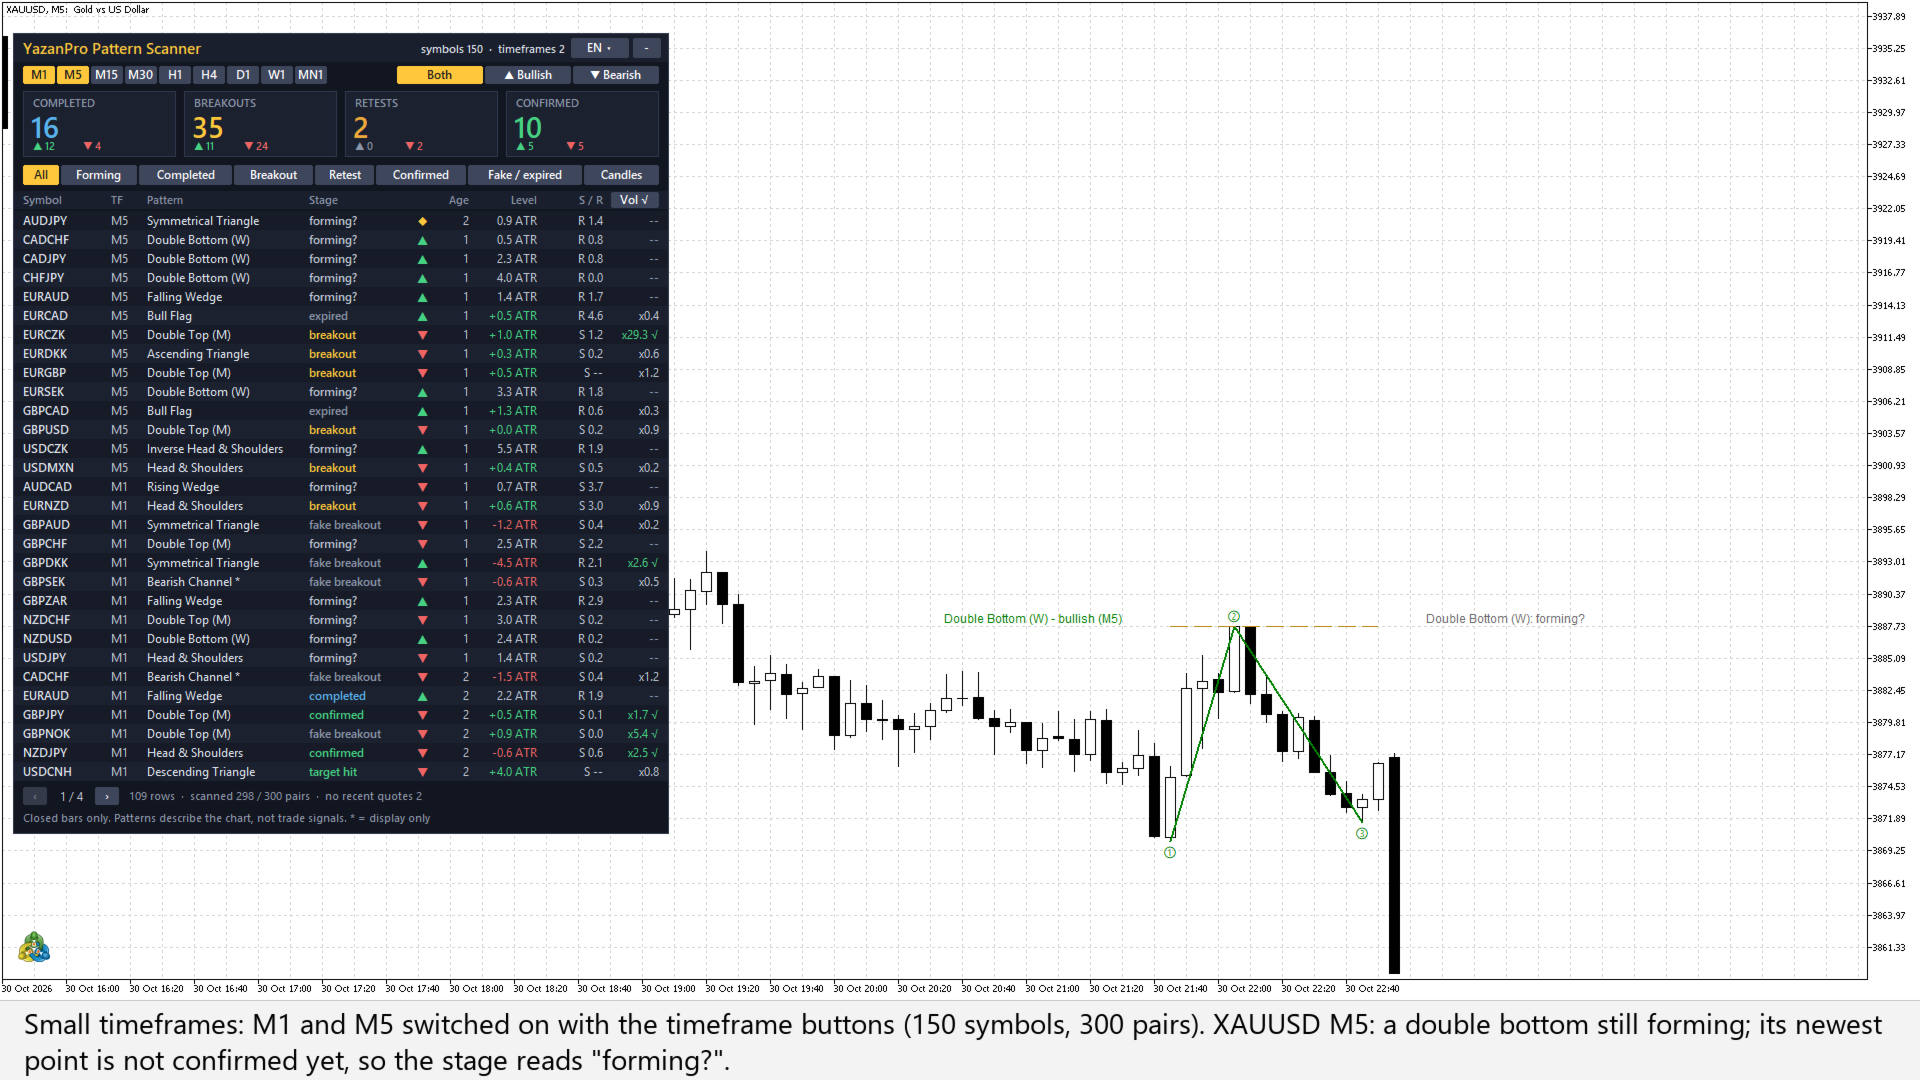
- "Forming?" rows can still change or vanish, because their newest point is not confirmed yet. Every other stage is decided on a closed bar.
What it does not do
- It does not trade and it is not a signal service. A pattern, a stage or a candlestick describes the chart; it does not predict the next move.
- It makes no accuracy or win-rate claim. A completed or broken pattern can still fail; that is why the table has the fake-breakout and expired stages.
- It does not scan more than 150 symbols per chart. For more, put a second copy on another chart with its own symbol list.
- Volume is a confirmation people look at, not a filter that was shown to work here: no test of the volume column was made.
- It draws only the pattern of the chart's own symbol and timeframe; the other rows are listed, not drawn.
What it scans
- Symbols: your Market Watch (the chart's own symbol first), every symbol your broker offers with full trading and recent quotes (Market Watch first), or your own list, for example "EURUSD,XAUUSD,US500". Up to 60 by default, 150 at most. A broker suffix is found automatically (EURUSD finds EURUSD.m). Symbols it adds to Market Watch for the scan can stay there after the indicator is removed (MetaTrader does not hide a symbol whose data is still in use); hide them by hand if you wish.
- Timeframes: M15, H1, H4 and D1 by default. Any of M1, M5, M15, M30, H1, H4, D1, W1 and MN1 can be switched on or off with the buttons on the panel.
- Markets: forex, metals, indices, stocks, energies and crypto, whatever your broker offers.
Chart patterns and their stage
The pattern engine reads the swing points of every symbol and timeframe (a zigzag of 2 x ATR). It finds:
- double and triple tops and bottoms
- head and shoulders and its inverse
- ascending, descending and symmetrical triangles
- rising and falling wedges
- bull and bear flags (named pennant when the flag narrows)
- rectangles, bullish and bearish channels, cup and handle and its inverse (marked * in the table)
Each pattern shows the step it has reached:
- Forming? the newest point is the running high or low and is not confirmed yet
- Completed: every point is confirmed and the pattern waits for a close beyond its breakout line
- Breakout: a bar closed beyond the line
- Retest: price came back to the broken line
- Confirmed: after the retest a bar closed away from the line again ("target hit" when the measured move was reached)
- Fake breakout: price closed back inside the pattern
- Expired: no retest or confirmation in time
Candlestick patterns
40 candlestick patterns are checked on the last closed bar of every pair, for example hammer, shooting star, engulfing, harami, piercing line, dark cloud cover, morning and evening star, three white soldiers, three black crows, kicker, pin bar, outside bar, inside bar breakout, tweezers, belt hold, abandoned baby and marubozu. Most of them need a short trend before them. The strongest one on the winning side is listed. On the same bar, chart patterns are listed above candlesticks.
Alerts
Pop-up and push notifications for a new completed pattern, breakout or retest; confirmation and candlestick alerts can be switched on too. Each step alerts once. Nothing is sent for what is already there when the indicator starts. Push messages are combined and sent at most once every few seconds, inside MetaTrader's push limit.
Light on the terminal
The scan runs on a timer, a few pairs at a time and at most about 30 ms of work per step, and each pair is read again only when its own bar closes. A symbol whose history is not synchronized yet shows as "loading" and is tried again every 3 seconds; the terminal never waits for it. A symbol without a quote for a week shows as "no recent quotes" and is skipped. No indicator handles are created.
Panel
- 12 panel languages with a button at the top: English, Arabic, Russian, Chinese, Spanish, Portuguese, Japanese, German, Korean, French, Italian and Turkish.
- A fold button shrinks the panel to its tiles.
- The language, filters and timeframes you choose are kept when the chart changes symbol or timeframe.
Who it is for
Traders who follow chart patterns on several markets and timeframes and want one list of where a pattern has formed, broken out or been retested, instead of opening every chart by hand. It is a watch list for your own analysis, not a trading system.
How it reads the charts
- Patterns and candles are found on closed bars. A step is decided on the bar that closed and does not change while the next bar is forming.
- A "Forming?" pattern uses the newest high or low, which may still move. It can change or disappear on a later bar.
- The retest and fake-breakout distances are a fraction of ATR(14) on that timeframe: 0.2 ATR for flags, tops, bottoms, head and shoulders and cups, 0.5 ATR for triangles, wedges, rectangles and channels. A breakout without a confirmation expires after 6 or 12 bars.
- Rectangles, channels and cups (marked *) come from a second, simpler pass. They are shown only when they share no point with the main pattern of that pair.
- Support and resistance zones are built from swing points and round numbers that lie within 0.5 ATR of each other; a zone needs at least two of them.
- The Vol column divides the volume of the breakout bar by the average of the 20 bars before it. The same value is written next to the breakout dot on the chart.
- A pair needs at least 62 bars of history. W1 and MN1 on young symbols may show "short history".
- In the Strategy Tester it scans the tested symbol only, on the chosen timeframes.
Inputs
Scan
- Symbols to scan: Market Watch (or: All tradable symbols on the server, Custom list)
- Custom list: symbols, comma separated: empty
- Max symbols scanned (1..150): 60
- Timeframes, comma separated (M1 M5 M15 M30 H1 H4 D1 W1 MN1): M15,H1,H4,D1
- Chart patterns with their stage: true
- Candlestick patterns on the last closed bar: true
- Nearest support / resistance column: true
- Symbol/timeframe pairs evaluated per timer tick (1..20): 8
- Volume confirmed: break bar tick volume / 20-bar average at least: 1.5
Table
- Stage filter shown first: All stages
- Direction filter shown first: Both directions
- Table rows per page (5..30): 18
- Click on a row: Switch this chart to it (or: Open it in a new chart)
Display
- Panel language: English (12 languages; also switchable on the panel)
- Panel X / Y, pixels from the top-left corner: 10 / 30
- Draw the pattern of this chart's symbol and timeframe: true
Alerts
- Alert: pattern completed (waiting for the breakout): true
- Alert: breakout: true
- Alert: retest of the broken line: true
- Alert: confirmed after the retest: false
- Alert: candlestick pattern: false
- Also send a push notification: false
Quick start
- Attach the indicator to any chart. It scans your Market Watch (up to 60 symbols) on M15, H1, H4 and D1.
- Pick your language with the button at the top right.
- Turn timeframes on or off with the buttons under the title.
- Click a tile or a stage button to list only breakouts, retests or confirmations, and a direction button for bullish or bearish only.
- Click a row to open that chart. Rest the mouse on a row for its levels.
FAQ
Which symbols does it scan?
The source you choose: Market Watch, all tradable symbols on the server (Market Watch first), or your list. 60 by default, up to 150. In the Market Watch and all-symbols modes the chart's own symbol is always included.
Why does it say "loading"?
The terminal is still downloading or building that symbol's history. The scanner tries again every 3 seconds and does not wait for it.
Why does the table fill up again after I click a row?
MetaTrader reloads an indicator when its chart changes symbol or timeframe, so the scan starts again (a few seconds for 120 pairs). Your language and filters stay. Choose "Open it in a new chart" to keep the scanner chart as it is.
Does it repaint?
A step is decided on a closed bar and does not change while the next bar is forming. A "Forming?" pattern can change or vanish on a later bar, because its newest point is not confirmed yet. Rows also leave the table when a pattern expires or a newer pattern of the same pair replaces it.
Does it trade or give buy / sell signals?
No. It places no orders and has no buffers. It lists patterns and their stage; what you do with them is your decision.
Does it work in the Strategy Tester?
Yes, on the tested symbol only.
Trading carries a high risk of loss. This indicator does not predict prices and does not guarantee any result. Chart and candlestick patterns often fail. Use the scanner to find charts worth a closer look, as one part of your own analysis.