Narval
- Indicators
-
Adier Antonio Pereira
 Desenvolvedor com forte raciocínio lógico para criação e aprimoramento de indicadores. Busco parcerias sérias e duradouras com foco em testes, otimizações e evolução contínua de estratégias voltadas para resultados práticos.
 - Version: 1.1
- Updated: 16 September 2026
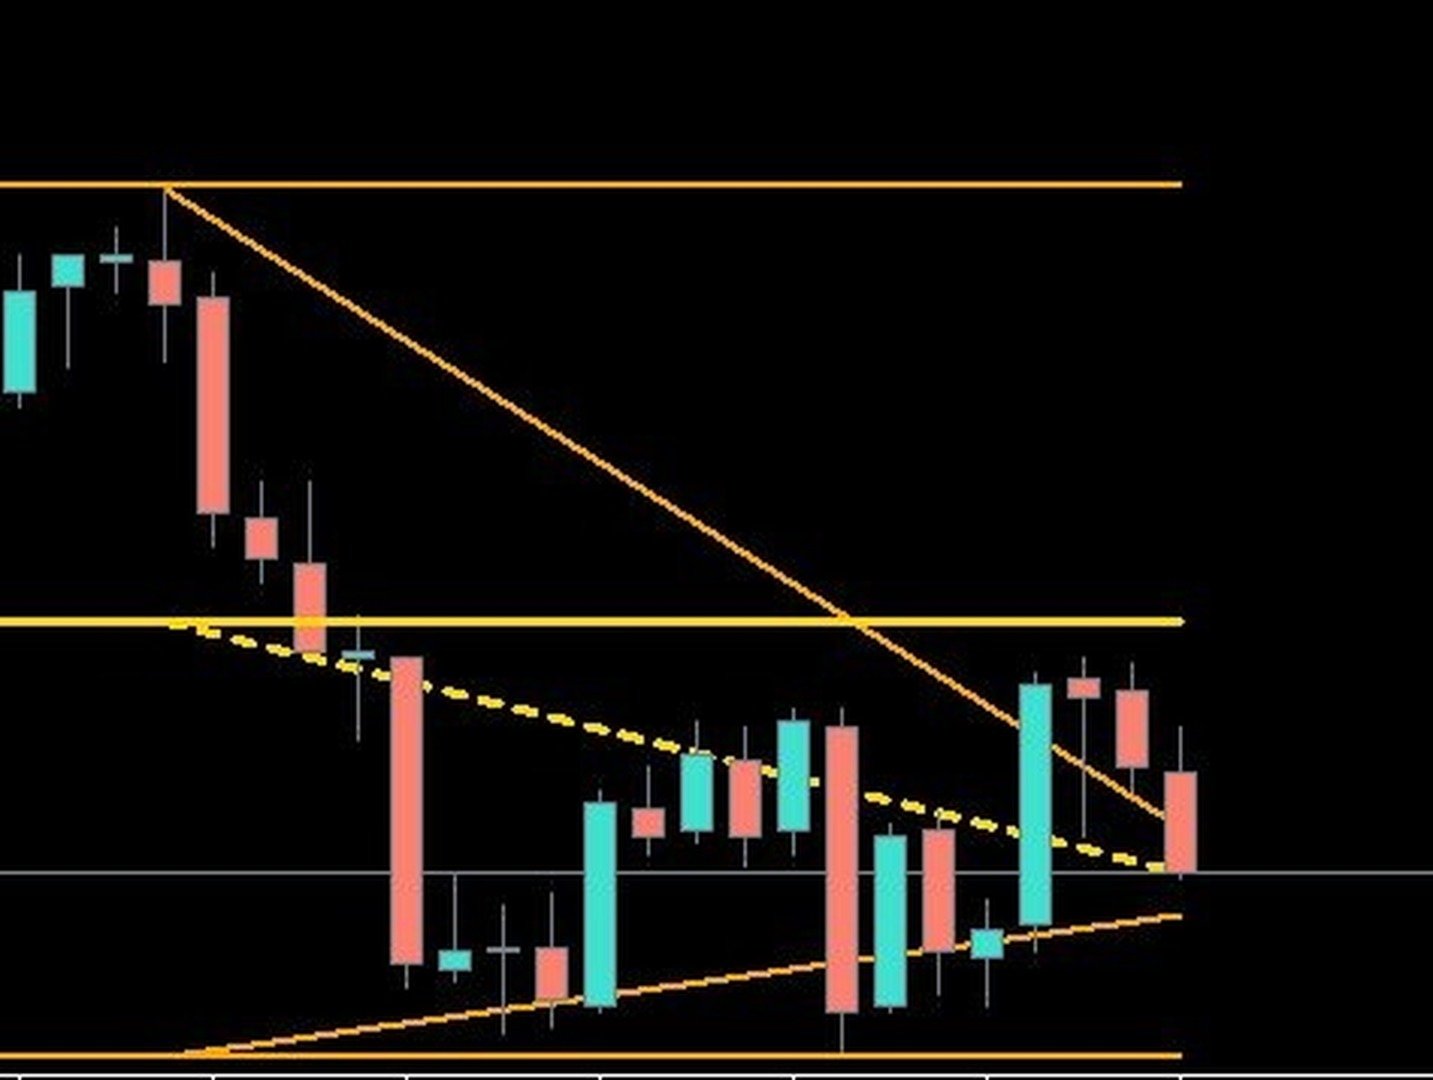
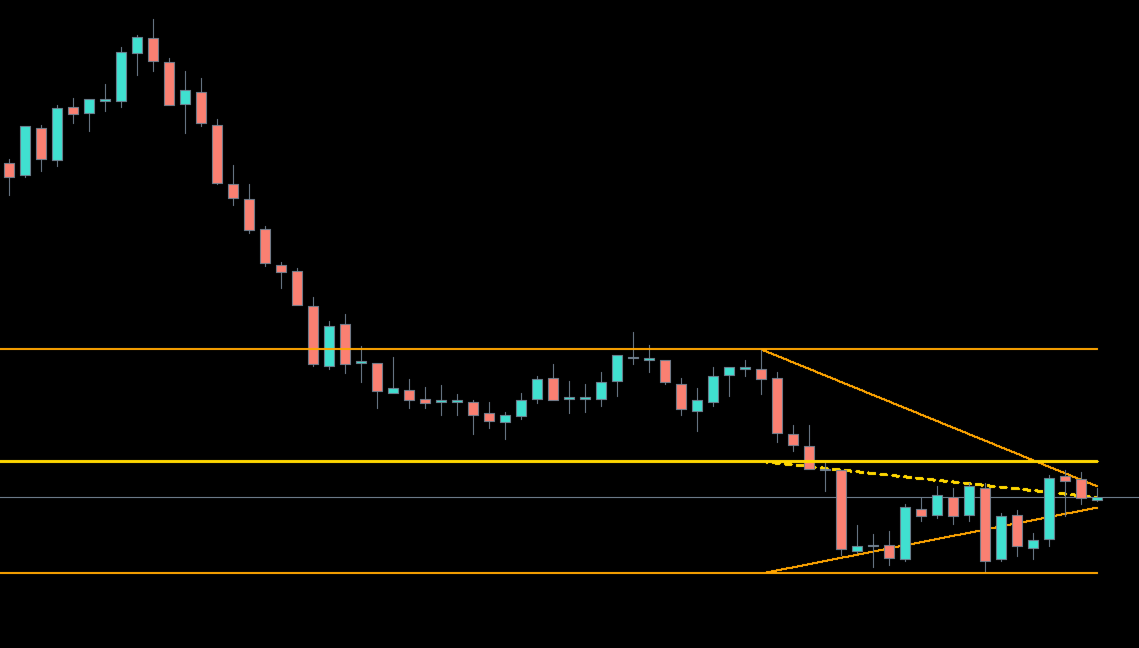
Narval identifies where price is being “squeezed” between the macro and the micro. It does what no conventional indicator does: it creates a pressure field that starts wide in the past and ends calibrated to the current candle.
When price enters this field, it loses strength. This is where Narval looks for the institutional behavior that precedes the breakout: rejection and W/M traps.
What you see on the chart:
The Institutional Check: 3 lines representing the price agreement. The golden line is the midpoint of the agreement, where the market decides whether to continue or reject.
The Intention Points: Narval only plots an arrow when price is INSIDE the check and shows rejection or a structural trap validated by the higher-timeframe hierarchy. No clutter. No signal repainting on closed candles.
It does not tell you to buy or sell. It shows you where the market is vulnerable and marks the exact moment of exhaustion, so you can execute using your own trigger.
It is a reading, not a formula. The internal calibration, progression, and positioning calculation is proprietary and protected, based on wave methodology and 50%.