IMD Gold EA
- Experts
- Version: 1.40
- Updated: 29 September 2026
- Activations: 10

Recommended preset settings: download
Chat for discussing the robots in the team: join
Real-time robot signals: open
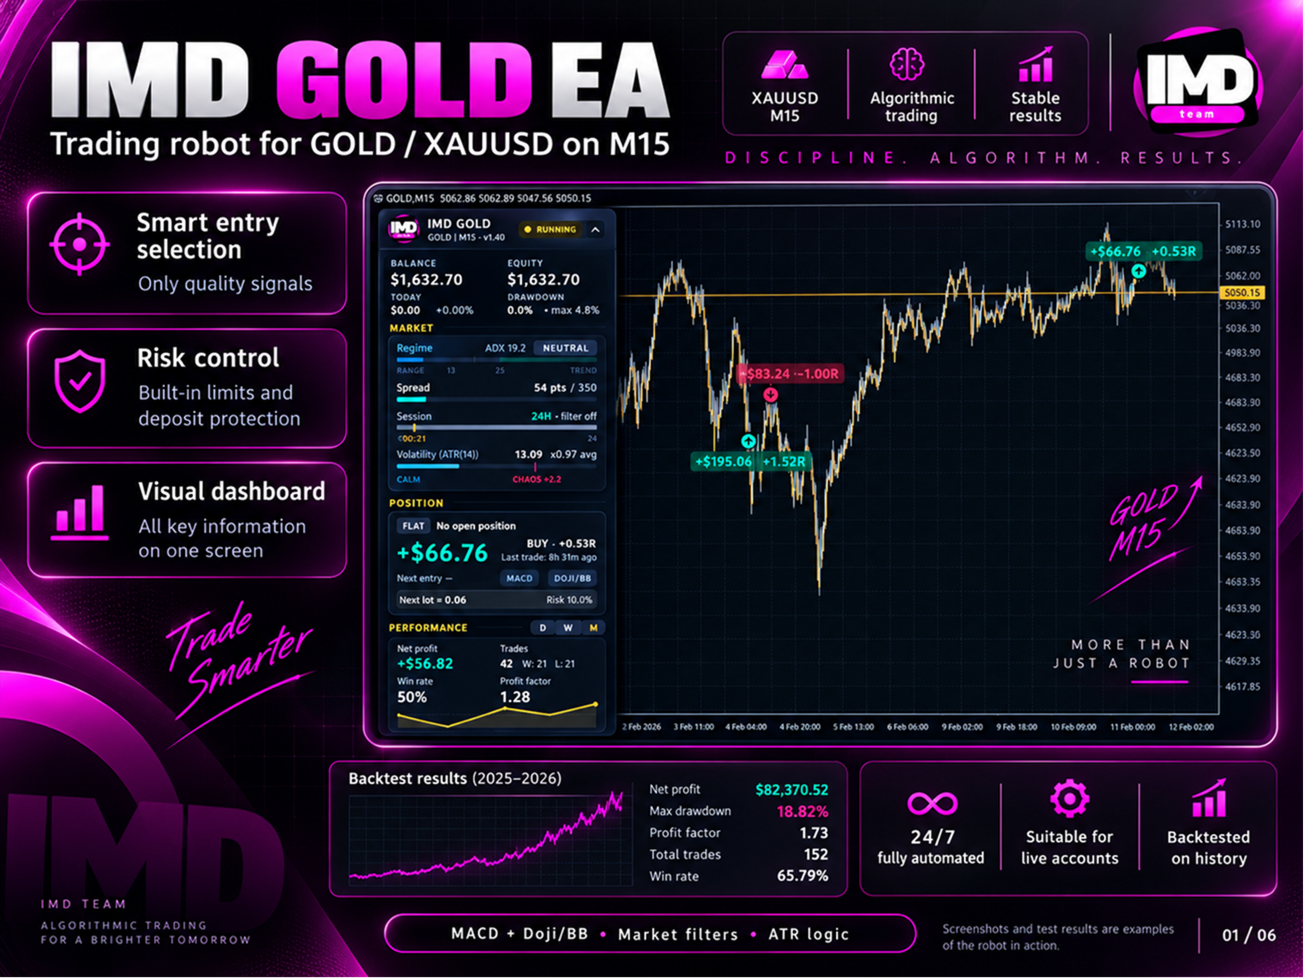
Gold is one of the most demanding instruments for algorithmic trading: calm trending movements are regularly replaced by sharp sideways action, followed by spikes of chaotic volatility on news releases. A strategy that works perfectly in a trend usually loses its effectiveness in a flat market, and vice versa. This is exactly the problem that IMD Gold EA solves.
The Expert Advisor for MetaTrader 5 is created specifically for trading gold (XAUUSD) on the M15 timeframe. Instead of a single fixed strategy, it uses built-in market regime analysis: the EA independently determines whether the market is in a trend, in a range, or in a state of high chaos, and selects the appropriate entry algorithm. You do not need to manually switch settings when the market character changes or stare at the chart for hours: the EA handles this on every new candle.
How it works
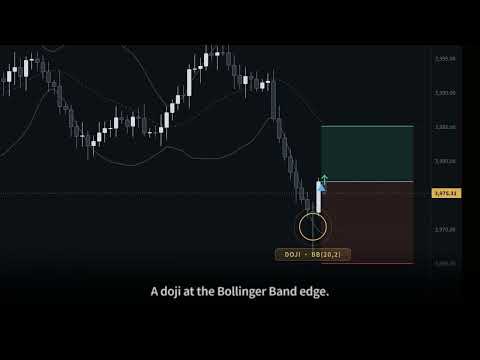
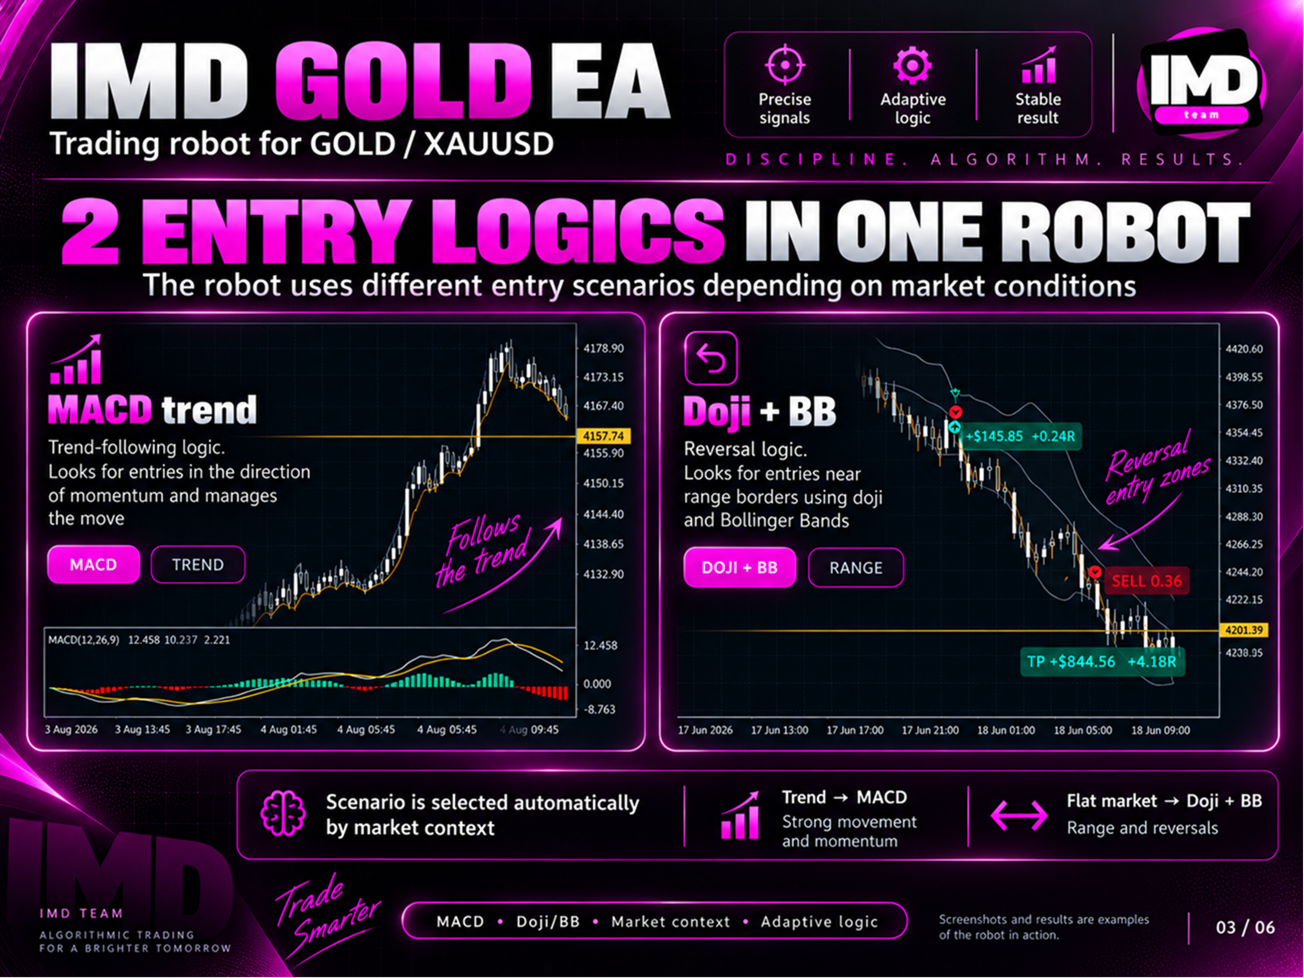
- in an uptrend, it looks for a buy entry point on a "doji" reversal pattern at the lower boundary of the Bollinger Bands;
- in a downtrend, it enters a sell position on a MACD line crossover;in a sideways market (flat), it tracks reversals at both boundaries of the Bollinger Bands and opens trades in both directions;
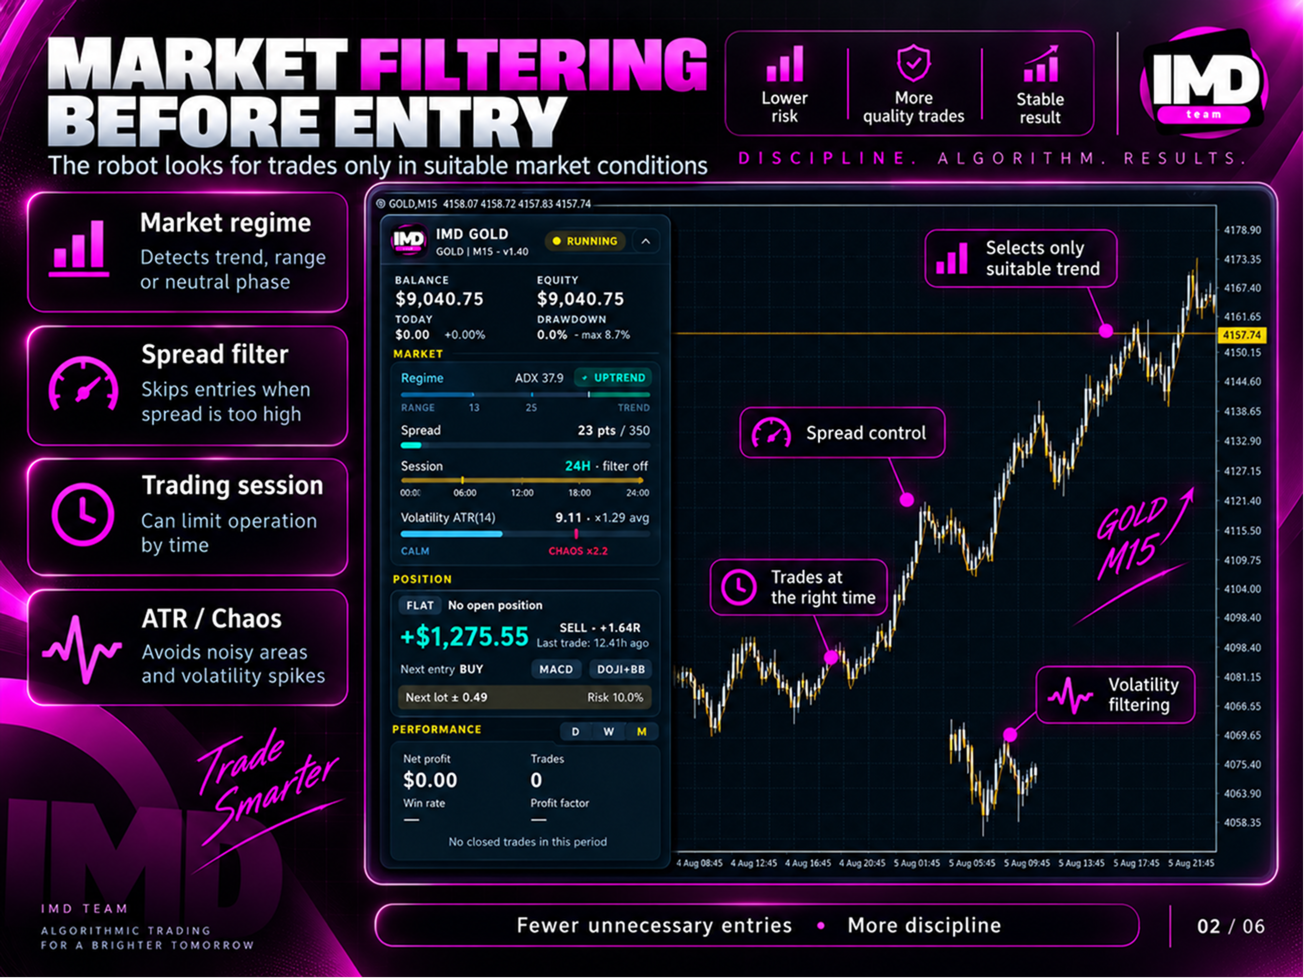
- during a sharp spike in volatility above normal levels, the EA simply does not trade, staying away from unpredictable movements until the market calms down.
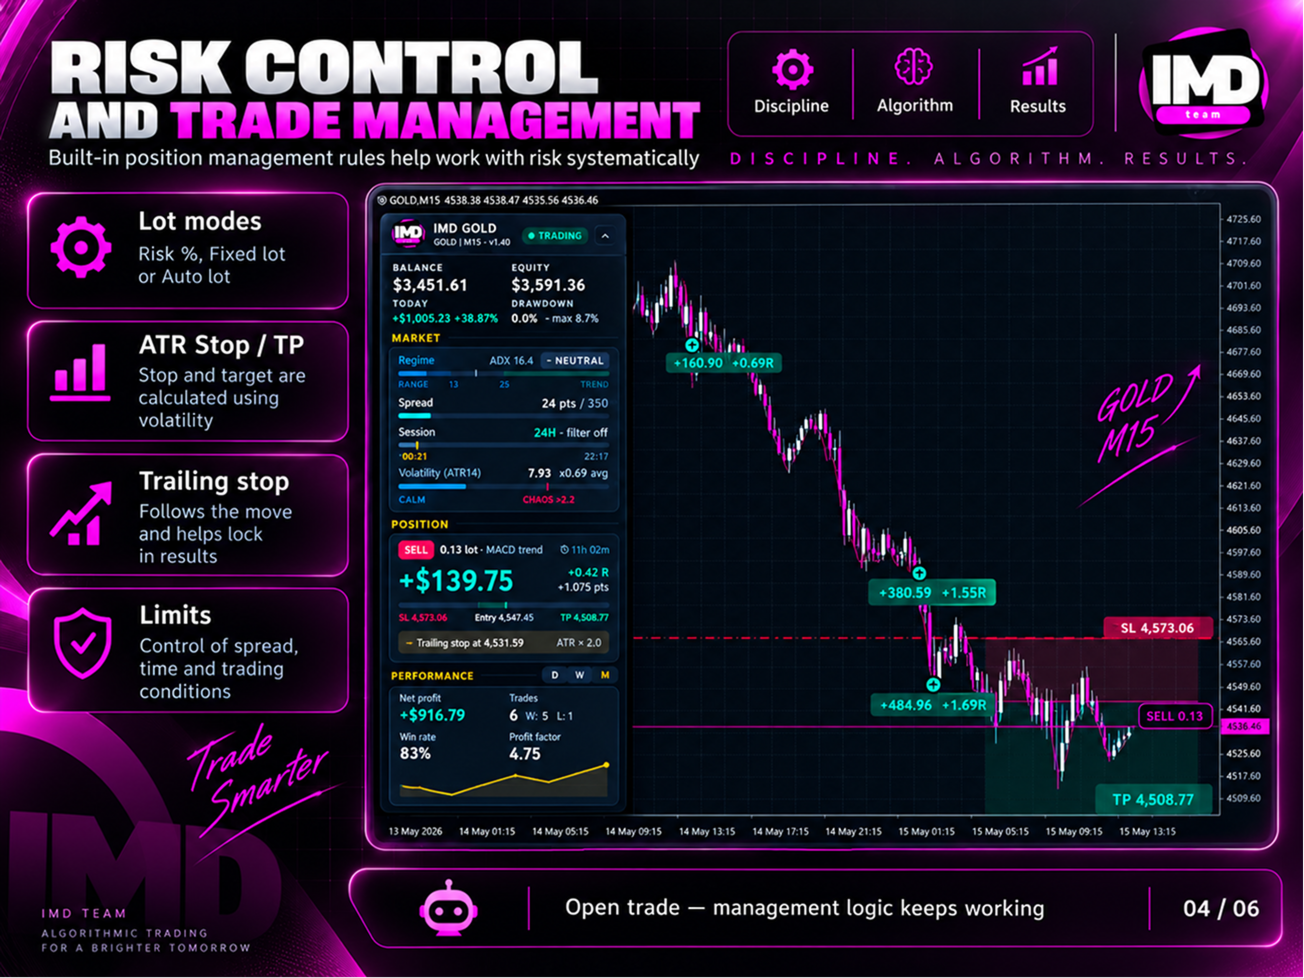
The stop-loss and take-profit of each trade are calculated in ATR values, so the levels automatically adjust to the current volatility of gold rather than remaining static in pips. For trending positions, a trailing stop additionally works, pulling the trade protection along with the price.
What you get
- an EA without martingale, where every trade is protected by a stop-loss;
- ready-made decision-making logic that does not require manual intervention during the trading day;
- flexible position volume management — by risk percentage of the balance, fixed lot, or proportional to the deposit size, fitting any money management style;
- spread and trading session filters, shielding you from entries in unfavorable market conditions;
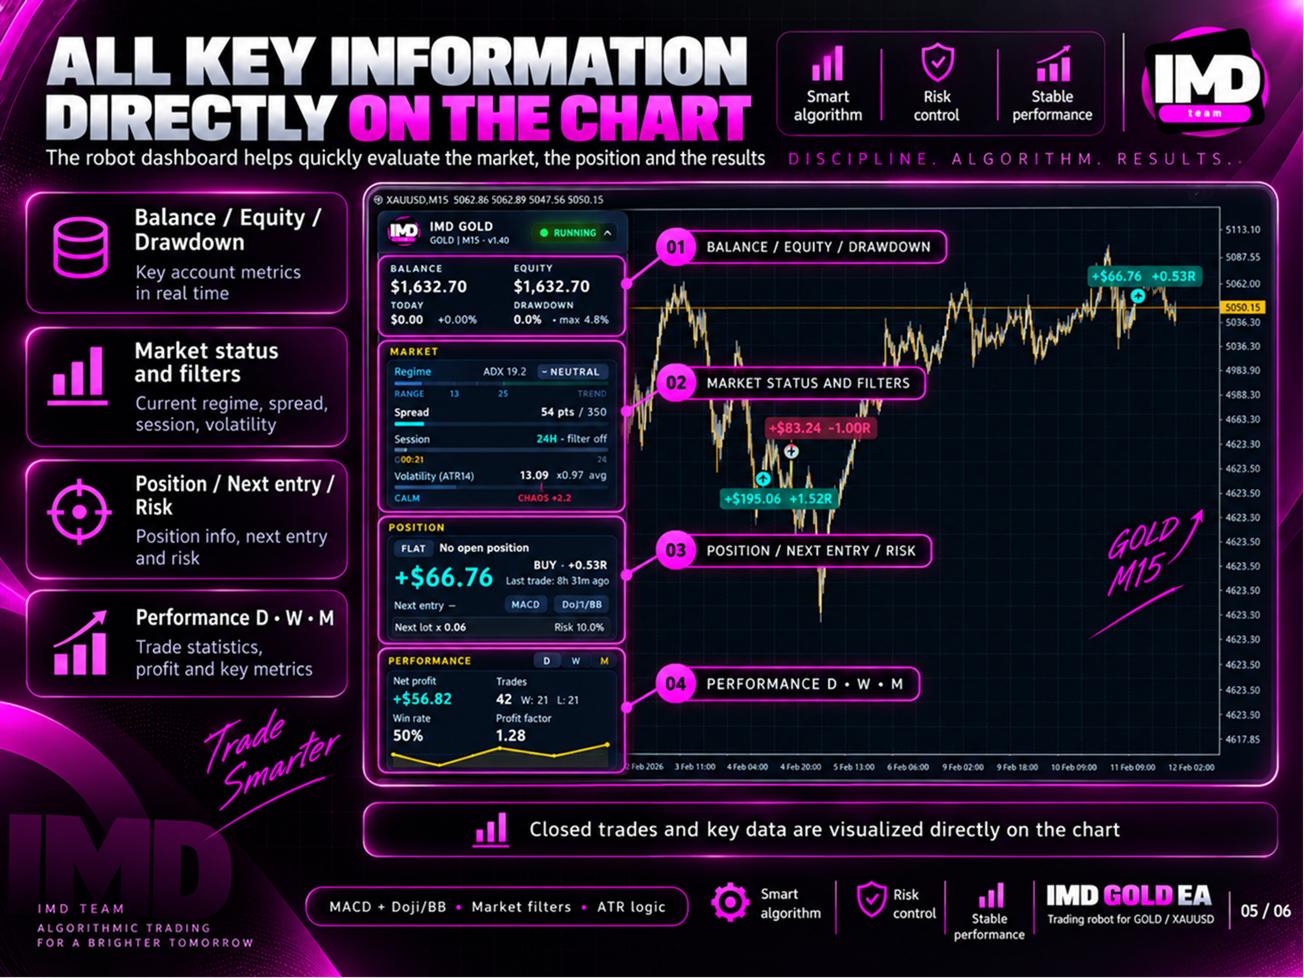
- a clear information panel directly on the chart — current market regime, volatility, spread, and position status are visible in real time, without switching between windows;
- a complete EA operation log with the ability to save to a file — convenient for analysis and control.
- general settings — EA identifier (magic number), acceptable spread, trading hours;
- position volume management — choice of three lot calculation modes;
- market regime detection — sensitivity to trend and volatility;
- trending trade parameters — stop-loss, take-profit, trailing stop, MACD settings;
- sideways trade parameters — "doji" recognition conditions and Bollinger Bands settings;
- logging — level of detail for records.
This allows you to customize the EA to your own risk perception without touching the source code.
Before you start
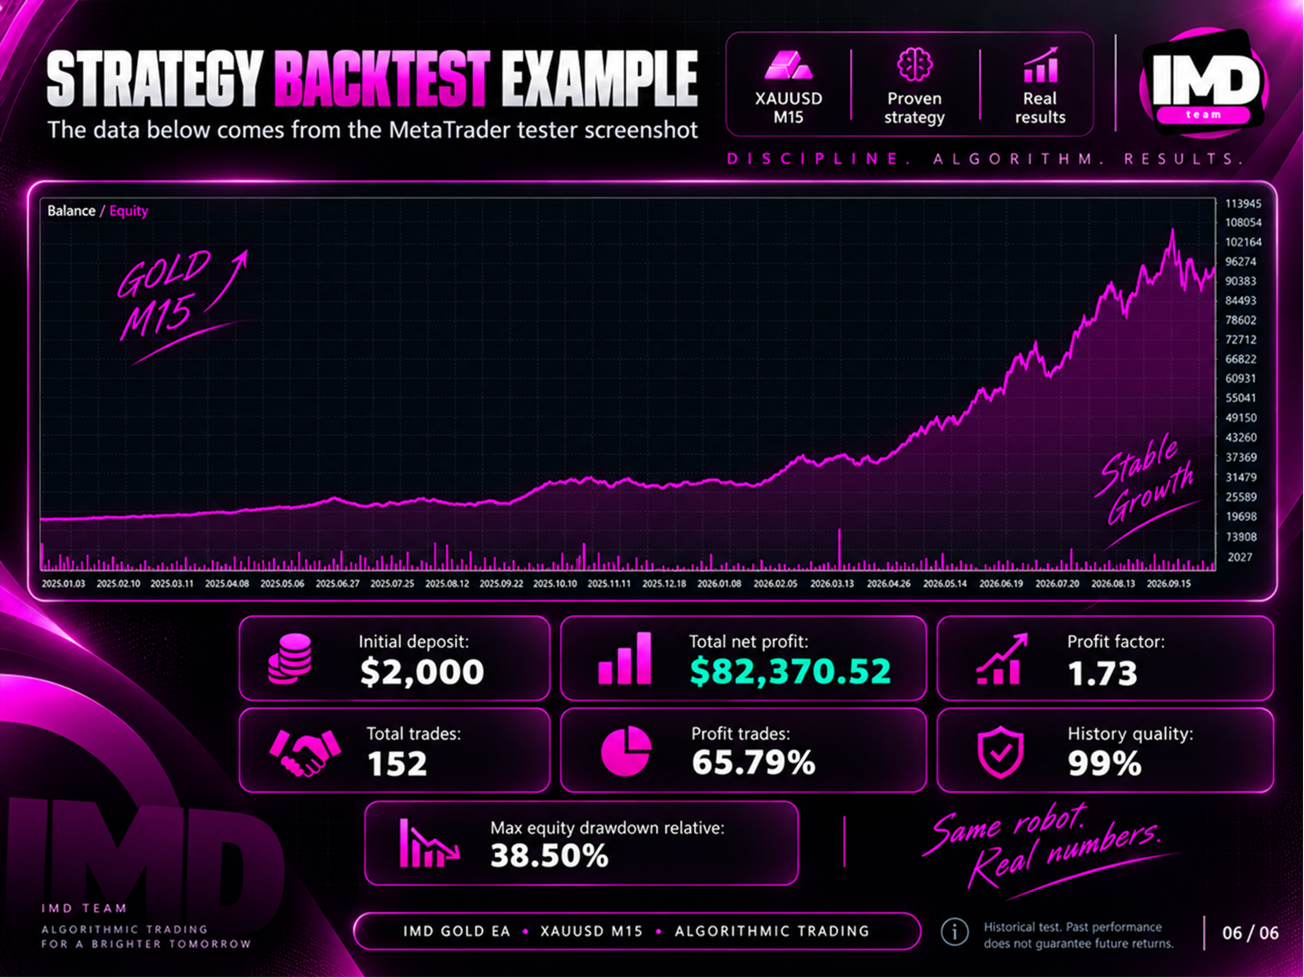
Like any trading in financial markets, working with the EA involves the risk of losing part or all of the invested funds, and results on historical data do not guarantee the same results in the future. Approach risk settings consciously — and the EA will take over the routine of further trade management.
Support