Prop Volume Profile
- Indicators
- Version: 1.10

PROP VOLUME PROFILE
====================
Cumulative Volume Profile for MetaTrader 5
--------------------------------------------
Prop Volume Profile shows you where price has spent the most time and
volume over the selected period - directly on your chart, in a clean
vertical profile on the right edge.
One glance tells you the "fair value" zone, the strongest price level,
and whether the current price is stretched far above or below where
the market actually trades.
HIGHLIGHTS
----------
- Cumulative volume profile built from M1 data (the finest granularity,
which contains all timeframes), regardless of the chart timeframe.
- Selectable history period: month (default), week, day, H4, H1 or M30 -
the profile always adapts to the period you are trading.
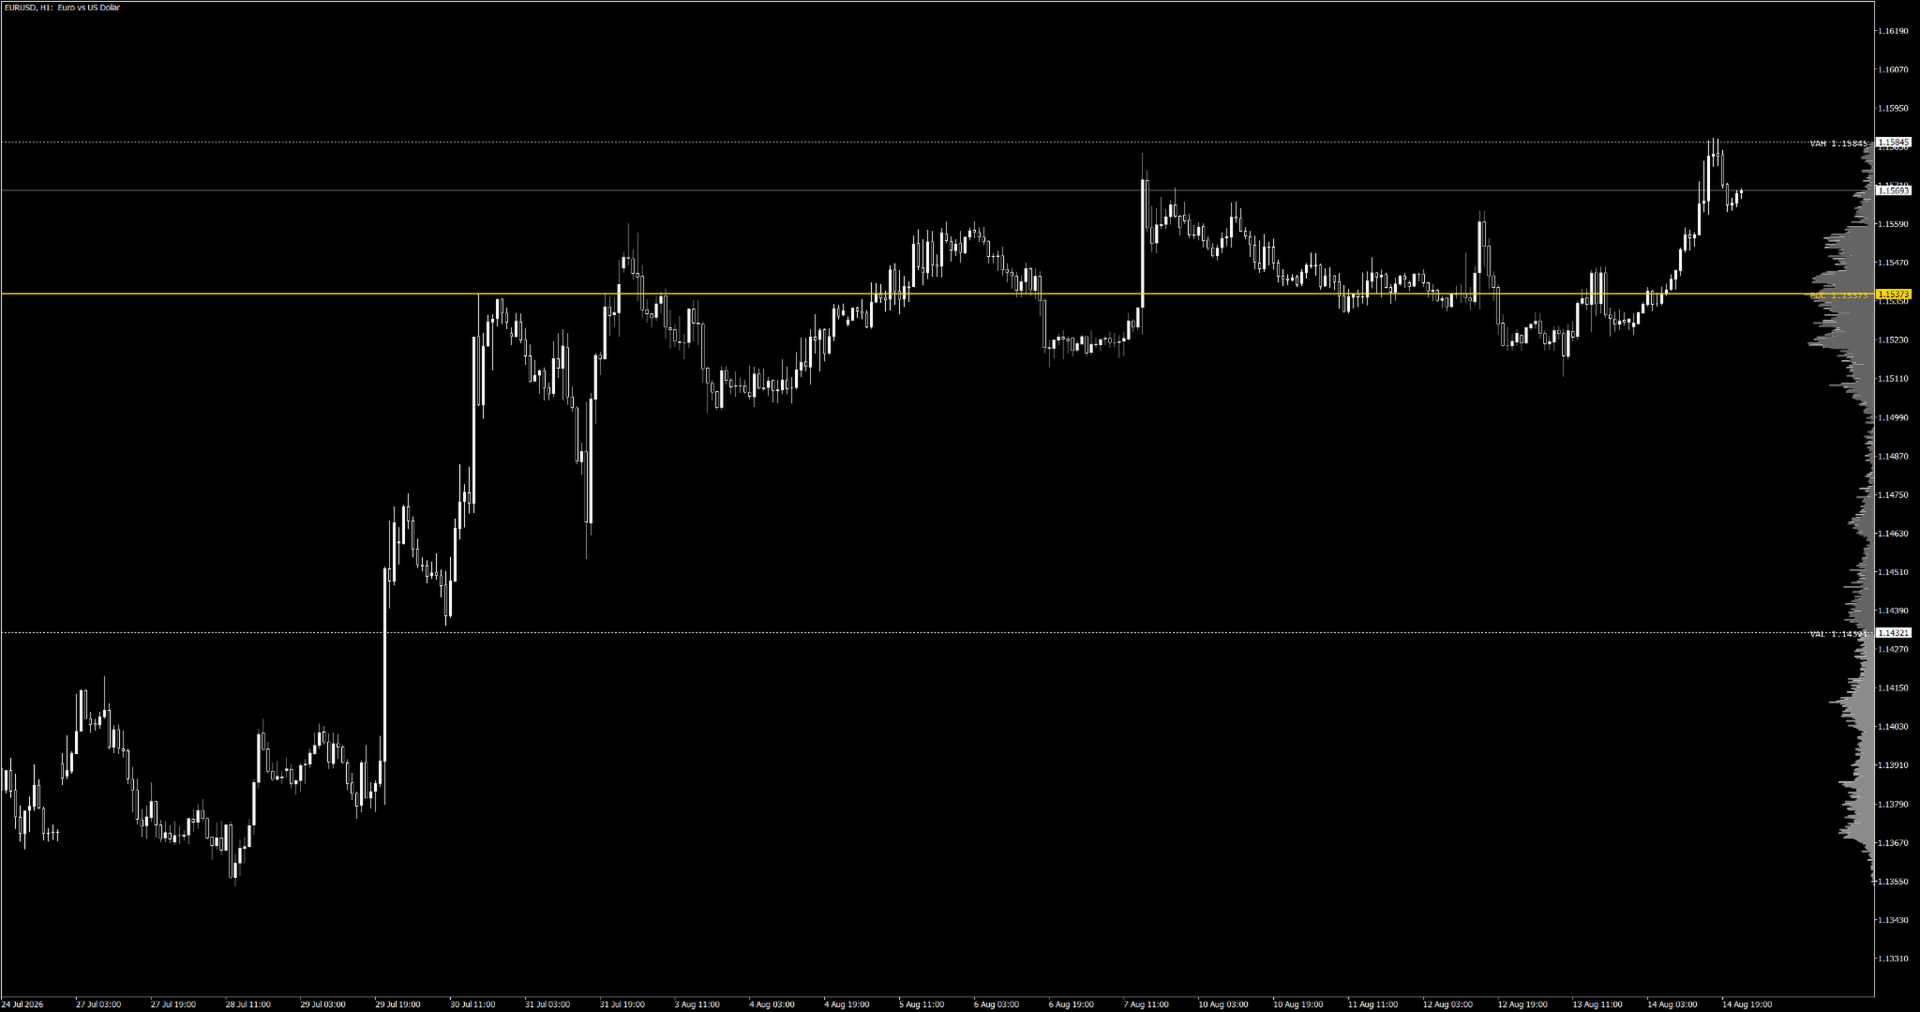
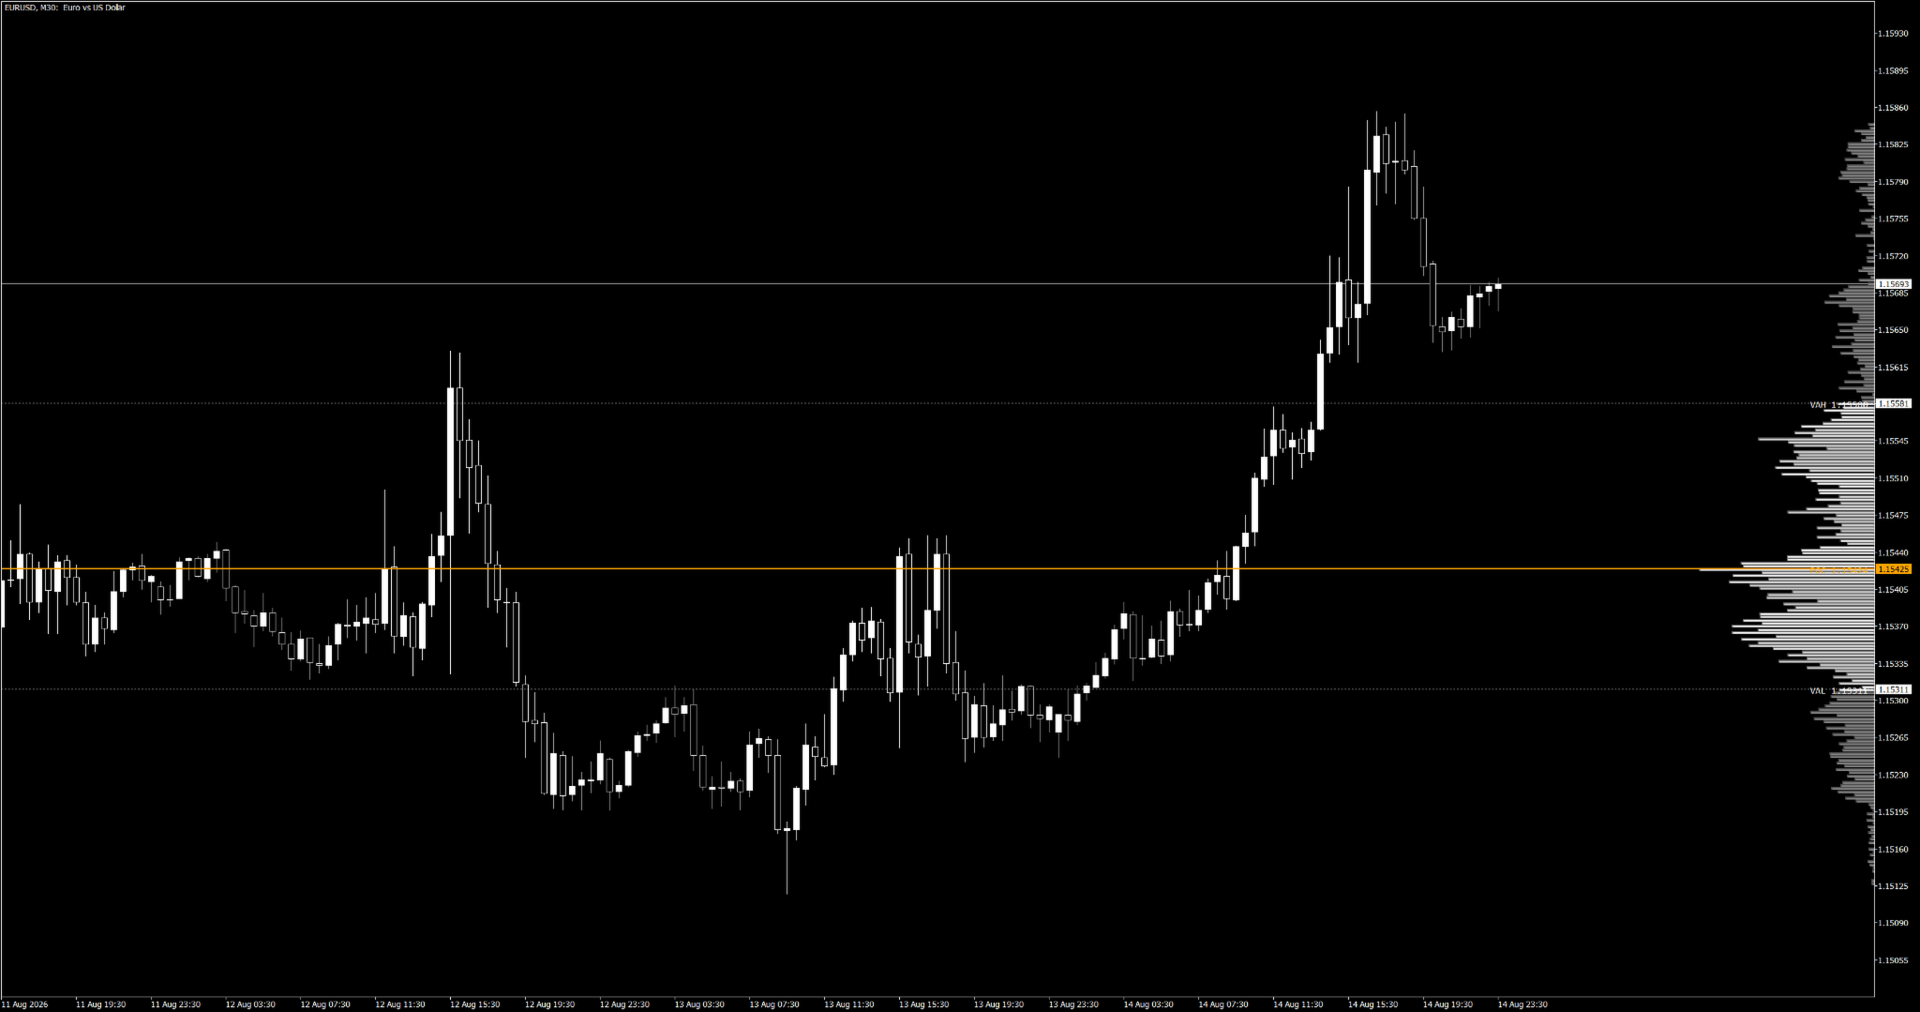
- POC (Point of Control) - the strongest price level - highlighted
with a yellow line.
- Value Area High / Low (VAH / VAL) shown with white lines.
- Value area drawn in white, the rest of the profile in gray - the
fair-value zone is visible instantly.
- Profile is anchored to the right edge of the chart and adapts to
zoom, scroll and window size.
- Lightweight and optimized; adjustable refresh rate.
- Works on any symbol and any timeframe (M1 - D1).
- Simple, clean interface. Informational tool only - it does not trade.
HOW TO USE
----------
1. Attach Prop Volume Profile to any chart (e.g. EURUSD H1).
2. Choose the history period in the settings (Month / Week / Day / H4 /
H1 / M30) - Month is the default.
3. The profile appears on the right edge of the chart.
4. Read the levels:
- POC = the level with the highest traded volume. Strong
support/resistance, "the market's anchor".
- VAH / VAL = borders of the value area (default 70% of volume).
- Price tends to return to the value area. Above VAH = stretched
up, below VAL = stretched down.
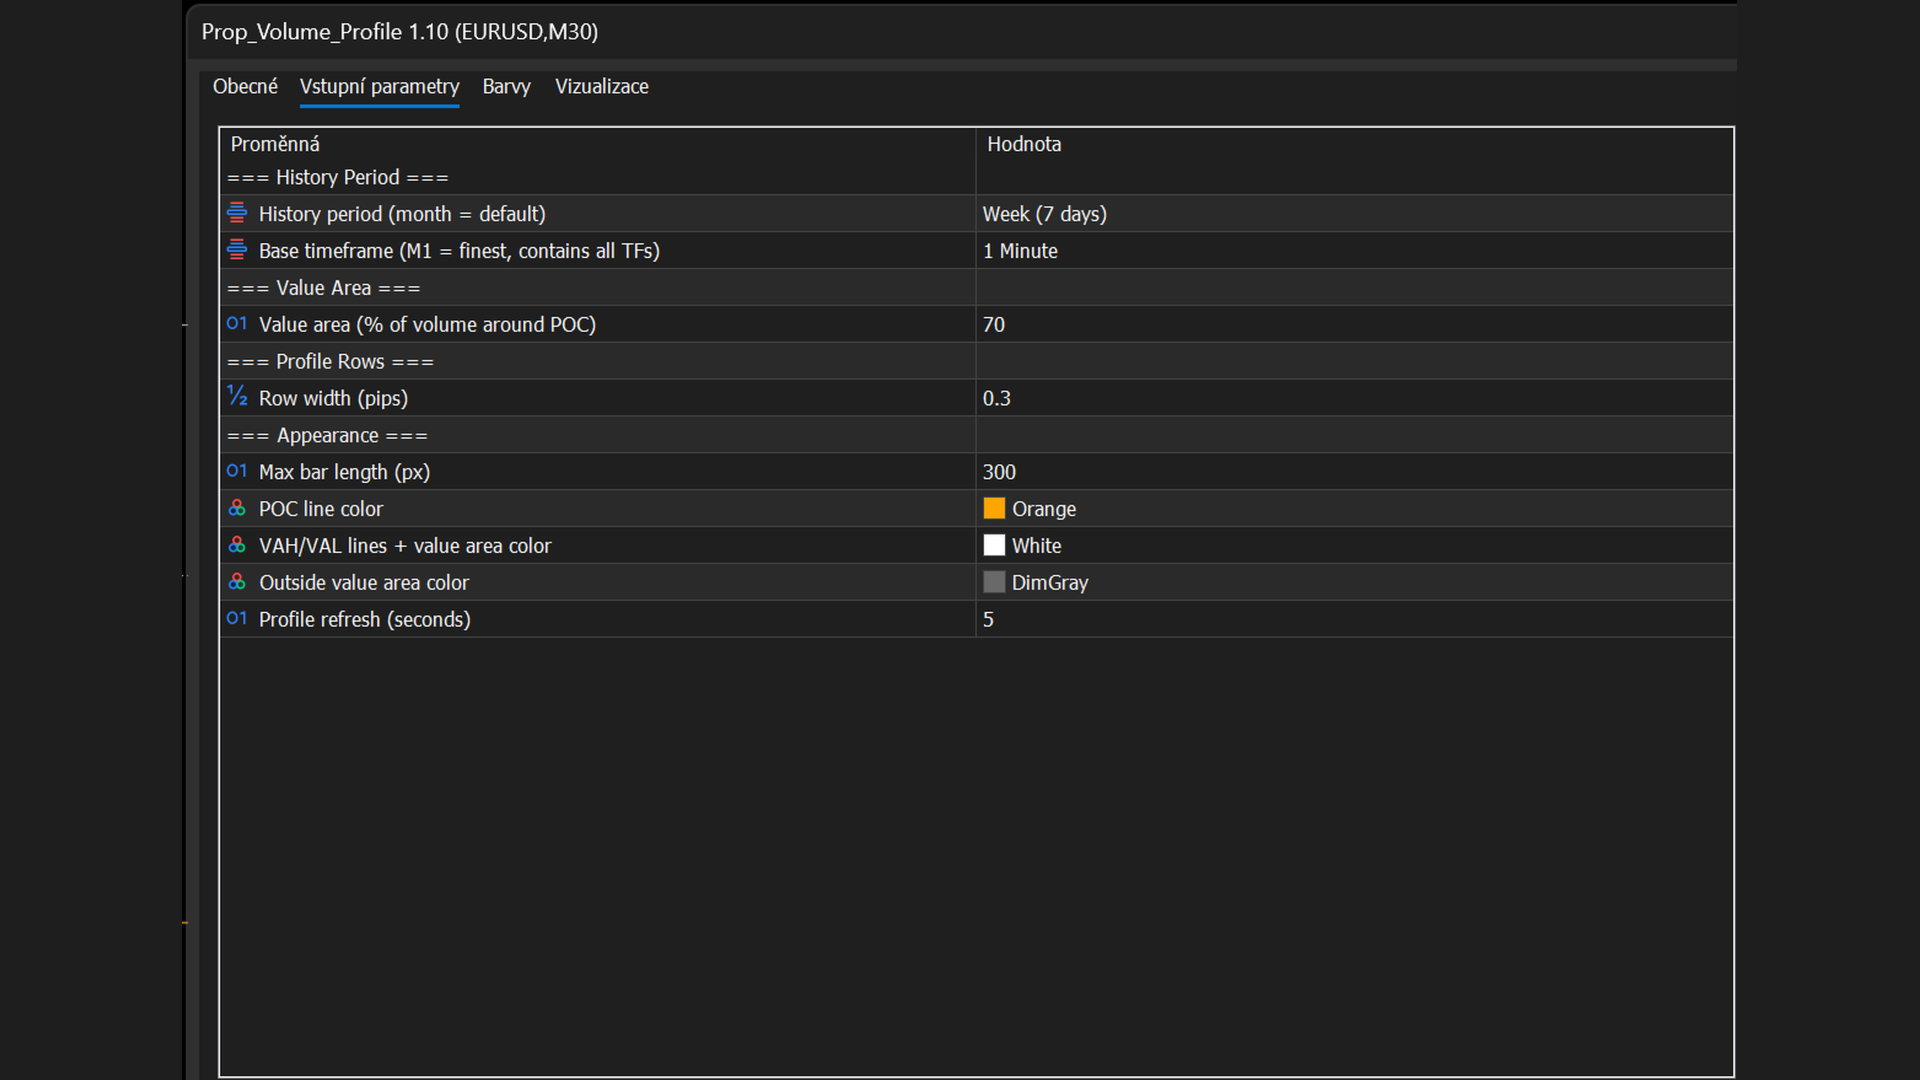
SETTINGS
--------
History Period
History period................... Month (default) / Week / Day /
H4 / H1 / M30
Base timeframe................... M1 (finest, contains all TFs)
Value Area
Value area (% of volume)......... 70
Profile Rows
Row width (pips)................. 1.0
Appearance
Max bar length (px).............. 120
POC line color.................. yellow
VAH/VAL lines + value area...... white
Outside value area.............. gray
Profile refresh (seconds)........ 5
INTERPRETATION QUICK GUIDE
--------------------------
- Price above VAH: demand is exhausted in the short term; watch for
a return into the value area.
- Price below VAL: sellers dominate; a bounce back into the value area is common.- POC acts as a magnet and as support/resistance - watch reactions
when price revisits it.
- When price stays inside the value area, the market is balanced.
Prop Volume Profile is an educational/analytical tool and does not
constitute investment advice. Always manage your risk.