Tick Analyzer Pro
- Utilities
-
Nauris Zukas
 University of Latvia — Professional Bachelor’s Degree in Finance Management
Steinbeis University — Master of Business Administration (MBA)
Trading Forex since 2001.
Developing EAs since 2005.
Third place winner in Automated Trading Championship 2008. - Version: 1.1
- Updated: 19 May 2026
- Activations: 10
TICK ANALYZER PRO – Professional Tick-Level Analysis
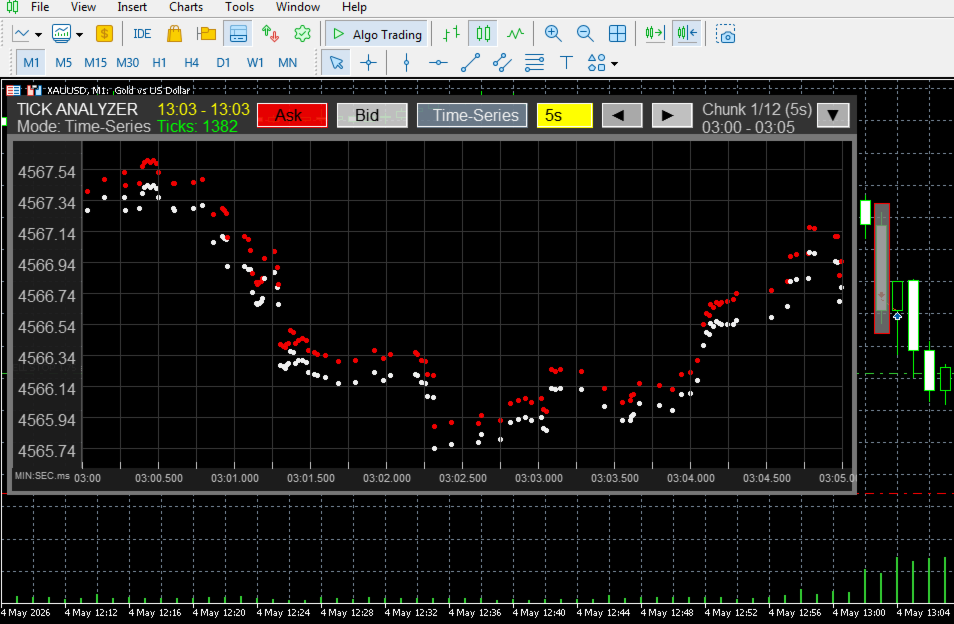
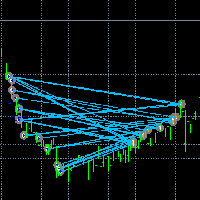
Real-time tick visualization tool for M1 charts. Analyze bid/ask spreads, tick patterns, and market microstructure at millisecond precision.
From my professional trading experience, I have always deeply analyzed tick data to truly evaluate price action at key market levels. Understanding slippage during position entry and exit is crucial, especially when developing robust Expert Advisors (EAs) or execution models for manual trading.
A simple slippage detection tool only tells you that it happened, but it doesn't explain the underlying process of how it formed. Standard native analysis usually requires manually pulling data from the Symbols panel, exporting specific periods, and transferring them to external tools like Excel just for basic visual correlation. Anyone who has ever deeply dug into market microstructure knows how time-consuming this workflow can be.
That is why I created Tick Analyzer Pro—to completely streamline this analysis directly on the live chart.
Disclaimer: I understand that for the vast majority of retail traders, this utility might seem redundant or overly complex. I am publishing it here primarily to archive and preserve my most valuable tools outside my local MT5 platform, and with the hope that it will save time for the few professionals who truly understand the value of order flow and tick mechanics.
Key Features:-
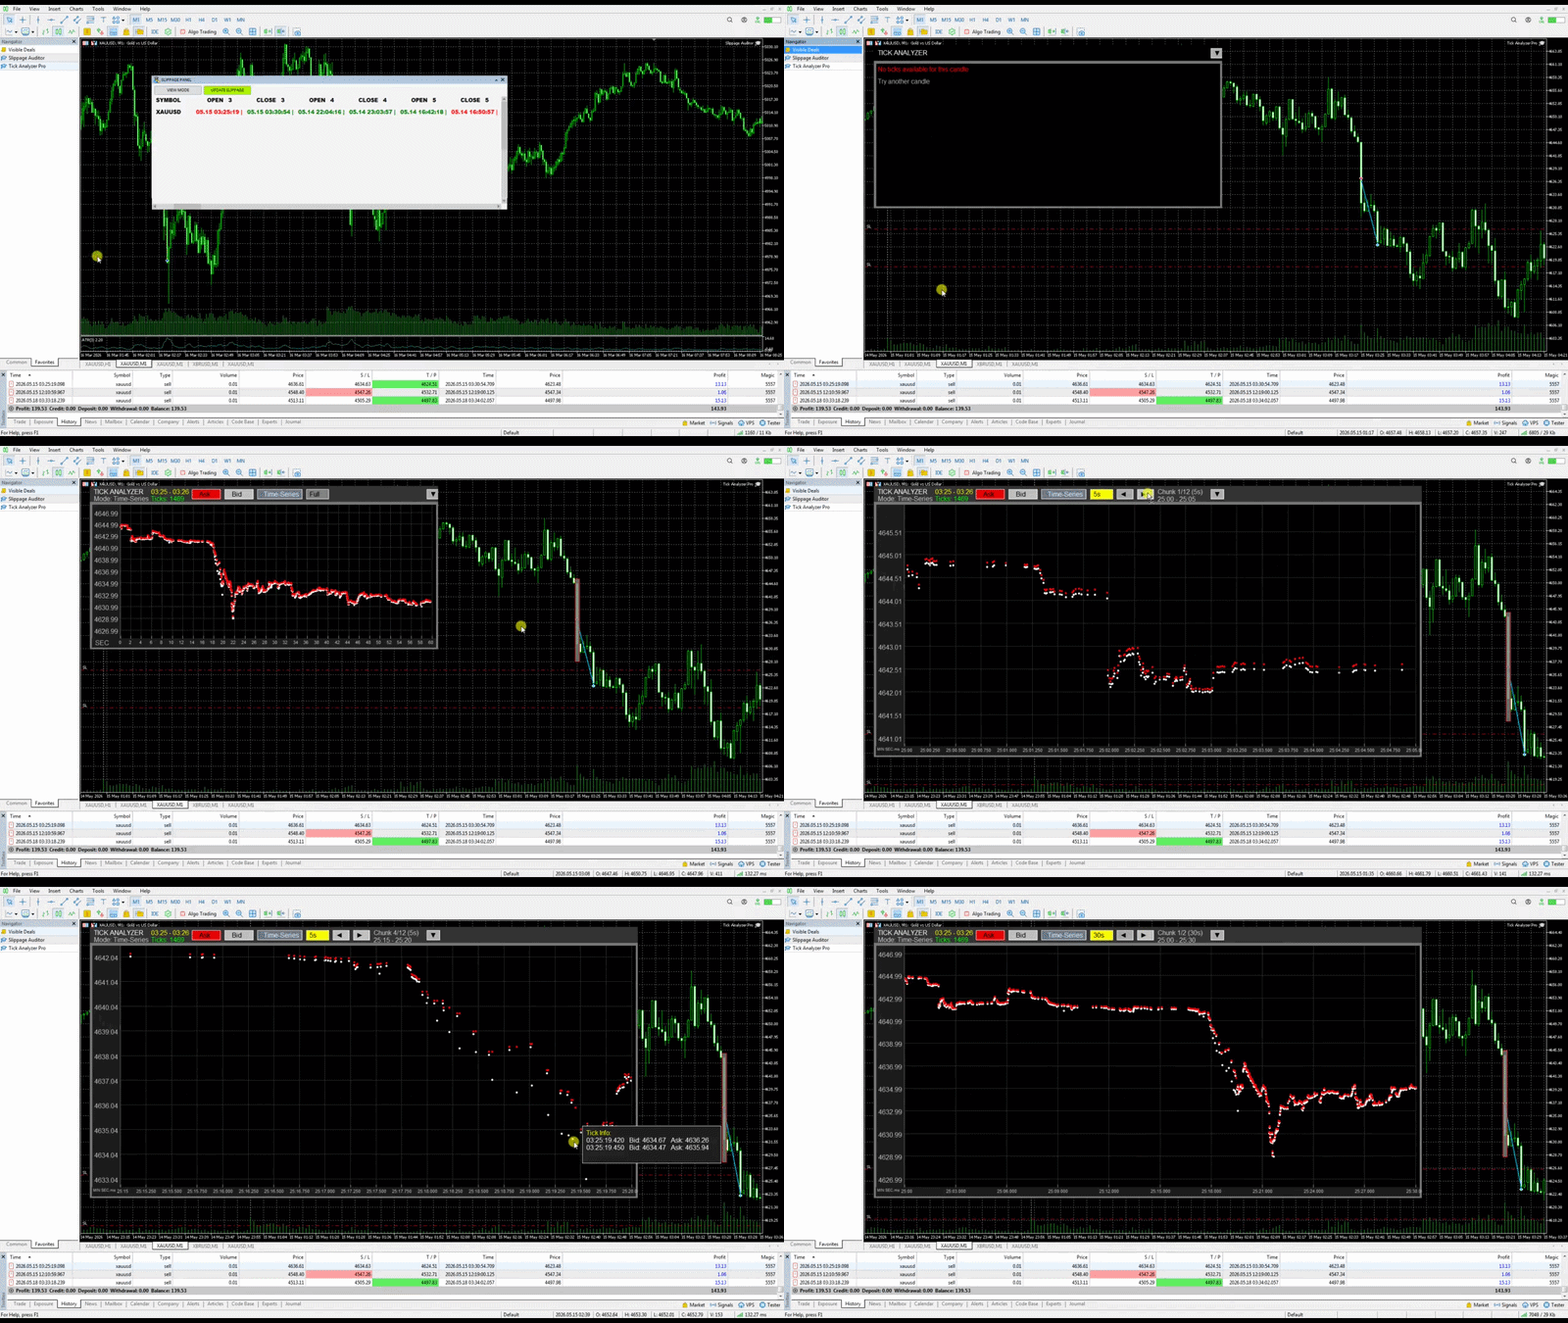
Dual Display Modes: Toggle between Time-series and Ordinal tick display modes for different analytical perspectives.
-
Adjustable Time Chunks: Segment tick data into precise time buckets (5s, 10s, 15s, 20s, and 30s intervals).
-
Advanced Visualization: Bid/Ask price tracking with independent visibility toggles.
-
Dynamic Price Grid: Built-in grid system with configurable minimum gridlines for precise scale tracking.
-
Interactive Interface: Hover over bars to view detailed tooltip data on the fly.
-
Workspace Optimization: Fully resizable, draggable UI panel with a quick minimize function to keep your charts clean.
-
Contextual Analysis: Secondary candle highlighting to correlate tick movement with standard price bars.
-
Scalping Strategy Development: Perfecting entries based on micro-movements.
-
Spread & Slippage Analysis: Tracking liquidity dynamics during high volatility.
-
Order Flow Study: Visualizing market microstructure and volume absorption.
-
HFT & Algorithmic Research: Backing up EA logic with raw tick behavior data.
-
Must be applied to M1 charts only.
-
Requires active Tick History data from your broker.
FOR PROFESSIONAL TRADERS ONLY
Useful Resources:"Free Trading Tools Alerts" - Temporary free EA releases. Subscribe so you don't miss the next one.