Trade Insight Analytics Dashboard
- Utilities
-
Kayode Michael Oyetunde
 Hi! I’m a Data Analyst and MQL5 Developer. Whether you have a question about my existing products or need a custom MT4/MT5 tool built from scratch, I’m here to help. Feel free to reach out!
 - Version: 1.0
- Activations: 10
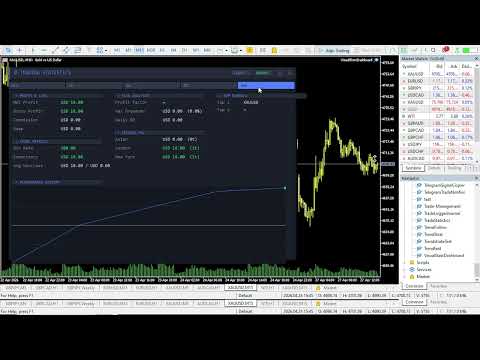
Trade Insight Dashboard is a utility tool for MetaTrader 5 that presents trading statistics in a structured and visual format directly on the chart.
It transforms raw trading history into organized data, allowing you to review performance, risk, and activity clearly without relying on external reports.
Key Features
• Structured multi-section dashboard for trading metrics
• Wide performance curve for visual tracking of results
• Flexible time filters for different analysis periods
• Built-in data export to CSV format
• Light and dark display modes
• Scalable interface for different screen resolutions
Clear and Organized Dashboard
The interface uses a horizontal layout designed to reduce chart obstruction while keeping all key information visible.
Trading data is grouped into logical sections:
• Financial metrics – net profit, gross profit, commission, swap
• Trade efficiency – win rate and expectancy
• Risk metrics – profit factor and drawdown
• Session performance – Asian, London, and New York sessions
• Symbol performance – overview of trading instruments
Performance Visualization
A wide performance curve displays changes in trading results over time. This provides a clear visual reference directly on the chart without switching between windows.
Flexible Time-Based Analysis
Analyze your trading activity across multiple periods:
• All history
• 1 month
• 1 week
• 5 days
• 24 hours
All values update instantly when switching between time ranges.
Data Export
The dashboard includes a built-in export function for saving statistics to a CSV file.
• Automatically generates a timestamped file
• Saved in the local MQL5 files directory
• Structured for use in spreadsheet software
Exported data includes:
• Net profit
• Win rate
• Profit factor
• Maximum drawdown
Interface and Display
• Light and dark modes for different environments
• Consistent visual structure across all elements
• Stable rendering with optimized object handling
• Designed to remain clear without interfering with chart activity