ZigZag3LZZ

ZigZag_3LZZ — Üç Seviyeli Zigzag Göstergesi


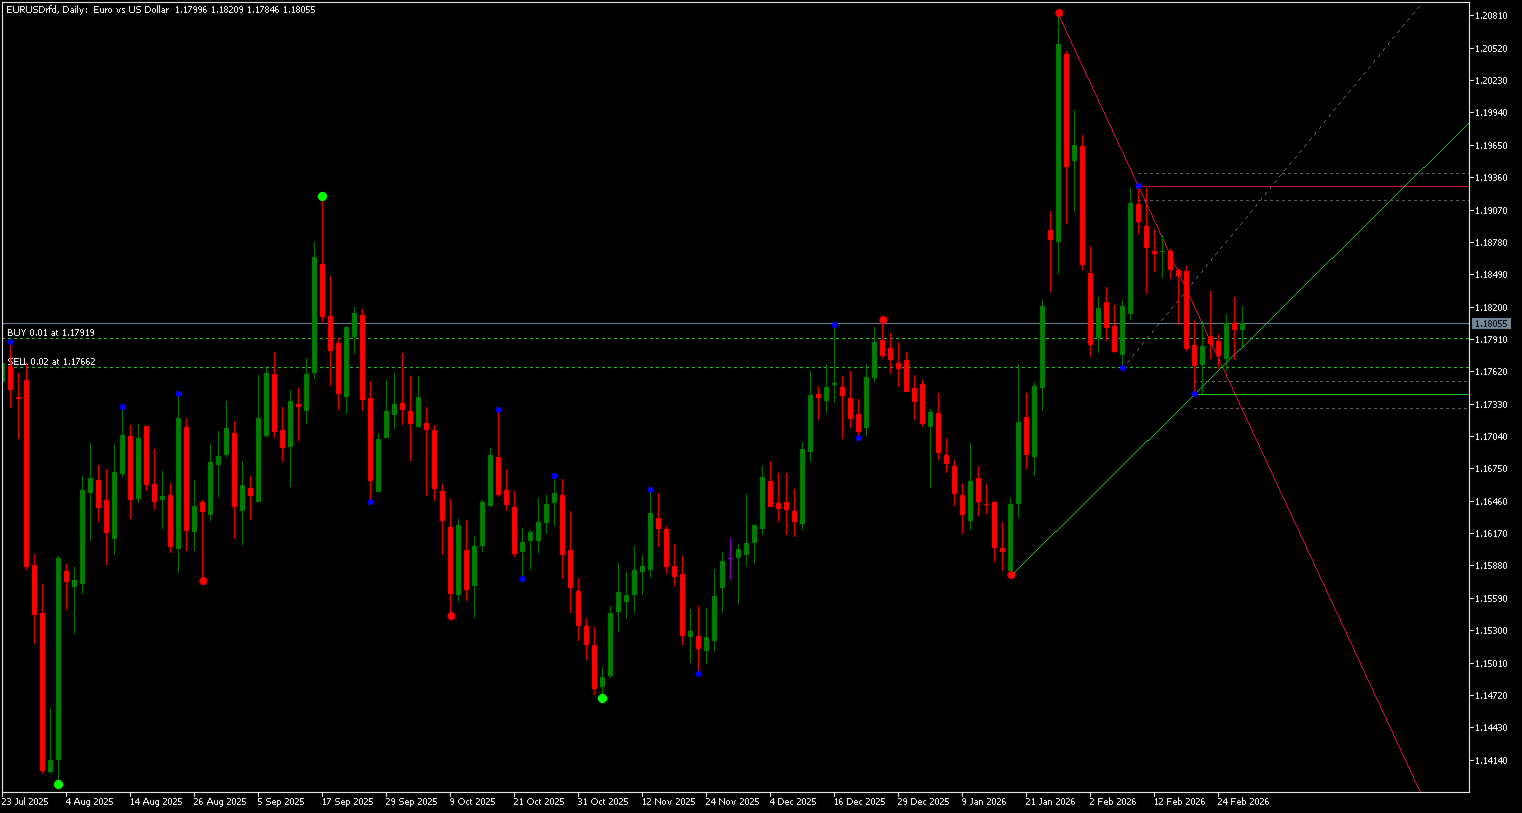
ZigZag_3LZZ göstergesi, finansal piyasaların teknik analizi için tasarlanmıştır. Grafikte farklı periyotlara (5, 13, 34) sahip üç renkli zigzag çizgisi görüntüleyerek yatırımcıya şunları sağlar:

    Önemli fiyat dönüş seviyelerini görsel olarak belirleme

    Önemsiz fiyat dalgalanmalarını ve piyasa gürültüsünü filtreleme

    Son ekstremum noktalarına dayalı trend çizgileri çizme

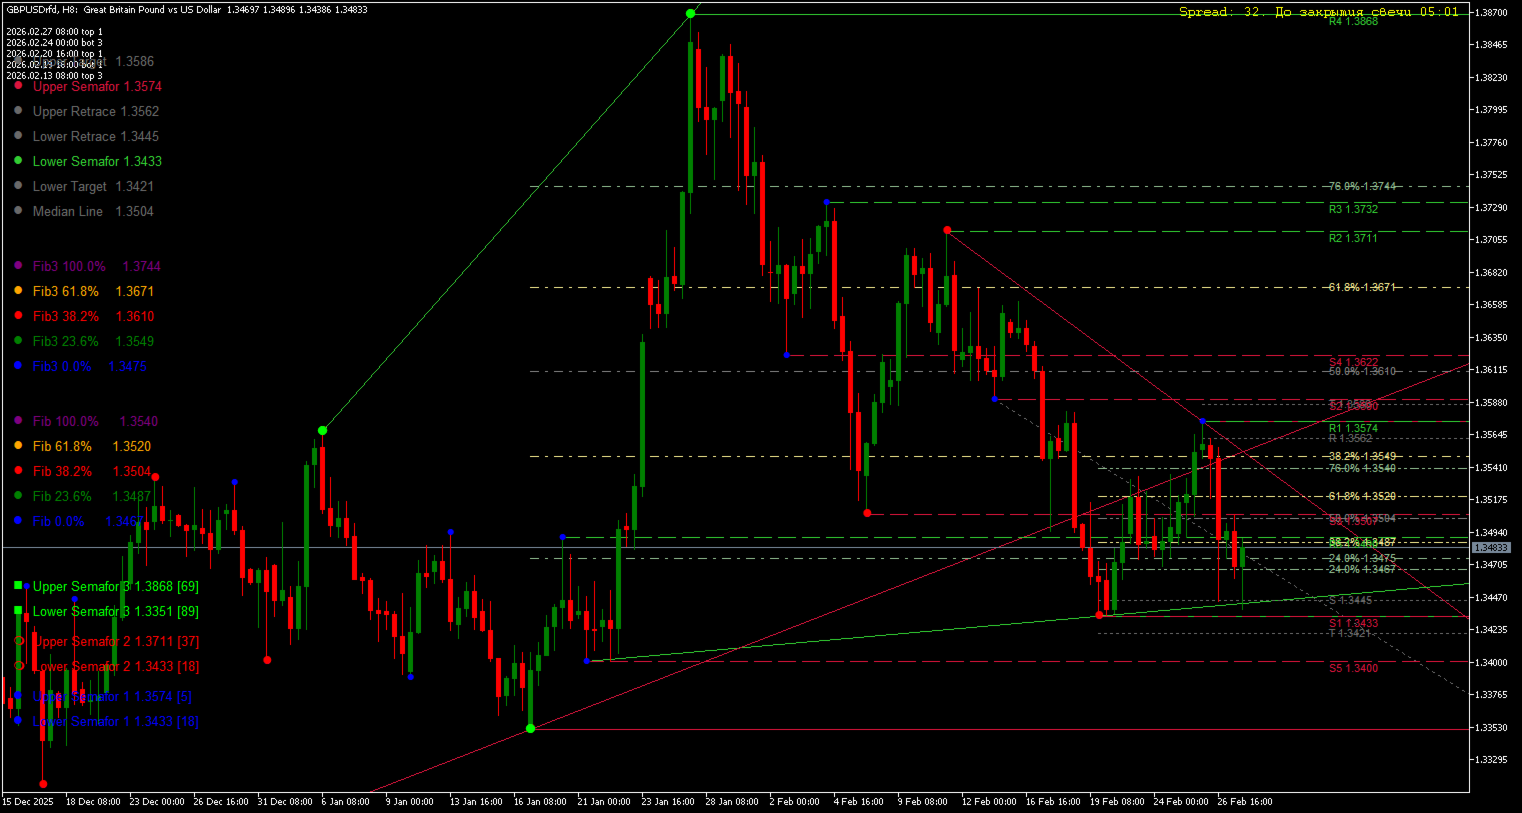
    Fibonacci seviyelerini otomatik hesaplama (0.24, 0.382, 0.5, 0.618, 0.76)

    Güncel destek ve direnç seviyelerini belirleme

    Yeni ekstremum noktaları oluştuğunda anında dönüş sinyalleri alma

    Tek bir grafikte üç zaman periyodunu görsel olarak karşılaştırma

     Nerelerde Kullanılır

     Gösterge çeşitli alım satım stratejilerinde kullanılır:

    Trend Alım Satımı — üç farklı yönlü zigzag çizgisi ile trend yönünün belirlenmesi

    Seviyelerden Alım Satım — destek/direnç seviyelerinden piyasaya giriş

    Dönüş Noktası Arama — yeni ekstremum noktaları oluştuğunda sinyaller

    Fibonacci Alım Satımı — geri çekilme ve genişleme seviyelerinin otomatik oluşturulması

    Çoklu Zaman Dilimi Analizi — sinyalleri doğrulamak için üç zigzag seviyesinin karşılaştırılması

    Scalping — periyot 5'li zigzagdan hızlı sinyallerin kullanımı

    Swing Trading — periyot 34'lü zigzagdan trend çizgileri ile işlem yapma

     Hangi Piyasalarda Kullanılır

      Gösterge evrenseldir ve tüm piyasa türlerinde çalışır:
Piyasa             Uygulama Özellikleri
Forex             Tüm döviz çiftlerinde, özellikle majörlerde (EURUSD, GBPUSD, USDJPY) mükemmel çalışır
Borsa             Yüksek likiditeli hisse senetlerinin analizinde etkilidir
Emtia Piyasası     Altın (XAUUSD), petrol (WTI, Brent), gümüş için uygundur
Kripto Paralar     Bitcoin, Ethereum ve diğer altcoinlerde iyi performans gösterir
Vadeli İşlemler     Endeks vadeli işlemlerine (S&P 500, Dow Jones) uygulanabilir
ETF             Borsa yatırım fonlarının analizi için uygundur

      Hangi Enstrümanlarda Kullanmak Daha İyidir
Döviz Çiftleri (Forex):

    Majörler: EURUSD, GBPUSD, USDJPY, AUDUSD, USDCAD, NZDUSD, USDCHF

    Çapraz Kurlar: EURGBP, EURJPY, GBPJPY, AUDJPY

    Egzotikler: USDTRY, USDZAR, USDRUB (parametre ayarı gerektirir)

Hisse Senetleri:

    Mavi Çipler: Apple, Microsoft, Google, Amazon, Tesla

    Bankacılık Sektörü: JPMorgan, Goldman Sachs

    Petrol ve Gaz Sektörü: Exxon, Shell

Kripto Paralar:

    Bitcoin (BTCUSD)

    Ethereum (ETHUSD)

    Binance Coin (BNBUSD)

    Cardano (ADAUSD)

Emtialar:

    Altın (XAUUSD)

    Gümüş (XAGUSD)

    Brent Petrol (UKOIL, Brent)

    WTI Petrol (USOIL)

     Hangi Zaman Dilimlerinde Kullanmak Daha İyidir
Zaman Dilimi     Zigzag Seviyesi     Strateji
M1-M5 (dakikalık)     Periyot 5     Scalping, hızlı sinyallerle piyasaya giriş
M15-M30 (15-30 dakikalık)     Periyot 13     Kısa vadeli alım satım, gün içi hareketler
H1-H4 (saatlik)     Periyot 34     Orta vadeli alım satım, trend belirleme
D1-W1 (günlük/haftalık)     Üçünün kombinasyonu     Uzun vadeli analiz, genel seviyeler
Zaman Dilimlerine Göre Optimum Ayarlar:

    Scalping için (M1-M5): Zigzag 1 (mavi) sinyallerini kullanın, yeşili dikkate almayın

    Gün içi alım satım için (M15-M30): mavi ve kırmızının kesişimlerine dikkat edin

    Orta vadeli alım satım için (H1-H4): kırmızı ve yeşil seviyeleri referans alın

    Uzun vadeli analiz için (D1+): genel trendi belirlemek için üç seviyeyi de kullanın

      Özellikler

    Periyotları 5, 13 ve 34 olan üç zigzag seviyesi (tamamen yapılandırılabilir)

    Her seviye için üç renk (mavi, kırmızı, yeşil)

    Daha iyi görselleştirme için farklı boyutlarda daireler (periyot büyüdükçe daire de büyür)

    Trend çizgileri, Fibonacci seviyeleri, destek/direnç noktalarının otomatik oluşturulması

    Fiyat önemli seviyelere ulaştığında sesli uyarılar

    Mevcut çubukta yeni bir ekstremum noktası oluştuğunda anında dönüş sinyalleri

    Özelliklerdeki "Colors" sekmesi üzerinden yapılandırılabilir renk paleti

    Tüm seviyelerin güncel değerlerini gösteren grafik üzerinde açıklama kutusu (legend)

    Harici göstergelere gerek duymaz — tüm zigzag mantığı kodun içine yerleştirilmiştir

    Sık yeniden çizime karşı koruma — istikrarlı çalışma için optimize edilmiştir

      Dezavantajlar

    Gecikme — her zigzag gibi, yeni ekstremum noktaları oluştuğunda gösterge yeniden çizilir (geçmiş veriler değişebilir)

    Yeni başlayanlar için karmaşıklık — çok sayıda çizgi ve seviye grafiği aşırı yükleyebilir

    Bağımsız bir sinyal değildir — diğer teknik analiz araçlarından teyit gerektirir

    Gürültüye tepki verir — küçük periyotlarda, volatil piyasalarda yanlış sinyaller verebilir

    Belirli döviz çifti ve zaman dilimine göre ayar gerektirir (optimum parametreler değişebilir)

    Fonksiyon fazlalığı — tüm seçenekler aktifleştirildiğinde grafik okunması zor hale gelir

      Nasıl Kullanılır

    Göstergeyi grafiğe yükleyin (fiyat penceresine sürükleyin)

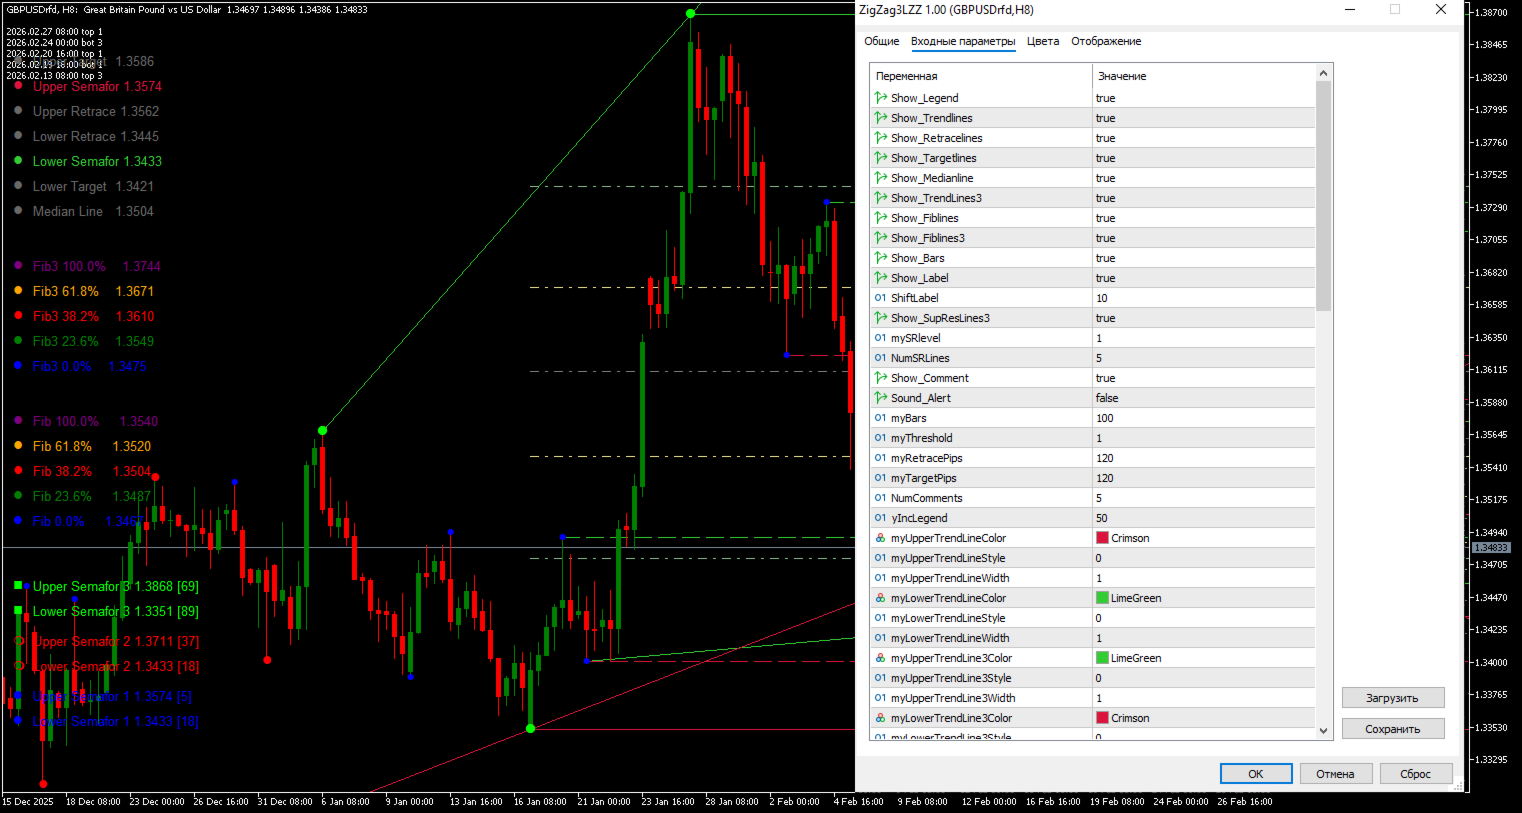
    Ayarlardan istenen görüntüleme öğelerini seçin:

        Trend çizgileri (Trendlines)

        Fibonacci seviyeleri (Fiblines)

        Destek/direnç seviyeleri (SupResLines)

    Renkleri kendi tarzınıza göre ayarlayın ("Colors" sekmesi)

    Yeni dairelerin oluşumunu izleyin — bunlar olası dönüş sinyalleridir

    Hareketin yönünü belirlemek için trend çizgilerini kullanın

    Fibonacci seviyeleri hedef fiyatlar ve geri çekilme seviyelerini belirlemede yardımcı olur

    Fiyat önemli seviyelere ulaştığında gösterge sesli uyarı verir

     Önerilen Ayarlar
      Yeni Başlayanlar İçin:

    Sadece Show_Trendlines ve Show_Bars'ı aktifleştirin

    Grafiği temiz tutmak için diğer tüm seçenekleri devre dışı bırakın

Profesyoneller İçin:

    Show_Trendlines — trend belirleme için

    Show_Fiblines — geri çekilme seviyeleri için

    Show_SupResLines3 — destek/direnç seviyeleri için

    Sound_Alert — sesli uyarılar için

Çoklu Zaman Dilimi Analizi İçin:

    H1 grafiğine periyotlar 5, 13, 34 ile göstergeyi yerleştirin

    H4 grafiğine periyotlar 8, 21, 55 ile aynı göstergeyi yerleştirin

    Teyit için sinyalleri karşılaştırın
ZigZag_3LZZ sadece bir gösterge değil, üç zigzag göstergesini, Fibonacci seviyelerinin otomatik analizini, trend çizgisi çizimini ve destek/direnç seviyelerinin belirlenmesini entegre eden eksiksiz bir alım satım sistemidir. Hem yeni başlayan yatırımcılar (temel yapılandırmada) hem de profesyoneller (tüm fonksiyonlarla) için uygundur.
Önerilen ürünler
PREngulfing
Slobodan Manovski
PR EA - Engulfing Pattern Trading System Automated Engulfing Pattern Detection with MA Confirmation The PR EA is a Meta Trader 5 expert advisor that identifies and trades bullish/bearish engulfing candlestick patterns when confirmed by a moving average filter. Designed for swing trading on 30-minute charts with compatibility for M15 and H1 time frames. Key Features: Pattern Recognition - Detects valid bullish/bearish engulfing candle formations Trend Confirmation - 238-period SMA filter
Çoğu altın göstergesi size hareketin nerede olduğunu gösterir. Aurum Apex, çoğunluk girmeden önce nereye gittiğini gösterir. Bu bir iddia değil. Bu, mimarinin kendisi. Aurum Apex Nedir? Aurum Apex, yalnızca tek bir enstrüman - Altın - etrafında inşa edilmiş, MetaTrader 5 için yeniden çizim yapmayan bir XAUUSD scalping göstergesidir . Fiyat genişlemesi tam hızına ulaşmadan önce, kırılım momentumunu başlangıç noktasında tespit etmek üzere tasarlanmıştır. Yeniden çizim yapmaz. Gecikme olmaz. Tahmin
Trendline Targets Dashboard MT5 Trendline Targets Dashboard MT5 , tam bir görsel işlem planı sunan bir MetaTrader 5 göstergesidir: Sinyal , Giriş (Entry) , Zarar Durdur (Stop Loss) ve Kâr Al (Take Profit) seviyelerini R (risk) katlarına göre otomatik olarak hesaplar. Bu gösterge otomatik işlem açmaz. Bir işlem robotu değil, görsel bir analiz ve yönetim aracıdır. Lansman Teklifi: Her satın alma işlemi için MQL5 profilimden seçeceğiniz 1 adet gösterge hediye edilecektir. İstisna: Bu bonus, Market
The indicator detects divergence signals - the divergences between the price peaks and the MACD oscillator values. The signals are displayed as arrows in the additional window and are maintained by the messages in a pop-up window, e-mails and push-notifications. The conditions which formed the signal are displayed by lines on the chart and in the indicator window. The indicator parameters MacdFast - fast MACD line period MacdSlow - slow MACD line period MacdSignal - MACD signal line period Macd
Contact me for instruction, any questions! Introduction V Bottoms and Tops  (or Fibonacci Retracement)  are popular   chart patterns   among traders due to their potential for identifying trend reversals. These patterns are characterized by sharp and sudden price movements, creating a V-shaped or inverted V-shaped formation on the   chart . By recognizing these patterns, traders can anticipate potential shifts in market direction and position themselves accordingly.  V pattern is a powerful bul
ATR Line
Evgeny Levchenko
The indicator - "ATR Line" determines the current trend and gives signals to buy (green arrow to the top) or sell (red arrow to the bottom). The indicator calculation is based on the deviation of the average price of the instrument from its average true range - ATR. The moving average of prices is used to reduce "market noise". If the main line of the indicator - "ATR Line" is lower the instrument price chart, then the market is in a "bullish" trend. If the main line of the indicator is higher t
Fractals
Mikhail Nazarenko
The Fractals indicator displays on the chart only fractals with the specified parameters in the indicator settings. This allows you to more accurately record a trend reversal, excluding false reversals. According to the classical definition of a fractal, it is a candlestick - an extremum on the chart, which was not crossed by the price of 2 candles before and 2 candles after the appearance of a fractal candle. This indicator provides the ability to adjust the number of candles before and after t
Introduction to X3 Chart Pattern Scanner X3 Cherart Pattern Scanner is the non-repainting and non-lagging indicator detecting X3 chart patterns including Harmonic pattern, Elliott Wave pattern, X3 patterns, and Japanese Candlestick patterns. Historical patterns match with signal patterns. Hence, you can readily develop the solid trading strategy in your chart. More importantly, this superb pattern scanner can detect the optimal pattern of its kind. In addition, you can switch on and off individu
Marubozu Pro MT5
N'da Lemissa Kouame
Commercial Description – Marubozu Pro (MT5) Description Marubozu Pro is a professional indicator for MetaTrader 5 that automatically detects Marubozu candles (bullish and bearish) directly on your chart. It helps traders identify strong market momentum where buyers or sellers take full control, by displaying clear visual arrows for buy and sell signals. This tool is designed to be simple, effective, and fast , perfect for manual trading or as a filter in automated strategies. Key Features
This is Multiple Timeframe of Malaysia SNR Levels and Storyline. The single timeframe version here Features: + Display level on multiple timeframe (higher or lower) + Turn on/off level on timeframe + Alert when price touch level 1. if high > resistance level but close of candle < resistance level , this level become unfresh - Name of level will have "(m)" meaning mitigated if close of candle > resistance level , this level become invalid and can be removed in chart (there is setting for keep/rem
Separating Lines Trading System for MetaTrader 5 Separating Lines Trading System is a price action indicator for MT5 designed to detect 2-bar continuation patterns where both candles share the same opening level and the second candle resumes the prevailing trend. A detailed user guide is available on the author’s MQL5 Blog . Additional updates are available through the author’s   MQL5 Channel . Depending on the current support policy, buyers may receive additional access to selected companion t
MT5 için "Dinamik Aşırı Satış/Aşırı Alım Bölgelerine Sahip CCI" Kripto Forex Göstergesi, Yeniden Boyama Yok. - Emtia Kanal Endeksi (CCI), trend yönünde Momentum işlemleri için mükemmeldir. - Dinamik Aşırı Alım bölgesinden Satış girişleri ve dinamik Aşırı Satış bölgesinden Alış girişlerini ana trend yönüne almak için harikadır. - Bu gösterge, Fiyat Hareketi girişleriyle de birleştirmek için mükemmeldir. - Dinamik Aşırı Alım bölgesi - sarı çizginin üstünde. - Dinamik Aşırı Satış bölgesi - mavi ç
Boom and Crash Sniper Spike Detector - Boom 1000 The Boom and Crash Sniper Spike Detector is the ultimate tool for spike trading on Boom 1000, offering clear and reliable signals to help you capture high-probability trades. This advanced indicator is designed to enhance your trading strategy by simplifying spike detection and maximizing your profits. Key Features: Multi-Timeframe Compatibility : The indicator can be used on M1, M5, M15, M30, and H1 timeframes, but it works best on the M1 timefra
Naked Forex Big Shadow indicator for MT5
Renaud Herve Francois Candel
5 (1)
Naked Forex Big Shadow Indicator Big Shadow Indicator is a pattern recognition indicator for Forex, Stocks, Indices, Futures, Commodities and Cryptos. When you have a Big Shadow on your chart then this is a strong signal meaning that you might be ahead of a reversal. You can take other elements (momentum, trend, volatility, price action, fundamentals) to build a complete strategy and confirm your entries. Beware that you might not make money just following the arrows generated by the pattern re
Kazanç ve araştırma için araçlar. Alım satım sinyallerinin ve stratejisinin özü, yazarın fiyat tahmin kalıplarının oluşumuna yönelik algoritmasına dayanmaktadır. Her enstrümana uygulanabilir! MA "Nine-Tailed Fox" 'a dayalı bir kontrol sistemi ile tamamlanmıştır, sinyali piyasa, alet ve çalışma süresi için mümkün olduğunca doğru bir şekilde günceller ve ayarlar. Uygun: Tüm pazarlardaki tüm araçlar (istisnalar vardır). Kimin için: hedge fonları, fon ve varlık yöneticileri, yatırım yöneticileri,
Elliott Wave MT5
Sathit Sukhirun
5 (1)
Otomatik Elliott Dalga Teorisi 1. Otomatik Dalga Sayımı ve Objektiflik İtki Dalgaları (1-2-3-4-5): Teorik olarak doğru yapıyı göstermek için katı kurallar kullanır. Düzeltme Dalgaları (A-B-C): Trend yönünde işlem fırsatları bulmak için geri çekilmeleri yakalar. 2. Çok Dereceli Analiz (Multi-Degree) 3 seviyeyi aynı anda analiz eder: Minor (Kısa): Hızlı hareketler için. Intermediate (Orta): Ana trend için. Primary (Uzun): Büyük resim için. 3. Hedef Fiyat ve Giriş Fibonacci Projeksiyonu: Bir son
Support: Profit Smasher 24/7 AI Assistant Disclaimer Liquidity Mapper Pro is an analytical tool for educational and informational purposes only. It does not provide financial advice or guaranteed signals. All trading carries risk, including potential loss of capital. Past performance does not guarantee future results. You are solely responsible for your trading decisions.
ATrend
Zaha Feiz
4.83 (18)
ATREND: Nasıl Çalışır ve Nasıl Kullanılır ### Nasıl Çalışır "**ATREND**" göstergesi, MT5 platformu için tasarlanmış olup, traderlara sağlam alım ve satım sinyalleri sağlamak amacıyla teknik analiz metodolojilerinin bir kombinasyonunu kullanır. Bu gösterge, öncelikle volatilite ölçümü için Ortalama Gerçek Aralık (ATR) kullanır ve potansiyel piyasa hareketlerini belirlemek için trend tespit algoritmalarıyla birleştirir. Satın aldıktan sonra bir mesaj bırakın ve özel bir bonus hediyesi kazanın. ##
Overview Harmonic Patterns MT5 is a technical analysis indicator designed for the MetaTrader 5 platform. It identifies and displays harmonic price patterns, such as Butterfly, Cypher, Crab, Bat, Shark, and Gartley, in both bullish and bearish directions. The indicator calculates key price levels, including entry, stop loss, and three take-profit levels, to assist traders in analyzing market movements. Visual elements and customizable alerts enhance usability on the chart. Features Detects six ha
The RSI Divergence + FVG Signal indicator combines Relative Strength Index (RSI) Divergence with Fair Value Gap (FVG) detection to generate high-probability buy and sell signals based on both momentum shifts and institutional imbalance zones. Core Features: RSI Divergence Detection : Identifies both regular and hidden bullish/bearish divergences between price and RSI. Divergences indicate potential trend reversals or continuation. FVG Zone Recognition : Detects Fair Value Gaps (imbalances caused
RBreaker
Zhong Long Wu
RBreaker Gold Indicators is a short-term intraday trading strategy for gold futures that combines trend following and intraday reversal approaches. It not only captures profits during trending markets but also enables timely profit-taking and counter-trend trading during market reversals. This strategy has been ranked among the top ten most profitable trading strategies by the American magazine   Futures Truth   for 15 consecutive years. It boasts a long lifecycle and remains widely used and st
Bu gösterge, piyasa fiyatının ulaşması muhtemel ilgi çekici mumları gösterir. Bunları gözlemleyerek, piyasanın bir sonraki hareketinin yönünü tahmin edebilirsiniz. Fikir tamamen orijinaldir ve Smart Money (Akıllı Para) konsepti ile yakından ilgilidir. Nasıl çalışır: Aktif mumlar renkli olarak vurgulanır. Market maker’lar için mıknatıs gibi çalışırlar çünkü hâlâ likidite içerirler. Mevcut fiyat konumuna göre mumlar kırmızı veya mavi renkte gösterilir, böylece görsel olarak kolayca okunabilirler.
Unlock market continuations with the accurate pennants indicator This indicator finds pennants , which are continuation patterns identified by converging trendlines surrounding a price consolidation period. Trades are signaled using a breakout period alongside the formation breakout.  [ Installation Guide | Update Guide | Troubleshooting | FAQ | All Products  |  Get Help ] Easy to use Customizable colors and sizes It implements breakout signals It implements alerts of all kinds Optimal Usage
Hush mt5
Iurii Plokhov
4.33 (3)
Hush mt5 is an advanced indicator that gives a signal about the overbought or oversold market in a certain period of time Hush mt5 the advantage of this indicator is that it does not disappear after the signal on the chart Suitable for any trade: forex, stocks, cryptocurrency, metals Hush mt5 can be used on any time period. The signal goes to the beginning of the next candle after the arrow Hush mt5 performed best on the period H1,H4,daily It can be used in addition to forex, in binary opt
Renko Plus
Eadvisors Software Inc.
With Renko Plus you can use the features in the Indicator functionality, just add it to the Metatrader5 chart.             The Renko chart is a type of chart, developed by the Japanese, that is constructed using price movement rather than standardized prices and time intervals like most charts. It is believed to be named after the Japanese word for bricks, "renga", as the graphic looks like a series of bricks.             A new brick is created when the price moves a specified pri
DoctorEdge V-LINE (Pump it & Dump it) Strategy Pro Confirms trend direction using smart momentum logic and key price behavior How It Works DoctorEdge V-LINE is a smart visual indicator designed to detect trend impulses and confirm their strength based on how price reacts around certain dynamic zones. Buy Trend: When price reaches level -20 , the line turns green , signaling a potential buy . If price breaks above level 0 and the line stays green, the uptrend is confirmed . If price doe
The indicator builds a graphical analysis based on the Fibonacci theory. Fibo Fan is used for the analysis of the impulses and corrections of the movement. Reversal lines (2 lines at the base of the Fibonacci fan) are used to analyze the direction of movements. The indicator displays the of 4 the target line in each direction. The indicator takes into account market volatility. If the price is above the reversal lines, it makes sense to consider buying, if lower, then selling. You can open posi
Trade smarter, not harder: Empower your trading with Harmonacci Patterns This is arguably the most complete harmonic price formation auto-recognition indicator you can find for the MetaTrader Platform. It detects 19 different patterns, takes fibonacci projections as seriously as you do, displays the Potential Reversal Zone (PRZ) and finds suitable stop-loss and take-profit levels. [ Installation Guide | Update Guide | Troubleshooting | FAQ | All Products   |  Get Help ] It detects 19 differen
Your feedback is very valuable to us. By sharing your experience, you help us improve and provide you with better service. Thank you! PIPnova – Advanced Signal Indicator (v2.1) PIPnova is a professional MetaTrader 5 signal indicator powered by advanced algorithms, a multi-layer filtering system, and real-time signal performance tracking. Key Features Powerful signal algorithm based on RSI , Stochastic , and a custom LWTI oscillator Automatic TP / SL level placement for each signal Outc
MercariaPattern1-2-3 відстежує рух ціни, знаходить трьоххвильові структури 1-2-3 та підсвічує момент, коли сценарій підтверджується пробоєм ключового рівня. MercariaPattern1-2-3 tracks price movement, detects three-leg 1-2-3 structures and highlights the moment when the scenario is confirmed by a key level breakout. Індикатор збирає локальні свінги в компактну фігуру 0–1–2–3 , чекає підтвердженого пробою та будує стрілку входу з готовими рівнями SL/TP. The indicator combines local swings into a
Bu ürünün alıcıları ayrıca şunları da satın alıyor
Azimuth Pro
Ottaviano De Cicco
5 (6)
Azimuth Pro V2: Synthetic Fractal Structure and Confirmed Entries for MT5 Overview Azimuth Pro is a multi-level swing structure indicator by Merkava Labs . Four nested swing layers, swing-anchored VWAP, ABC pattern detection, three-timeframe structural filtering, and closed-bar confirmed entries — one chart, one workflow from micro-swings to macro-cycles. This is not a blind signal product. It is a structure-first workflow for traders who care about location, context, and timing. V2 Launch Offe
OmniSync Projection
Antonio-alin Teculescu
5 (1)
Chronos Fractal Engine is an innovative price projection indicator for MetaTrader 5, designed to transform your technical analysis by intelligently identifying and projecting historical price patterns. Built upon an advanced correlation algorithm and the fractal principles of the market, this powerful tool visualizes potential future price movements, giving you a unique edge in your trading decisions. What is Chronos Fractal Engine? At its core, the Chronos Fractal Engine employs a sophisticat
CGE Trading Suite
Carl Gustav Johan Ekstrom
5 (2)
Institutional-Grade Analytics for MT5 C GE Trading Suite delivers the analytical edge typically reserved for professional trading desks. The platform integrates a full suite of analytical tools into one seamless workflow: dynamic grid mapping, liquidity behavior analysis, ECM, trend lines, MIDAS, trade cycles, and directional channel projections. Together, these provide a unified view of market structure and momentum. Directional clarity is further enhanced by the capital flow index, which meas
RelicusRoad Pro: Kantitatif Piyasa İşletim Sistemi ÖMÜR BOYU ERİŞİMDE %70 İNDİRİM (SINIRLI SÜRE) - 2.000+ TRADER'A KATILIN Neden çoğu trader "mükemmel" indikatörlere rağmen başarısız olur? Çünkü tekil kavramları boşlukta trade ederler. Bağlamı olmayan bir sinyal kumardır. Sürekli kazanmak için KONFLÜANS (UYUM) gerekir. RelicusRoad Pro basit bir ok indikatörü değildir. Tam bir Kantitatif Piyasa Ekosistemi dir. Tescilli volatilite modellemesini kullanarak fiyatın ilerlediği "Adil Değer Yolu"nu har
ARICoins
Temirlan Kdyrkhan
ARICoin is a powerful trading companion designed to generate high-probability entry signals with dynamic TP/SL/DP levels based on volatility. Built-in performance tracking shows win/loss stats, PP1/PP2 hits, and success rates all updated live. Key Features: Buy/Sell signals with adaptive volatility bands Real-time TP/SL/DP levels based on ATR Built-in MA Filter with optional ATR/StdDev volatility Performance stats panel (Success, Profit/Loss, PP1/PP2) Alerts via popup, sound, push, or email Cust
ARIPoint
Temirlan Kdyrkhan
ARIPoint is a powerful trading companion designed to generate high-probability entry signals with dynamic TP/SL/DP levels based on volatility. Built-in performance tracking shows win/loss stats, PP1/PP2 hits, and success rates all updated live. Key Features: Buy/Sell signals with adaptive volatility bands Real-time TP/SL/DP levels based on ATR Built-in MA Filter with optional ATR/StdDev volatility Performance stats panel (Success, Profit/Loss, PP1/PP2) Alerts via popup, sound, push, or email Cu
Öncelikle, bu Ticaret Aracının Non-Repainting, Non-Redrawing ve Non-Lagging Gösterge olduğunu vurgulamakta fayda var, bu da onu profesyonel ticaret için ideal hale getiriyor. Çevrimiçi kurs, kullanıcı kılavuzu ve demo. Akıllı Fiyat Hareketi Kavramları Göstergesi, hem yeni hem de deneyimli tüccarlar için çok güçlü bir araçtır. İleri ticaret fikirlerini, Inner Circle Trader Analizi ve Smart Money Concepts Ticaret Stratejileri gibi 20'den fazla kullanışlı göstergeyi bir araya getirerek bir araya
TPA True Price Action indicator reveals the true price action of the market makers through 100% non-repainting signals strictly at the close of a candle! TPA shows entries and re-entries, every time the bulls are definitely stronger than the bears and vice versa. Not to confuse with red/green candles. The shift of power gets confirmed at the earliest stage and is ONE exit strategy of several. There are available now two free parts of the TPA User Guide for our customers. The first "The Basics"
AriX
Temirlan Kdyrkhan
1 (4)
AriX Indicator for MT5 A powerful trend-following and signal-evaluation tool AriX is a custom MT5 indicator that combines Moving Averages and ATR-based risk/reward logic to generate clear buy/sell signals. It visualizes dynamic SL/TP levels, evaluates past trade outcomes, and displays win/loss statistics in a clean on-chart panel. Key features include: Buy/Sell signals based on MA crossovers ATR-based SL/TP1/TP2/TP3 levels with visual lines and labels Signal outcome tracking with real-time stat
Meravith MT5
Ivan Stefanov
5 (1)
Göstergе, herhangi bir noktadan hacmi analiz eder ve bu hacim için piyasanın tükeniş seviyelerini hesaplar. Meravith’in ana çizgileri: Boğa hacim tükeniş çizgisi – hedef olarak kullanılır. Ayı hacim tükeniş çizgisi – hedef olarak kullanılır. Trend çizgisi – piyasa trendini gösterir. Piyasanın boğa mı ayı mı olduğuna bağlı olarak rengi değişir ve trend desteği görevi görür. Nasıl kullanılır: Mor dikey çizgiye çift tıklayın ve istediğiniz konuma taşıyın. Her şeyi analiz edebilirsiniz – trendleri v
SignalTech MT5 is a trading system for EURUSD, USDCHF, USDJPY, AUDUSD, NZDUSD, EURJPY, AUDJPY, NZDJPY, CADJPY H2 and H3 Timeframe.  It can generate signals with Buy/Sell Arrows and Pop-Up/Sound Alerts. Each signal has clear Entry and Stop Loss levels, which should be automatically flagged on the chart, as well as potential Targets 1, 2, and 3. The Entry and TP levels are fixed after the trade is taken. The exit level is dynamic. If there are signs of a potential short-term trend reversal, the
ZIVA Signal Intelligence
Hassan Abdullah Hassan Al Balushi
ZIVA Signal Intelligence An Adaptive, Modular Market Intelligence System ZIVA Signal Intelligence is not positioned as a conventional trading indicator. It is a fully integrated, proprietary market intelligence system engineered to deliver structured, high-precision interpretation of price behavior within a controlled analytical environment. Developed through an independent architectural approach, ZIVA does not rely on, derive from, or replicate existing indicators. It represents a standalone
Ziva LSE System
Hassan Abdullah Hassan Al Balushi
ZIVA LSE System A Professional Liquidity & Structure Execution Framework Executive Overview ZIVA LSE System is a professionally engineered analytical framework designed to interpret market behavior through structural logic and liquidity dynamics. It is not positioned as a conventional indicator. Rather, it functions as a structured execution environment that organizes price action into a clear, disciplined decision-making model. The system is built to deliver consistency, clarity, and controlle
SunSignal ML — AI Gold Signals with Multi-Timeframe Confluence SunSignal ML is an advanced AI-powered signal indicator purpose-built for XAUUSD gold trading. It combines a proprietary adaptive trend algorithm with six machine learning models trained on confirmed price pivots to produce high-confidence entry signals with multi-timeframe validation. The indicator runs efficiently on M1, M5 and M15 timeframes and is designed for traders who want precision entries guided by data rather than guesswor
Ultimate SMC Indicator
Hicham Mahmoud Almoustafa
1 (1)
Ultimate SMC Indicator v2.20 — Smart Money Concepts All-in-One Stop switching between 5 different indicators. Ultimate SMC gives you everything Smart Money traders need — in one clean indicator with interactive controls. GUIDE What makes this different? Most SMC indicators show you Order Blocks or FVGs separately. You still have to figure out which zones actually matter. Ultimate SMC does the hard work: it scans for Order Blocks, Fair Value Gaps, Liquidity Sweeps, Supply & Demand zones, Fibo
Bu seviyenin alım için uygun olup olmadığını belirlemeye yardımcı olur. Bu seviyenin satış için uygun olup olmadığını belirlemeye yardımcı olur. Dört göstergenin tamamı aynı anda dip seviyeye ulaştığında, tepki yükselişi fırsatlarına odaklanın. Dört göstergenin tamamı aynı anda üst seviyede olduğunda, düşüş fırsatlarına odaklanın. Bu sistem, Çin’in gelişmiş algoritmik teknolojisi ve üst düzey matematiksel modelleme yapısı temel alınarak oluşturulmuştur. Bu göstergeyi ağırlıklı olarak XAUUSD M5 p
ARIScalping
Temirlan Kdyrkhan
ARIScalp is a powerful trading companion designed to generate high-probability entry signals with dynamic TP/SL/DP levels based on volatility. Built-in performance tracking shows win/loss stats, PP1/PP2 hits, and success rates all updated live. Key Features: Buy/Sell signals with adaptive volatility bands Real-time TP/SL/DP levels based on ATR Built-in MA Filter with optional ATR/StdDev volatility Performance stats panel (Success, Profit/Loss, PP1/PP2) Alerts via popup, sound, push, or email Cus
" Dynamic Scalper System MT5 " göstergesi, trend dalgaları içinde işlem yapmak için scalping yöntemi için tasarlanmıştır. Başlıca döviz çiftleri ve altın üzerinde test edilmiştir, diğer işlem araçlarıyla uyumluluğu mümkündür. Ek fiyat hareketi desteğiyle trend boyunca pozisyonların kısa vadeli açılması için sinyaller sağlar. Göstergenin prensibi. Büyük oklar trend yönünü belirler. Küçük oklar şeklinde scalping için sinyaller üreten bir algoritma trend dalgaları içinde çalışır. Kırmızı oklar yü
Göstergemiz, piyasada ilgi gösterilen bölgeleri vurgular ve ardından emir birikim bölgelerini gösterir. Büyük ölçekli bir emir defteri (order book) gibi çalışır. Bu, büyük sermaye için geliştirilmiş bir göstergedir. Performansı olağanüstüdür. Piyasada ne tür bir ilgi olursa olsun, onu görürsünüz . (Bu, tamamen yeniden yazılmış ve otomatikleştirilmiş bir versiyondur – artık manuel analiz gerekmez.) İşlem Hızı (Transaction Speed) , piyasada büyük emirlerin nerede ve ne zaman biriktiğini gösteren v
Range Cycle Indicator. Gives signal on price range cycling smoothed by moving average. It is better to use it on H1+ timeframes and avoid side markets. Because if market is flat this indicator will give too many zero profit or even losing signals. Parameters: PopUpAlert - to allow it to alert when trend changes; EMailAlert - for email alerts; period - this is a smoothing criteria, use higher values on lower timeframes; TimeFrame(new) - higher timeframe (or the same) to use for calculation, defa
BookMap HeatMap
Roberto Spadim
1 (2)
This Indicator creates a heatmap based on depth of market of the current symbol or another symbol. Other symbol is useful when you trade futures market and a contract has 'mini' and 'full' split. For example, in Brazil (B3 - BMF&Bovespa), WDO and DOL are future Forex contract of BRL/USD (where 1 DOL = 5 WDO) and big banks work mostly with DOL (where liquidity is important). Please use with M1 timeframe , objects are too small to be displayed at higher timeframes (MT5 limit). The number of level
TrendMaestro5
Stefano Frisetti
note: this indicator is for METATRADER4, if you want the version for METATRADER5 this is the link:  https://www.mql5.com/it/market/product/108106 TRENDMAESTRO ver 2.5 TRENDMAESTRO recognizes a new TREND from the start, he never makes mistakes. The certainty of identifying a new TREND is priceless. DESCRIPTION TRENDMAESTRO identifies a new TREND in the bud, this indicator examines the volatility, volumes and momentum to identify the moment in which there is an explosion of one or more of these da
*** ### **Triple Crox Strategy - Professional Trading System** **Overview** The Triple Crox Strategy is an advanced technical indicator for MetaTrader 5, designed for serious traders. It synthesizes multiple analysis methodologies—including moving averages, Average True Range (ATR), Relative Strength Index (RSI), and cloud configurations—to generate highly reliable and precise trading signals. **Core Configuration** **Setup Types** *   **Setup Open/Close:** Utilizes Heikin Ashi can
Weis Wave with Alert MT5
Trade The Volume Waves Single Member P.C.
4.94 (17)
Rental/Lifetime Package Options and Privileges  Rent Monthly Six Months   Yearly/Lifetime Weis Wave with Speed with Alert+Speed Index x x x Manual  x x x Quick Set up Video x x x Blog x x x Lifetime Updates x x x Setup and Training Material x x Discord Access Channel "The SI traders"          x Rectangle Break Alert Tool      x How to trade with it:    http://www.tradethevolumewaves.com   ** If you purchase please contact me to setup your  : Training Room and  complete manual access.  Wei
Owl Smart Levels MT5
Sergey Ermolov
4.03 (32)
Trend yönünde işlem yaparken asıl zorluk bir seviye bulmak değil, girişin gerçekten nerede geçerli olduğunu anlamaktır. Fiyat genellikle seviyelere tepki verir ancak hareket devam etmez — bu da yanlış girişlere veya kaçırılan fırsatlara yol açar. Owl Smart Levels sadece seviyeleri göstermez , aynı zamanda piyasa yapısı ve geri çekilmelere dayalı bölgeler oluşturur. Bu, giriş noktalarını farklı şekilde değerlendirmenizi sağlar ve bazı hatalı sinyallerden kaçınmanıza yardımcı olur. Owl Smart Leve
FX Analysis is an all-in-one MT5 indicator dashboard that combines eight analytical tools in a single panel, helping traders identify high-probability setups without switching between charts or indicators. Designed for standard forex pairs on MetaTrader 5. Best results on M15 - H4 timeframes when all components are used together as part of the included workflow. Components Volatility Analyzer Displays historical average movement by hour and by day of the week. A real-time Pip Balance shows the
Orderflow Scalp Pro v2.4   delivers institutional-grade trading intelligence through advanced volume analysis, dynamic VWAP calculations, real-time aggressive score monitoring, and precision arrow signals. This complete trading system transforms complex market data into clear, actionable signals for consistent profitability on 3-4 minute timeframes. Full Documentation: [Download PDF] Four Powerful Components in One System Volume Profile HeatMap with POC/VAH/VAL Transform your charts into inst
Red and Green Light – Intelligent Trading Signal Indicator Product Overview Red and Green Light is a professional trading signal indicator based on the multi-stage T3 smoothing algorithm. It integrates a visual traffic light system, intelligent signal recognition, risk alerts, and multiple notification features. Whether you're a manual trader or an Expert Advisor (EA) developer, this indicator helps you capture market opportunities with greater precision and effectively avoid the risks of
TickChart Indicator plots tick line on the main window of MetaTrader. ( Free version of this is "TickChart Indicator Lite" ) The tick-line shows the most detailed, fastest and real-time activities of the market, which are usually hidden in bars or candles longer than 1 minute. Usually, several new tick-line segments appear while a bar of M1 time frame is completed. After the release of an important economic indicator, the number of ticks per bar may exceeds 100. This indicator overlays the tick
MetaForecast M5
Vahidreza Heidar Gholami
5 (3)
MetaForecast, fiyat verilerindeki harmonileri kullanarak herhangi bir piyasanın geleceğini tahmin eder ve görselleştirir. Piyasa her zaman tahmin edilemezken, fiyatlarda bir desen varsa, MetaForecast geleceği mümkün olduğunca doğru bir şekilde tahmin edebilir. Benzer ürünlere göre, MetaForecast piyasa eğilimlerini analiz ederek daha kesin sonuçlar üretebilir. Giriş Parametreleri Past size (Geçmiş boyut) MetaForecast'ın gelecekteki tahminler oluşturmak için kullandığı çubuk sayısını belirtir. Mo
Yazarın diğer ürünleri
Bu göstergede 13 ve 55 farklı periyotlara sahip iki adet zikzak oluşur. Göstergenin iki segmenti oluştuğunda ve belirli bir zaman diliminde fiyatın minimum veya maksimumunu oluşturarak birleştiğinde, gösterge fiyatın ters yönde olası bir dönüşü işaret eder. Zigzag'ın en küçük periyodu (13) oluştuğunda, en büyük periyot (55) aynı minimum veya maksimumda kalırsa, bu, önceki maksimum veya minimum'a doğru bir düzeltme hareketinin mümkün olduğu anlamına gelir, bu da açık pozisyona lot pozisyonu eklem
Zig-zag göstergesi, 34 periyotlu standarttır ve ok şeklinde ek bir sinyale sahiptir. Ek sinyal, zig-zag göstergesinden ayrı olarak hesaplanır. Bu gösterge aşağıdaki şekilde çalışır: 1. zıg-zag göstergesinin bir bölümünü oluştururken ve ok şeklinde ek bir sinyal görünürken, konumu ok yönüne doğru açmanız gerekir; 2. zıg-zag göstergesinin bir başka kolu, önceki kolun tepesindeki ek sinyalin (ok) karşı tarafında oluştuğunda, bekleyen emrin konumunu belirlemek mümkündür; 3. zig-zag'ın karşı kolunun
Belirtilen gösterge, mevcut sembolde kâr (zarar) gösteren göstergenin bir versiyonudur. Toplam kâr veya zararı belirleyerek seviyeyi fareyle kolayca hareket ettirebilirsiniz. Bu göstergenin özellikleri şunlardır: 1. Kâr veya zararın, ticaretin gerçekleştiği yerin yakınındaki bir çizginin yakınında değil, ekranın sol üst köşesinde görüntüleneceği, yani kâr veya zararın hesaplanmasının ticaretinizi engellemeyeceği anlamına gelir. 2. gösterge otomatik olarak hangi pozisyonların açık olduğunu belirl
## WPRV2 İşaretçisi Tam Açıklaması WPRV2, William's Yüzde Aralığı (%R) olarak bilinen geleneksel teknik analiz aracının iyileştirilmiş bir versiyonudur. Hisse senetleri piyasalarında, Forex ve kripto para platformlarında kullanılır ve piyasa eğilimlerini analiz etmeye ve ticari pozisyonlar için en uygun giriş ve çıkış noktalarını belirlemeye yardımcı olur. ### İşaretçinin Amacı WPRV2'nin temel amacı, şu anki fiyatın yakın zamanda gerçekleşen en yüksek ve en düşük seviyelerine göre yerini ölçm
GannZigZagMACD Göstergesinin Detaylı Açıklaması Amaç ve Kavram GannZigZagMACD , MetaTrader 5 platformu için klasik MACD göstergesini Gann'ın zikzak unsurlarıyla birleştiren hibrit bir teknik göstergedir. Bu gösterge, ekstrem desenlere dayalı trend dönüşlerini tespit etmek ve işlem sinyalleri üretmek için tasarlanmıştır. Göstergenin temel fikri, Gann'ın yöntemini kullanarak önemli yüksek ve düşük noktaları tespit etmek ve ardından bu sinyalleri MACD histogramına yansıtmaktır. Çalışma Prensibi An
ATRZigMACD
Igor Nagorniuk
ATRZigMACD - Gösterge Kısa Tanımı 1. Amaç ve Kavram ATRZigMACD, klasik MACD'yi sahte sinyalleri filtrelemek için bir ATR-ZigZag algoritmasıyla birleştiren gelişmiş bir osilatördür. Gösterge, volatiliteyi dikkate alarak trend dönüş noktalarını belirler, trend gücünü doğrular ve net ticaret sinyalleri üretir. 2. Çalışma Prensibi Bileşenler: MACD histogramı (mavi) - hızlı ve yavaş EMA arasındaki fark Sinyal çizgisi (sarı) - histogramın düzleştirici hareketli ortalaması SELL okları (yeşil, yukarı)
X Sensors Pro, seçilen bir dönem boyunca işlem hacminin fiyat seviyelerine dağılımını görselleştiren profesyonel bir hacim profili göstergesidir. Gösterge otomatik olarak yerel uç noktaları (HH ve LL) belirler, maksimum hacimli seviye olan POC'yi (Kontrol Noktası) hesaplar ve belirlenen aralığa dayalı olarak destek ve direnç seviyeleri oluşturur. Temel Özellikler: Renkli histogramlar olarak hacim profili görselleştirmesi Otomatik POC (Kontrol Noktası) tespiti HH (Daha Yüksek Tepe) ve LL (Daha
Genel Amaç Dual ZigZag SSRC, farklı periyotlara sahip iki ZigZag ve SSRC filtresinin birleşimine dayalı olarak alım ve satım sinyalleri üreten teknik analiz göstergesidir. Gösterge, otomatik olarak yerel ekstrem noktaları belirler, filtre ile teyit eder ve giriş ile stop loss seviyeleriyle birlikte sinyalleri sunar. İşlevler Dönüş noktalarının belirlenmesi - çift ZigZag, önemli dip ve tepe noktalarını vurgulayarak piyasa gürültüsünü filtreler. Sahte sinyallerin filtrelenmesi - SSRC osilatörü,
Filtrele:
Değerlendirme yok
Değerlendirmeye yanıt