ZigZag3LZZ

ZigZag_3LZZ — 3단계 지그재그 인디케이터


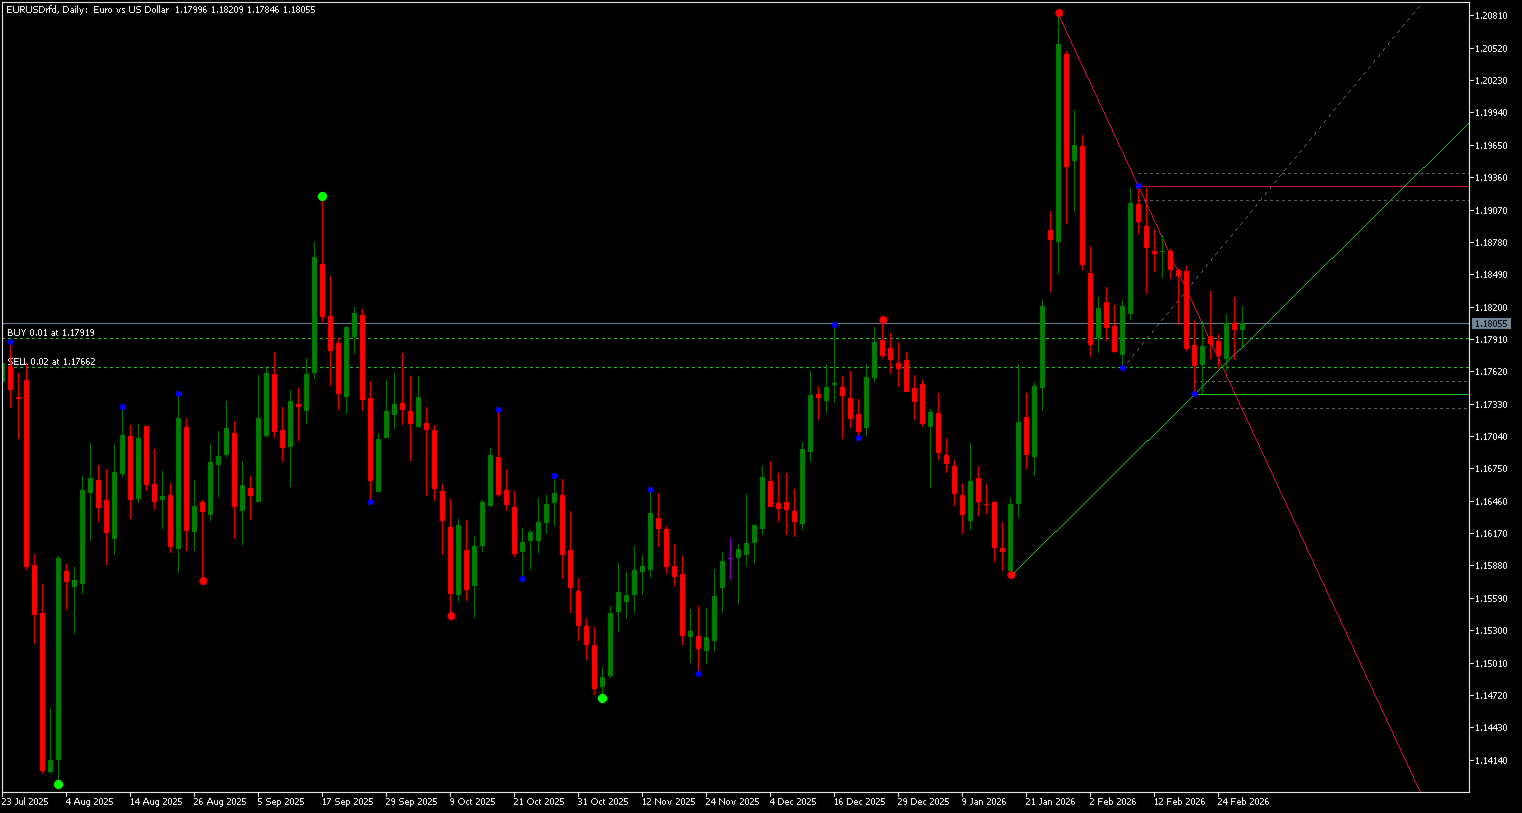
ZigZag_3LZZ 인디케이터는 금융 시장의 기술적 분석을 위해 설계되었습니다. 차트에 서로 다른 주기(5, 13, 34)를 가진 세 가지 색상의 지그재그 라인을 표시하여 트레이더에게 다음 기능을 제공합니다:

    주요 가격 반전 수준을 시각적으로 식별

    중요하지 않은 가격 변동과 시장 노이즈 필터링

    최신 극점을 기반으로 추세선 그리기

    피보나치 수준 자동 계산 (0.24, 0.382, 0.5, 0.618, 0.76)

    현재 지지선과 저항선 수준 결정

    새로운 극점 출현 시 즉각적인 반전 신호 획득

    단일 차트에서 세 가지 시간대를 시각적으로 비교

      적용 분야

      이 인디케이터는 다양한 거래 전략에 사용됩니다:

    추세 거래 — 세 가지 방향의 지그재그 라인을 통한 추세 방향 판단

    수준 거래 — 지지/저항 수준에서 시장 진입

    반전점 탐색 — 새로운 극점 형성 시 신호

    피보나치 거래 — 되돌림 및 확장 수준 자동 구축

    다중 시간대 분석 — 세 가지 지그재그 수준 비교를 통한 신호 확인

    스캘핑 — 주기 5 지그재그의 빠른 신호 활용

    스윙 트레이딩 — 주기 34 지그재그의 추세선을 이용한 거래

      적용 시장

      이 인디케이터는 보편적이며 모든 유형의 시장에서 작동합니다:
시장             적용 특성
외환             모든 통화쌍, 특히 주요 통화쌍(EURUSD, GBPUSD, USDJPY)에서 탁월한 성능
주식 시장         유동성이 높은 주식 분석에 효과적
상품 시장         금(XAUUSD), 원유(WTI, Brent), 은에 적합
암호화폐         비트코인, 이더리움 및 기타 알트코인에서 우수한 성능
선물             지수 선물(S&P 500, 다우존스)에 적용 가능
ETF             상장지수펀드 분석에 적합

      최적의 거래 종목
통화쌍(외환):

    메이저: EURUSD, GBPUSD, USDJPY, AUDUSD, USDCAD, NZDUSD, USDCHF

    크로스: EURGBP, EURJPY, GBPJPY, AUDJPY

    이국적 통화: USDTRY, USDZAR, USDRUB(매개변수 조정 필요)

주식:

    블루칩: 애플, 마이크로소프트, 구글, 아마존, 테슬라

    은행 섹터: JP모건, 골드만삭스

    석유 및 가스 섹터: 엑슨모빌, 쉘

암호화폐:

    비트코인(BTCUSD)

    이더리움(ETHUSD)

    바이낸스 코인(BNBUSD)

    카르다노(ADAUSD)

상품:

    금(XAUUSD)

    은(XAGUSD)

    브렌트유(UKOIL, Brent)

    WTI유(USOIL)

      최적의 시간대
시간대         지그재그 수준         전략
M1-M5(분봉)     주기 5                 스캘핑, 빠른 신호를 통한 시장 진입
M15-M30(15-30분봉)     주기 13         단기 거래, 일중 변동
H1-H4(시간봉)     주기 34             중기 거래, 추세 판단
D1-W1(일봉/주봉)     세 가지 조합         장기 분석, 전체적 수준
시간대별 최적 설정:

    스캘핑(M1-M5): ZigZag 1(파란색) 신호 사용, 녹색 무시

    일중 거래(M15-M30): 파란색과 빨간색 교차에 주목

    중기 거래(H1-H4): 빨간색과 녹색 수준 참고

    장기 분석(D1+): 세 가지 수준 모두 사용하여 전체 추세 판단

      특징

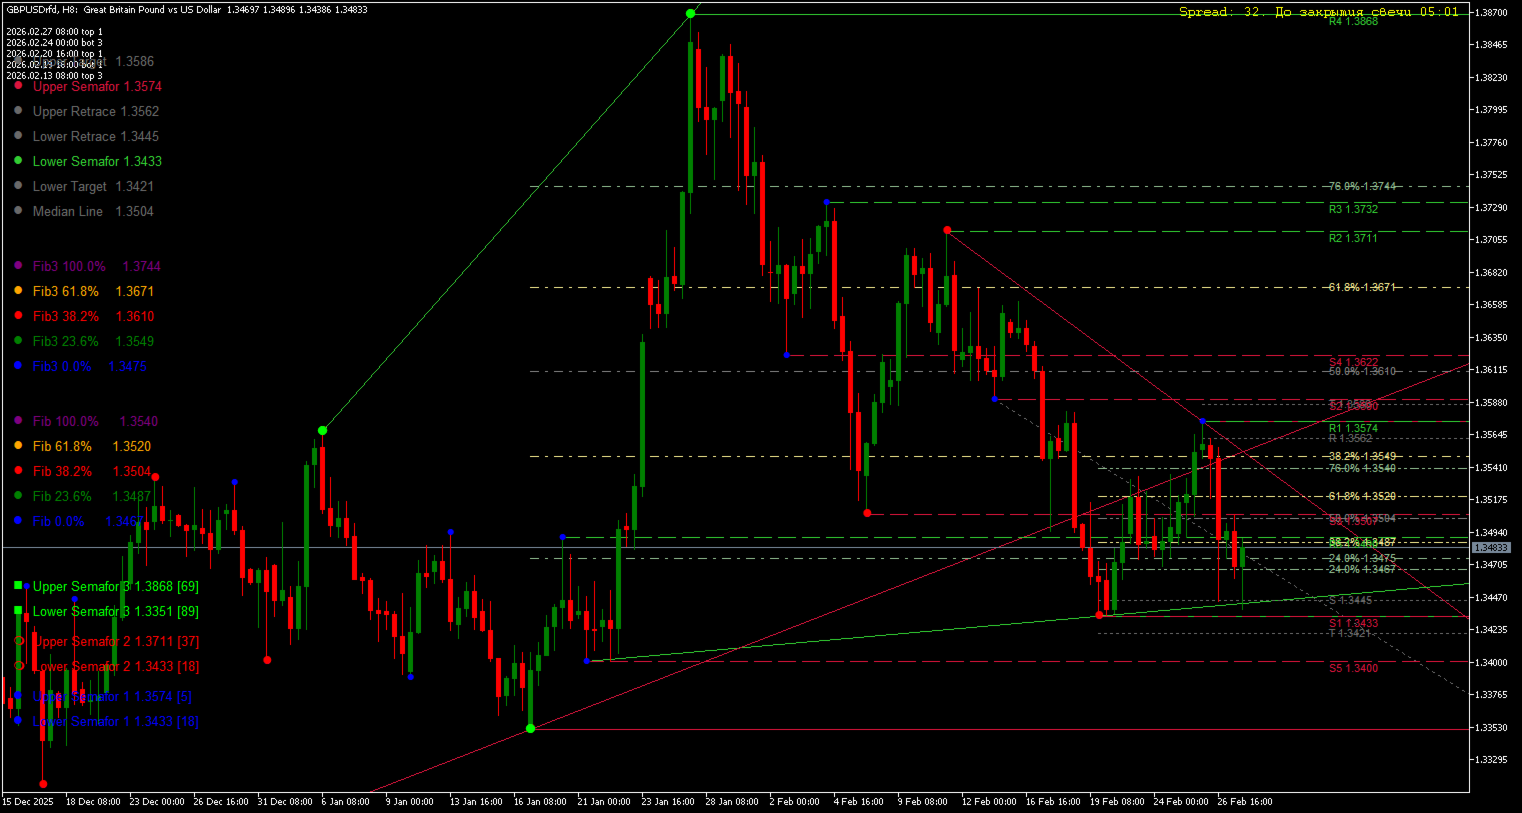
    주기 5, 13, 34의 세 가지 지그재그 수준(완전 사용자 정의 가능)

    각 수준에 해당하는 세 가지 색상(파랑, 빨강, 초록)

    시인성 향상을 위한 다양한 크기의 원(주기가 클수록 원도 크게)

    추세선, 피보나치 수준, 지지/저항선 자동 구축

    가격이 중요한 수준에 도달할 때 음성 알림

    현재 봉에 새로운 극점 출현 시 즉각적인 반전 신호

    속성의 "Colors" 탭에서 사용자 정의 가능한 색상 팔레트

    모든 수준의 현재 값을 표시하는 차트 범례

    외부 인디케이터 불필요 — 지그재그 로직이 코드에 내장됨

    빈번한 다시 그리기 방지 보호 — 안정적 작동을 위해 최적화됨

      단점

    지연 — 다른 지그재그와 마찬가지로 새로운 극점 형성 시 다시 그려짐(과거 데이터가 변경될 수 있음)

    초보자에게 복잡함 — 많은 수의 라인과 수준이 차트를 과부하시킬 수 있음

    독립적인 신호 아님 — 다른 기술적 분석 도구의 확인 필요

    노이즈에 반응 — 주기가 짧을 경우 변동성이 큰 시장에서 잘못된 신호를 줄 수 있음

    특정 통화쌍과 시간대에 맞춘 조정 필요(최적 매개변수는 다를 수 있음)

    기능 과다 — 모든 옵션을 활성화하면 차트 가독성 저하

      사용 방법

    인디케이터를 차트에 설치(가격 창으로 드래그)
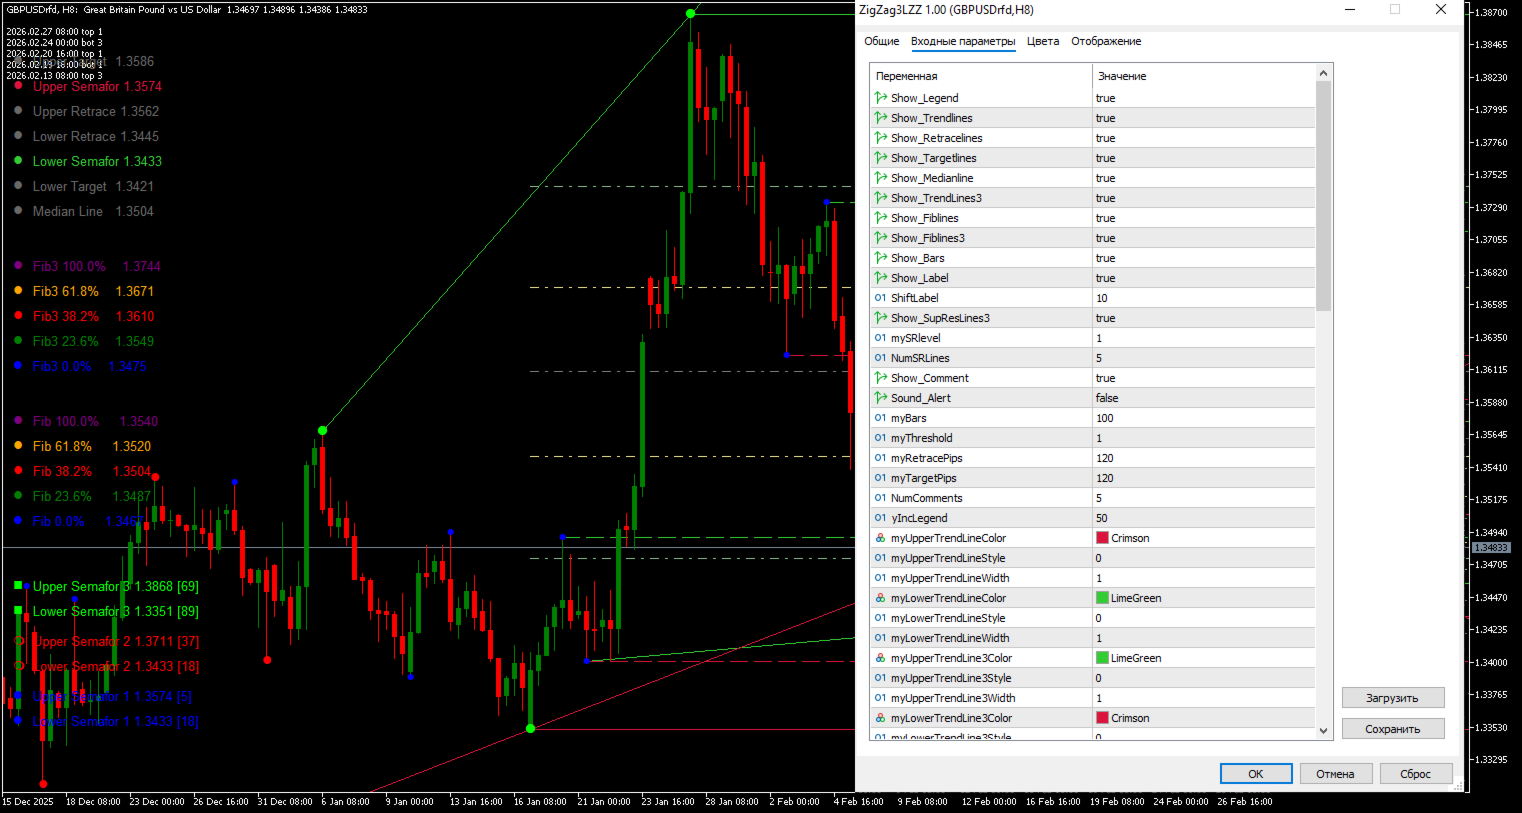
    설정에서 원하는 표시 요소 선택:

        추세선(Trendlines)

        피보나치 수준(Fiblines)

        지지/저항 수준(SupResLines)

    "Colors" 탭에서 색상을 취향에 맞게 조정

    새로운 원 출현에 주목 — 이는 반전 가능성을 나타내는 신호

    추세선을 활용하여 가격 움직임 방향 판단

    피보나치 수준은 목표 가격과 되돌림 수준 결정에 도움

    가격이 중요한 수준에 도달하면 인디케이터가 음성 알림 발신

      권장 설정
       초보자용:

    Show_Trendlines와 Show_Bars만 활성화

    차트를 깔끔하게 유지하기 위해 다른 모든 옵션 비활성화

전문가용:

    Show_Trendlines — 추세 판단용

    Show_Fiblines — 되돌림 수준용

    Show_SupResLines3 — 지지/저항 수준용

    Sound_Alert — 음성 알림용

다중 시간대 분석용:

    H1 차트에 주기 5, 13, 34로 인디케이터 배치

    H4 차트에 주기 8, 21, 55로 동일 인디케이터 배치

    신호를 비교하여 확인
ZigZag_3LZZ는 단순한 인디케이터가 아니라 세 가지 지그재그 인디케이터, 피보나치 수준 자동 분석, 추세선 그리기, 지지/저항 수준 식별을 통합한 완전한 거래 시스템입니다. 초보 트레이더(기본 설정)부터 전문가(모든 기능)까지 적합합니다.
추천 제품
PREngulfing
Slobodan Manovski
PR EA - Engulfing Pattern Trading System Automated Engulfing Pattern Detection with MA Confirmation The PR EA is a Meta Trader 5 expert advisor that identifies and trades bullish/bearish engulfing candlestick patterns when confirmed by a moving average filter. Designed for swing trading on 30-minute charts with compatibility for M15 and H1 time frames. Key Features: Pattern Recognition - Detects valid bullish/bearish engulfing candle formations Trend Confirmation - 238-period SMA filter
Aurum Apex MT5
Hugo Feruglio
대부분의 골드 지표는 가격이 어디에 있었는지 를 보여줍니다. Aurum Apex는 대다수가 진입하기 전에 가격이 어디로 가는지를 보여줍니다. 이것은 주장이 아닙니다. 이것이 바로 이 시스템의 설계입니다. Aurum Apex란 무엇인가요? Aurum Apex는 MetaTrader 5를 위한 리페인트 없는 XAUUSD 스캘핑 지표 로, 오직 하나의 종목인 골드만을 중심으로 구축되었습니다. 가격 확장이 완전한 속도에 도달하기 전, 브레이크아웃 모멘텀의 시작점을 포착하도록 설계되었습니다. 리페인트하지 않습니다. 지연되지 않습니다. 추측하지 않습니다. 모든 신호는 차트에 완전히 표시된 진입선, 스탑로스, 테이크프로핏과 함께 도착합니다. 버튼 하나를 클릭하기 전에 이미 트레이드 전체가 정의되어 있습니다. 암산 불필요. 모호함 없음. 망설임 없음. 골드 스캘핑에서 수익과 손실의 차이는 종종 초 단위로, 그리고 누가 먼저 진입했는지로 결정된다는 것을 이해하는 트레이더를 위한 정밀 도구입니다. 핵심
Trendline Targets Dashboard MT5 Trendline Targets Dashboard MT5 는 메타트레이더 5(MT5) 전용 지표로, 신호(Signal) , 진입가(Entry) , 손절가(Stop Loss) , 익절가(Take Profit) 를 리스크 배수 R 에 따라 자동으로 계산하여 시각적인 매매 계획을 보여줍니다. 이 도구는 직접 주문을 실행하지 않습니다. 이는 매매 자동화 로봇이 아닌, 시각적 분석 및 관리를 위한 전문 도구입니다. 출시 기념 이벤트: 구매 시마다 내 MQL5 프로필에 있는 다른 지표 1개를 무료 로 드립니다. 예외: Market Structure Order Block Dashboard MT5 는 보너스 대상에서 제외됩니다. 보너스를 받으시려면 구매 후 MQL5 메시지를 통해 원하시는 제품명을 보내주시기 바랍니다. 주요 기능 네온 효과가 적용된 추세선 (상승/하락) 캔들 종가 기준 추세 반전 시 BUY/SELL 신호 발생 리스크(1R)
The indicator detects divergence signals - the divergences between the price peaks and the MACD oscillator values. The signals are displayed as arrows in the additional window and are maintained by the messages in a pop-up window, e-mails and push-notifications. The conditions which formed the signal are displayed by lines on the chart and in the indicator window. The indicator parameters MacdFast - fast MACD line period MacdSlow - slow MACD line period MacdSignal - MACD signal line period Macd
Contact me for instruction, any questions! Introduction V Bottoms and Tops  (or Fibonacci Retracement)  are popular   chart patterns   among traders due to their potential for identifying trend reversals. These patterns are characterized by sharp and sudden price movements, creating a V-shaped or inverted V-shaped formation on the   chart . By recognizing these patterns, traders can anticipate potential shifts in market direction and position themselves accordingly.  V pattern is a powerful bul
ATR Line
Evgeny Levchenko
The indicator - "ATR Line" determines the current trend and gives signals to buy (green arrow to the top) or sell (red arrow to the bottom). The indicator calculation is based on the deviation of the average price of the instrument from its average true range - ATR. The moving average of prices is used to reduce "market noise". If the main line of the indicator - "ATR Line" is lower the instrument price chart, then the market is in a "bullish" trend. If the main line of the indicator is higher t
Fractals
Mikhail Nazarenko
The Fractals indicator displays on the chart only fractals with the specified parameters in the indicator settings. This allows you to more accurately record a trend reversal, excluding false reversals. According to the classical definition of a fractal, it is a candlestick - an extremum on the chart, which was not crossed by the price of 2 candles before and 2 candles after the appearance of a fractal candle. This indicator provides the ability to adjust the number of candles before and after t
Introduction to X3 Chart Pattern Scanner X3 Cherart Pattern Scanner is the non-repainting and non-lagging indicator detecting X3 chart patterns including Harmonic pattern, Elliott Wave pattern, X3 patterns, and Japanese Candlestick patterns. Historical patterns match with signal patterns. Hence, you can readily develop the solid trading strategy in your chart. More importantly, this superb pattern scanner can detect the optimal pattern of its kind. In addition, you can switch on and off individu
Marubozu Pro MT5
N'da Lemissa Kouame
Commercial Description – Marubozu Pro (MT5) Description Marubozu Pro is a professional indicator for MetaTrader 5 that automatically detects Marubozu candles (bullish and bearish) directly on your chart. It helps traders identify strong market momentum where buyers or sellers take full control, by displaying clear visual arrows for buy and sell signals. This tool is designed to be simple, effective, and fast , perfect for manual trading or as a filter in automated strategies. Key Features
This is Multiple Timeframe of Malaysia SNR Levels and Storyline. The single timeframe version here Features: + Display level on multiple timeframe (higher or lower) + Turn on/off level on timeframe + Alert when price touch level 1. if high > resistance level but close of candle < resistance level , this level become unfresh - Name of level will have "(m)" meaning mitigated if close of candle > resistance level , this level become invalid and can be removed in chart (there is setting for keep/rem
Separating Lines Trading System for MetaTrader 5 Separating Lines Trading System is a price action indicator for MT5 designed to detect 2-bar continuation patterns where both candles share the same opening level and the second candle resumes the prevailing trend. A detailed user guide is available on the author’s MQL5 Blog . Additional updates are available through the author’s   MQL5 Channel . Depending on the current support policy, buyers may receive additional access to selected companion t
MT5용 Crypto_Forex 지표 "동적 과매수/과매수 구간을 포함하는 CCI" (재도색 불필요) - 상품 채널 지수(CCI)는 추세 방향으로의 모멘텀 트레이딩에 매우 유용합니다. - 동적인 과매수 구간에서 매도 진입을, 동적인 과매도 구간에서 매수 진입을 주요 추세 방향으로 유도하는 데 매우 유용합니다. - 이 지표는 가격 움직임 진입과도 결합하면 매우 유용합니다. - 동적인 과매수 구간 - 노란색 선 위. - 동적인 과매도 구간 - 파란색 선 아래. - CCI 오실레이터는 현재 가격과 과거 평균 가격의 차이를 측정합니다. - PC 및 모바일 알림 기능 제공. .................................................................................... 여기를 클릭하여 고품질 트레이딩 로봇과 지표를 확인하세요! MQL5 웹사이트에서만 제공되는 오리지널 상품입니다.
Boom 1k sniper spike detector
David Chokumanyara
1 (1)
Boom and Crash Sniper Spike Detector - Boom 1000 The Boom and Crash Sniper Spike Detector is the ultimate tool for spike trading on Boom 1000, offering clear and reliable signals to help you capture high-probability trades. This advanced indicator is designed to enhance your trading strategy by simplifying spike detection and maximizing your profits. Key Features: Multi-Timeframe Compatibility : The indicator can be used on M1, M5, M15, M30, and H1 timeframes, but it works best on the M1 timefra
Naked Forex Big Shadow indicator for MT5
Renaud Herve Francois Candel
5 (1)
Naked Forex Big Shadow Indicator Big Shadow Indicator is a pattern recognition indicator for Forex, Stocks, Indices, Futures, Commodities and Cryptos. When you have a Big Shadow on your chart then this is a strong signal meaning that you might be ahead of a reversal. You can take other elements (momentum, trend, volatility, price action, fundamentals) to build a complete strategy and confirm your entries. Beware that you might not make money just following the arrows generated by the pattern re
수입과 연구를 위한 도구. 거래 신호 및 전략의 핵심은 가격 예측 패턴의 형성을 위한 저자의 알고리즘을 기반으로 합니다. 모든 악기에 적용 가능! MA "Nine-Tailed Fox" 에 기반한 제어 시스템으로 보완되어 시장, 장비 및 작업 기간에 대해 가능한 한 정확하게 신호를 업데이트 및 조정합니다. 적격: 모든 시장의 모든 상품(예외 있음). 대상: 헤지 펀드, 펀드 및 자산 관리자, 투자 관리자, 투기꾼, 투자자 및 이해 관계자. .............................................................................................................................................
Elliott Wave MT5
Sathit Sukhirun
5 (1)
자동 엘리어트 파동 이론 (Automated Elliott Wave) 1. 자동 파동 카운팅 및 편향 감소 (객관성) 보통 엘리어트 파동 카운팅은 개인적인 "상상"이나 주관이 많이 개입됩니다. 이 보조지표는 다음과 같이 도와줍니다: 충격 파동(Impulse Wave 1-2-3-4-5) 탐지: 엄격한 규칙(예: 3파는 가장 짧을 수 없음, 4파는 1파와 겹칠 수 없음)을 사용하여 이론적으로 정확한 가격 구조를 보여줍니다. 조정 파동(Corrective Wave A-B-C) 탐지: 추세에 따라 재진입할 기회를 찾기 위해 가격 조정 구간을 포착합니다. 2. 다중 등급 분석 (Multi-Degree Analysis) 하나의 시간 프레임만 보는 것이 아니라 3가지 깊이 수준을 동시에 분석하여 시장을 입체적으로 보여줍니다: Minor (단기): 빠른 움직임 확인용. Intermediate (중기): 주요 추세 확인용. Primary (장기): 시장의 큰 흐름 확인용. 장점: 트레이딩 스
Support: Profit Smasher 24/7 AI Assistant Disclaimer Liquidity Mapper Pro is an analytical tool for educational and informational purposes only. It does not provide financial advice or guaranteed signals. All trading carries risk, including potential loss of capital. Past performance does not guarantee future results. You are solely responsible for your trading decisions.
ATrend
Zaha Feiz
4.83 (18)
ATREND: 작동 방식 및 사용 방법 ### 작동 방식 MT5 플랫폼을 위한 "ATREND" 지표는 기술 분석 방법론의 조합을 활용하여 트레이더에게 강력한 매수 및 매도 신호를 제공하도록 설계되었습니다. 이 지표는 주로 변동성 측정을 위해 평균 진폭 범위(ATR)를 활용하며, 잠재적인 시장 움직임을 식별하기 위한 트렌드 탐지 알고리즘과 함께 사용됩니다. 구매 후 메시지를 남기면 특별 보너스 선물을 받게 됩니다. ### 주요 특징: - 동적 트렌드 탐지: 이 지표는 시장 트렌드를 평가하고 신호를 조정하여 트레이더가 현재 시장 상황에 맞춰 전략을 조정할 수 있도록 돕습니다. - 변동성 측정: ATR을 사용하여 시장의 변동성을 측정하며, 이는 최적의 손절매(SL) 및 이익 실현(TP) 수준을 결정하는 데 중요합니다. - 신호 시각화: 이 지표는 차트에 매수 및 매도 신호를 시각적으로 표시하여 트레이더의 의사 결정을 향상시킵니다. ### 운영 단계 #### 입력 및 설정 - TimeFr
Overview Harmonic Patterns MT5 is a technical analysis indicator designed for the MetaTrader 5 platform. It identifies and displays harmonic price patterns, such as Butterfly, Cypher, Crab, Bat, Shark, and Gartley, in both bullish and bearish directions. The indicator calculates key price levels, including entry, stop loss, and three take-profit levels, to assist traders in analyzing market movements. Visual elements and customizable alerts enhance usability on the chart. Features Detects six ha
The RSI Divergence + FVG Signal indicator combines Relative Strength Index (RSI) Divergence with Fair Value Gap (FVG) detection to generate high-probability buy and sell signals based on both momentum shifts and institutional imbalance zones. Core Features: RSI Divergence Detection : Identifies both regular and hidden bullish/bearish divergences between price and RSI. Divergences indicate potential trend reversals or continuation. FVG Zone Recognition : Detects Fair Value Gaps (imbalances caused
RBreaker
Zhong Long Wu
RBreaker Gold Indicators는 금 선물을 위한 단기 데이 트레이딩 전략으로, 추세 추종과 데이 내 반전의 두 가지 거래 방식을 결합합니다. 추세 장에서 수익을 포착할 수 있을 뿐만 아니라, 시장이 반전될 때 적시에 이익을 확정하고 추세에 맞춰 반대 포지션을 잡을 수 있습니다. 이 전략은 미국 잡지 Futures Truth에서 15년 연속으로 가장 수익성 높은 트레이딩 전략 상위 10위 안에 선정되었습니다. 긴 라이프사이클을 자랑하며, 현재까지 국내외에서 널리 사용되고 연구되고 있습니다. 본 지표는 2026년 금 선물의 움직임을 반영하여 14일 ATR 지표를 기반으로 돌파 계수 A, 관찰 계수 B, 반전 계수 R을 보다 합리적인 값으로 정의했습니다. 매우 훌륭한 지표이며, 안정적인 연간 수익성을 달성했습니다. 강력히 추천합니다~ 위 지표는 변동성이 높은 상품에 적합하며, 매개변수는 금 선물, 주가 지수 선물 등에 적합합니다. 다른 상품이 필요한 경우 돌파 계수 A
이 지표는 시장 가격이 도달할 가능성이 있는 흥미로운 캔들(봉)을 표시합니다. 이를 관찰하면 시장이 다음에 어느 방향으로 움직일지 예측할 수 있습니다. 아이디어는 완전히 독창적이며, 스마트 머니(Smart Money) 개념과 밀접하게 관련되어 있습니다. 작동 방식: 활성 캔들은 색상으로 강조 표시됩니다. 이들은 시장 조성자(Market Maker)에게 자석처럼 작용하며, 여전히 유동성을 포함하고 있습니다. 현재 가격에 대한 위치에 따라 캔들은 빨강 또는 파랑 으로 표시되어 시각적으로 쉽게 확인할 수 있습니다. 시장 가격이 활성 캔들의 레벨을 통과하면, 해당 캔들은 점차 색상을 잃고 활성 상태를 잃습니다. 시장이 완전히 통과한 활성 캔들은 수동 상태가 되며 일반 캔들과 동일하게 표시됩니다. 수동 캔들은 더 이상 가격을 끌어당기지 않습니다. 적용 범위: 이 지표는 주요 및 부차 통화쌍, 금, 기타 자산 및 모든 시간대에서 사용할 수 있으며, 시장 분석과 가격 움직임 포착에 도움을 줍니다
PZ Pennants MT5
PZ TRADING SLU
Unlock market continuations with the accurate pennants indicator This indicator finds pennants , which are continuation patterns identified by converging trendlines surrounding a price consolidation period. Trades are signaled using a breakout period alongside the formation breakout.  [ Installation Guide | Update Guide | Troubleshooting | FAQ | All Products  |  Get Help ] Easy to use Customizable colors and sizes It implements breakout signals It implements alerts of all kinds Optimal Usage
Hush mt5
Iurii Plokhov
4.33 (3)
Hush mt5 is an advanced indicator that gives a signal about the overbought or oversold market in a certain period of time Hush mt5 the advantage of this indicator is that it does not disappear after the signal on the chart Suitable for any trade: forex, stocks, cryptocurrency, metals Hush mt5 can be used on any time period. The signal goes to the beginning of the next candle after the arrow Hush mt5 performed best on the period H1,H4,daily It can be used in addition to forex, in binary opt
Renko Plus
Eadvisors Software Inc.
With Renko Plus you can use the features in the Indicator functionality, just add it to the Metatrader5 chart.             The Renko chart is a type of chart, developed by the Japanese, that is constructed using price movement rather than standardized prices and time intervals like most charts. It is believed to be named after the Japanese word for bricks, "renga", as the graphic looks like a series of bricks.             A new brick is created when the price moves a specified pri
DoctorEdge V-LINE (Pump it & Dump it) Strategy Pro Confirms trend direction using smart momentum logic and key price behavior How It Works DoctorEdge V-LINE is a smart visual indicator designed to detect trend impulses and confirm their strength based on how price reacts around certain dynamic zones. Buy Trend: When price reaches level -20 , the line turns green , signaling a potential buy . If price breaks above level 0 and the line stays green, the uptrend is confirmed . If price doe
Fibo World MT5
Pavel Verveyko
The indicator builds a graphical analysis based on the Fibonacci theory. Fibo Fan is used for the analysis of the impulses and corrections of the movement. Reversal lines (2 lines at the base of the Fibonacci fan) are used to analyze the direction of movements. The indicator displays the of 4 the target line in each direction. The indicator takes into account market volatility. If the price is above the reversal lines, it makes sense to consider buying, if lower, then selling. You can open posi
Trade smarter, not harder: Empower your trading with Harmonacci Patterns This is arguably the most complete harmonic price formation auto-recognition indicator you can find for the MetaTrader Platform. It detects 19 different patterns, takes fibonacci projections as seriously as you do, displays the Potential Reversal Zone (PRZ) and finds suitable stop-loss and take-profit levels. [ Installation Guide | Update Guide | Troubleshooting | FAQ | All Products   |  Get Help ] It detects 19 differen
Your feedback is very valuable to us. By sharing your experience, you help us improve and provide you with better service. Thank you! PIPnova – Advanced Signal Indicator (v2.1) PIPnova is a professional MetaTrader 5 signal indicator powered by advanced algorithms, a multi-layer filtering system, and real-time signal performance tracking. Key Features Powerful signal algorithm based on RSI , Stochastic , and a custom LWTI oscillator Automatic TP / SL level placement for each signal Outc
MercariaPattern1-2-3 відстежує рух ціни, знаходить трьоххвильові структури 1-2-3 та підсвічує момент, коли сценарій підтверджується пробоєм ключового рівня. MercariaPattern1-2-3 tracks price movement, detects three-leg 1-2-3 structures and highlights the moment when the scenario is confirmed by a key level breakout. Індикатор збирає локальні свінги в компактну фігуру 0–1–2–3 , чекає підтвердженого пробою та будує стрілку входу з готовими рівнями SL/TP. The indicator combines local swings into a
이 제품의 구매자들이 또한 구매함
Azimuth Pro
Ottaviano De Cicco
5 (6)
Azimuth Pro V2: Synthetic Fractal Structure and Confirmed Entries for MT5 Overview Azimuth Pro is a multi-level swing structure indicator by Merkava Labs . Four nested swing layers, swing-anchored VWAP, ABC pattern detection, three-timeframe structural filtering, and closed-bar confirmed entries — one chart, one workflow from micro-swings to macro-cycles. This is not a blind signal product. It is a structure-first workflow for traders who care about location, context, and timing. V2 Launch Offe
OmniSync Projection
Antonio-alin Teculescu
5 (1)
Chronos Fractal Engine is an innovative price projection indicator for MetaTrader 5, designed to transform your technical analysis by intelligently identifying and projecting historical price patterns. Built upon an advanced correlation algorithm and the fractal principles of the market, this powerful tool visualizes potential future price movements, giving you a unique edge in your trading decisions. What is Chronos Fractal Engine? At its core, the Chronos Fractal Engine employs a sophisticat
CGE Trading Suite
Carl Gustav Johan Ekstrom
5 (2)
Institutional-Grade Analytics for MT5 C GE Trading Suite delivers the analytical edge typically reserved for professional trading desks. The platform integrates a full suite of analytical tools into one seamless workflow: dynamic grid mapping, liquidity behavior analysis, ECM, trend lines, MIDAS, trade cycles, and directional channel projections. Together, these provide a unified view of market structure and momentum. Directional clarity is further enhanced by the capital flow index, which meas
RelicusRoad Pro MT5
Relicus LLC
5 (24)
RelicusRoad Pro: 퀀트 시장 운영 체제 70% 할인 평생 이용권 (한정 시간) - 2,000명 이상의 트레이더와 함께하세요 왜 대부분의 트레이더는 "완벽한" 지표를 가지고도 실패할까요? 진공 상태에서 단일 개념 만으로 거래하기 때문입니다. 문맥 없는 신호는 도박입니다. 지속적인 승리를 위해서는 컨플루언스(중첩) 가 필요합니다. RelicusRoad Pro는 단순한 화살표 지표가 아닙니다. 완전한 퀀트 시장 생태계 입니다. 독점적인 변동성 모델링을 사용하여 가격이 이동하는 "공정 가치 로드"를 매핑하고, 단순 노이즈와 실제 구조적 돌파를 구분합니다. 추측은 그만두세요. 기관급 로드 로직으로 거래를 시작하세요. 핵심 엔진: "Road" 알고리즘 시스템의 중심에는 시장 상황에 실시간으로 적응하는 동적 변동성 채널인 Road Algo 가 있습니다. 세이프 라인(평형) 과 가격이 수학적으로 반전될 가능성이 높은 확장 레벨 을 투영합니다. Simple Road: 일반적인 시장을 위
ARICoins
Temirlan Kdyrkhan
ARICoin is a powerful trading companion designed to generate high-probability entry signals with dynamic TP/SL/DP levels based on volatility. Built-in performance tracking shows win/loss stats, PP1/PP2 hits, and success rates all updated live. Key Features: Buy/Sell signals with adaptive volatility bands Real-time TP/SL/DP levels based on ATR Built-in MA Filter with optional ATR/StdDev volatility Performance stats panel (Success, Profit/Loss, PP1/PP2) Alerts via popup, sound, push, or email Cust
ARIPoint
Temirlan Kdyrkhan
ARIPoint is a powerful trading companion designed to generate high-probability entry signals with dynamic TP/SL/DP levels based on volatility. Built-in performance tracking shows win/loss stats, PP1/PP2 hits, and success rates all updated live. Key Features: Buy/Sell signals with adaptive volatility bands Real-time TP/SL/DP levels based on ATR Built-in MA Filter with optional ATR/StdDev volatility Performance stats panel (Success, Profit/Loss, PP1/PP2) Alerts via popup, sound, push, or email Cu
우선적으로, 이 거래 도구는 전문적인 거래에 이상적인 비-다시 그리기 및 지연되지 않는 지표입니다.  온라인 강좌, 사용자 매뉴얼 및 데모. 스마트 가격 액션 컨셉트 인디케이터는 신규 및 경험 많은 트레이더 모두에게 매우 강력한 도구입니다. Inner Circle Trader Analysis 및 Smart Money Concepts Trading Strategies와 같은 고급 거래 아이디어를 결합하여 20가지 이상의 유용한 지표를 하나로 결합합니다. 이 인디케이터는 스마트 머니 컨셉트에 중점을 두어 대형 기관의 거래 방식을 제공하고 이동을 예측하는 데 도움을 줍니다.  특히 유동성 분석에 뛰어나 기관이 어떻게 거래하는지 이해하는 데 도움을 줍니다. 시장 트렌드를 예측하고 가격 변동을 신중하게 분석하는 데 탁월합니다. 귀하의 거래를 기관 전략에 맞추어 시장의 동향에 대해 더 정확한 예측을 할 수 있습니다. 이 인디케이터는 시장 구조를 분석하고 중요한 주문 블록을 식별하고 다양
TPA True Price Action indicator reveals the true price action of the market makers through 100% non-repainting signals strictly at the close of a candle! TPA shows entries and re-entries, every time the bulls are definitely stronger than the bears and vice versa. Not to confuse with red/green candles. The shift of power gets confirmed at the earliest stage and is ONE exit strategy of several. There are available now two free parts of the TPA User Guide for our customers. The first "The Basics"
AriX
Temirlan Kdyrkhan
1 (4)
AriX Indicator for MT5 A powerful trend-following and signal-evaluation tool AriX is a custom MT5 indicator that combines Moving Averages and ATR-based risk/reward logic to generate clear buy/sell signals. It visualizes dynamic SL/TP levels, evaluates past trade outcomes, and displays win/loss statistics in a clean on-chart panel. Key features include: Buy/Sell signals based on MA crossovers ATR-based SL/TP1/TP2/TP3 levels with visual lines and labels Signal outcome tracking with real-time stat
Meravith MT5
Ivan Stefanov
5 (1)
마켓 메이커를 위한 도구. Meravith는 다음과 같은 기능을 제공합니다: 모든 타임프레임을 분석하고 현재 유효한 추세를 표시합니다. 강세와 약세 거래량이 동일한 유동성 구간(거래량 균형 구간)을 강조 표시합니다. 서로 다른 타임프레임의 모든 유동성 레벨을 차트에 직접 표시합니다. 텍스트 기반 시장 분석을 생성하여 참고용으로 제공합니다. 현재 추세를 기반으로 목표가, 지지선 및 손절가를 계산합니다. 거래의 위험 대비 보상 비율(Risk/Reward)을 계산합니다. 계좌 잔고에 따라 포지션 크기를 산출하고 잠재 수익을 추정합니다. 시장에 중대한 변화가 발생할 경우 경고도 제공합니다. 지표의 주요 라인: 강세/약세 거래량 소진 라인 — 목표가로 사용됩니다. 시장 추세를 나타내는 라인. 시장이 강세인지 약세인지에 따라 색상이 변경되며 추세 지지선 역할을 합니다. 색상은 주로 시장 심리를 보여줍니다. 거래량 균형선(Eq). Eq(Volume Equilibrium) 라인은 시스템의 핵심입니
SignalTech MT5 is a trading system for EURUSD, USDCHF, USDJPY, AUDUSD, NZDUSD, EURJPY, AUDJPY, NZDJPY, CADJPY H2 and H3 Timeframe.  It can generate signals with Buy/Sell Arrows and Pop-Up/Sound Alerts. Each signal has clear Entry and Stop Loss levels, which should be automatically flagged on the chart, as well as potential Targets 1, 2, and 3. The Entry and TP levels are fixed after the trade is taken. The exit level is dynamic. If there are signs of a potential short-term trend reversal, the
ZIVA Signal Intelligence
Hassan Abdullah Hassan Al Balushi
ZIVA Signal Intelligence An Adaptive, Modular Market Intelligence System ZIVA Signal Intelligence is not positioned as a conventional trading indicator. It is a fully integrated, proprietary market intelligence system engineered to deliver structured, high-precision interpretation of price behavior within a controlled analytical environment. Developed through an independent architectural approach, ZIVA does not rely on, derive from, or replicate existing indicators. It represents a standalone
FX Analysis
Lee Teik Hong
FX Analysis is an all-in-one MT5 indicator dashboard that combines eight analytical tools in a single panel, helping traders identify high-probability setups without switching between charts or indicators. Designed for standard forex pairs on MetaTrader 5. Best results on M15 - H4 timeframes when all components are used together as part of the included workflow. Components Volatility Analyzer Displays historical average movement by hour and by day of the week. A real-time Pip Balance shows the
Ziva LSE System
Hassan Abdullah Hassan Al Balushi
ZIVA LSE System A Professional Liquidity & Structure Execution Framework Executive Overview ZIVA LSE System is a professionally engineered analytical framework designed to interpret market behavior through structural logic and liquidity dynamics. It is not positioned as a conventional indicator. Rather, it functions as a structured execution environment that organizes price action into a clear, disciplined decision-making model. The system is built to deliver consistency, clarity, and controlle
SunSignal ML — AI Gold Signals with Multi-Timeframe Confluence SunSignal ML is an advanced AI-powered signal indicator purpose-built for XAUUSD gold trading. It combines a proprietary adaptive trend algorithm with six machine learning models trained on confirmed price pivots to produce high-confidence entry signals with multi-timeframe validation. The indicator runs efficiently on M1, M5 and M15 timeframes and is designed for traders who want precision entries guided by data rather than guesswor
Ultimate SMC Indicator
Hicham Mahmoud Almoustafa
1 (1)
Ultimate SMC Indicator v2.20 — Smart Money Concepts All-in-One Stop switching between 5 different indicators. Ultimate SMC gives you everything Smart Money traders need — in one clean indicator with interactive controls. GUIDE What makes this different? Most SMC indicators show you Order Blocks or FVGs separately. You still have to figure out which zones actually matter. Ultimate SMC does the hard work: it scans for Order Blocks, Fair Value Gaps, Liquidity Sweeps, Supply & Demand zones, Fibo
이 위치가 매수에 적합한지 판단하는 데 도움을 줍니다. 이 위치가 매도에 적합한지 판단하는 데 도움을 줍니다. 네 개의 지표가 동시에 바닥에 도달하면 반등 기회를 중점적으로 살펴보시기 바랍니다. 네 개의 지표가 동시에 상단에 위치하면 하락 기회를 중점적으로 살펴보시기 바랍니다. 이 시스템은 중국의 첨단 알고리즘 기술과 고급 수학 모델링 체계를 기반으로 구축되었습니다. 저는 주로 XAUUSD M5 주기에서 이 지표를 사용하며, 이 주기가 가장 좋은 결과를 보여줍니다. 이 지표의 알고리즘과 수학 공식은 매우 복잡하기 때문에 테스트 시 진행 속도가 느릴 수 있습니다. 테스트할 때는 지표가 리페인트되는지, 지연되는지만 확인하시면 됩니다. 정식 버전은 실제 사용 시 더 안정적입니다. 이 지표 시스템은 절대 리페인트하지 않으며 미래 데이터를 사용하지 않습니다. 구매 전에 직접 테스트하고 확인하실 수 있습니다. 이 지표에는 완전히 개인화된 알림 시스템이 포함되어 있으며, 아래 링크를 통해 확인하
Ace Trend
Mikhail Sergeev
5 (3)
우리는 당신에게 트렌드 거래의 세계에서 게임의 규칙을 변경하는 혁신적인 지표를 제시한다. 이 표시기는 성능을 재고하고 거래 경험을 전례없는 높이로 높이도록 설계되었습니다. 우리의 표시기는 경쟁 업체와 차별화 된 고급 기능의 고유 한 조합을 자랑합니다. "실제 가격 요인"의 첨단 기술은 가장 어렵고 휘발성 시장 상황에서도 탁월한 안정성을 보장합니다. 불안정한 패턴,깨진 지표 및 의식적이고 통제 된 거래에 작별 인사를하십시오. 표시기는 단지 아름다운 그림이 아닙니다! 지표는 거래자의 편으로 확률을 이동시켜 이익을 얻어야 합니다. 표시 신호(완전 자동 모드)에 따라 거래 결과에 익숙해: https://www.mql5.com/ko/signals/2339244 표시기는 형성된 막대에 다시 그리지 않습니다. 막대가 형성된 경우 표시기 판독 값은 변경되지 않습니다. 이 표시기는 모든 시간대에 작동합니다. 표준은 시간대입니다. 귀하의 의견은 매우 중요합니다! 당신은 어떤 질문,제안이,또는 당신의
ARIScalping
Temirlan Kdyrkhan
ARIScalp is a powerful trading companion designed to generate high-probability entry signals with dynamic TP/SL/DP levels based on volatility. Built-in performance tracking shows win/loss stats, PP1/PP2 hits, and success rates all updated live. Key Features: Buy/Sell signals with adaptive volatility bands Real-time TP/SL/DP levels based on ATR Built-in MA Filter with optional ATR/StdDev volatility Performance stats panel (Success, Profit/Loss, PP1/PP2) Alerts via popup, sound, push, or email Cus
" Dynamic Scalper System MT5 " 지표는 추세 파동 내에서 스캘핑 방식으로 거래하도록 설계되었습니다. 주요 통화쌍 및 금에서 테스트되었으며, 다른 거래 상품과의 호환성이 가능합니다. 추가적인 가격 변동 지원을 통해 추세에 따라 단기 포지션 진입 신호를 제공합니다. 지표의 원리 큰 화살표는 추세 방향을 결정합니다. 작은 화살표 형태의 스캘핑 신호를 생성하는 알고리즘은 추세 파동 내에서 작동합니다. 빨간색 화살표는 상승 방향을, 파란색 화살표는 하락 방향을 나타냅니다. 민감한 가격 변동선은 추세 방향으로 그려지며, 작은 화살표의 신호와 함께 작용합니다. 신호는 다음과 같이 작동합니다. 적절한 시점에 선이 나타나면 진입 신호가 형성되고, 선이 있는 동안 미결제 포지션을 유지하며, 완료되면 거래를 종료합니다. 권장되는 작업 시간대는 M1~H4입니다. 화살표는 현재 캔들에 형성되며, 다음 캔들이 이미 시작되었더라도 이전 캔들의 화살표는 다시 그려지지 않습니다. 입
Transaction Speed MT5
Ivan Stefanov
5 (3)
이 지표는 시장에서 관심이 나타나는 영역 을 강조 표시한 후, 주문이 누적되는 영역 을 보여줍니다. 이는 **대규모 오더북(호가창)**처럼 작동합니다. 이것은 거대한 자금 을 위한 인디케이터입니다. 성능은 탁월하며, 시장에서 어떤 관심이 있든 반드시 포착할 수 있습니다 . (이것은 완전히 새로 작성되고 자동화된 버전 입니다 – 이제 수동 분석은 필요하지 않습니다.) **거래 속도(Transaction Speed)**는 새로운 개념의 인디케이터로, 시장에 대규모 주문이 언제, 어디에 쌓이는지를 보여주며 , 그 이점을 분석합니다. 매우 초기 단계에서 트렌드 전환 을 감지할 수 있습니다. FX 시장에서 흔히 사용하는 "거래량(volume)"은 오해입니다. 실제로는 시간당 가격 변화량 이므로, 올바른 용어는 거래 속도 입니다. 우리가 어떻게 사고하고, 행동하며, 분석하느냐 가 가장 중요합니다. 분석 패러다임의 전환 은 필수적입니다. 이 인디케이터는 외환 시장에서의 볼륨 개념을 논리적으로
Range Cycle Indicator. Gives signal on price range cycling smoothed by moving average. It is better to use it on H1+ timeframes and avoid side markets. Because if market is flat this indicator will give too many zero profit or even losing signals. Parameters: PopUpAlert - to allow it to alert when trend changes; EMailAlert - for email alerts; period - this is a smoothing criteria, use higher values on lower timeframes; TimeFrame(new) - higher timeframe (or the same) to use for calculation, defa
BookMap HeatMap
Roberto Spadim
1 (2)
This Indicator creates a heatmap based on depth of market of the current symbol or another symbol. Other symbol is useful when you trade futures market and a contract has 'mini' and 'full' split. For example, in Brazil (B3 - BMF&Bovespa), WDO and DOL are future Forex contract of BRL/USD (where 1 DOL = 5 WDO) and big banks work mostly with DOL (where liquidity is important). Please use with M1 timeframe , objects are too small to be displayed at higher timeframes (MT5 limit). The number of level
TrendMaestro5
Stefano Frisetti
note: this indicator is for METATRADER4, if you want the version for METATRADER5 this is the link:  https://www.mql5.com/it/market/product/108106 TRENDMAESTRO ver 2.5 TRENDMAESTRO recognizes a new TREND from the start, he never makes mistakes. The certainty of identifying a new TREND is priceless. DESCRIPTION TRENDMAESTRO identifies a new TREND in the bud, this indicator examines the volatility, volumes and momentum to identify the moment in which there is an explosion of one or more of these da
Triple Crox Strategy
issam rahhal sabour
*** ### **Triple Crox Strategy - Professional Trading System** **Overview** The Triple Crox Strategy is an advanced technical indicator for MetaTrader 5, designed for serious traders. It synthesizes multiple analysis methodologies—including moving averages, Average True Range (ATR), Relative Strength Index (RSI), and cloud configurations—to generate highly reliable and precise trading signals. **Core Configuration** **Setup Types** *   **Setup Open/Close:** Utilizes Heikin Ashi can
Weis Wave with Alert MT5
Trade The Volume Waves Single Member P.C.
4.94 (17)
Rental/Lifetime Package Options and Privileges  Rent Monthly Six Months   Yearly/Lifetime Weis Wave with Speed with Alert+Speed Index x x x Manual  x x x Quick Set up Video x x x Blog x x x Lifetime Updates x x x Setup and Training Material x x Discord Access Channel "The SI traders"          x Rectangle Break Alert Tool      x How to trade with it:    http://www.tradethevolumewaves.com   ** If you purchase please contact me to setup your  : Training Room and  complete manual access.  Wei
Owl Smart Levels MT5
Sergey Ermolov
4.03 (32)
추세를 따라 거래할 때 가장 어려운 점은 레벨을 찾는 것이 아니라, 어디에서 진입이 실제로 유효한지를 이해하는 것입니다. 가격은 종종 레벨에 반응하지만 움직임이 이어지지 않는 경우가 많으며, 이는 잘못된 진입이나 기회 상실로 이어집니다. Owl Smart Levels는 단순히 레벨만 표시하는 것이 아니라 , 시장 구조와 되돌림을 기반으로 형성된 구간을 보여줍니다. 이를 통해 진입 포인트를 다르게 평가할 수 있으며 일부 잘못된 신호를 피할 수 있습니다. Owl Smart Levels 시스템 구성 Owl Smart Levels 는 단순한 레벨 표시가 아니라, 각 요소가 서로 보완하는 완전한 트레이딩 모델 입니다. 구성 요소: Owl Smart Levels (지표) 추세 방향, 되돌림 구간, 그리고 사전에 정의된 진입, StopLoss, TakeProfit 레벨을 표시 시스템 가이드 실제 거래에서 신호를 어떻게 활용할지 설명: 어떤 상황을 고려하고 어떤 상황을 건너뛸지, 그리고 거래
Orderflow Scalp Pro
TitanScalper
5 (2)
Orderflow Scalp Pro v2.4   delivers institutional-grade trading intelligence through advanced volume analysis, dynamic VWAP calculations, real-time aggressive score monitoring, and precision arrow signals. This complete trading system transforms complex market data into clear, actionable signals for consistent profitability on 3-4 minute timeframes. Full Documentation: [Download PDF] Four Powerful Components in One System Volume Profile HeatMap with POC/VAH/VAL Transform your charts into inst
Red and Green Light – Intelligent Trading Signal Indicator Product Overview Red and Green Light is a professional trading signal indicator based on the multi-stage T3 smoothing algorithm. It integrates a visual traffic light system, intelligent signal recognition, risk alerts, and multiple notification features. Whether you're a manual trader or an Expert Advisor (EA) developer, this indicator helps you capture market opportunities with greater precision and effectively avoid the risks of
TickChart Indicator plots tick line on the main window of MetaTrader. ( Free version of this is "TickChart Indicator Lite" ) The tick-line shows the most detailed, fastest and real-time activities of the market, which are usually hidden in bars or candles longer than 1 minute. Usually, several new tick-line segments appear while a bar of M1 time frame is completed. After the release of an important economic indicator, the number of ticks per bar may exceeds 100. This indicator overlays the tick
제작자의 제품 더 보기
이 표시기에는 13 과 55 의 기간이 다른 두 개의 지그재그가 형성됩니다.  지표의 두 세그먼트가 형성되고 연결되면 특정 기간에 가격의 최소 또는 최대값을 형성하면 지표는 반대 방향으로 가능한 가격 반전을 신호합니다. 가장 작은 기간(기간 13)을 가진 지그재그를 형성 할 때,가장 큰 기간(기간 55)이 동일한 최소 또는 최대로 유지된다면,이는 이전의 최대 또는 최소로 교정 이동이 가능하다는 것을 의미하며,이는 로트를 개방 위치에 추가 할 수 있음을 의미합니다. 중요! 당신은 더 짧은 기간을 가진 지그재그 지시자의 새로운 팔이 형성된 후에 위치를 추가 할 필요가있다. 그렇지 않으면 부정적인 이익 값이 가능합니다. 또한,지그재그 주니어 팔의 형성 후,그것은 가능합니다 90%신뢰도를 가진 손실 없이 이 계기에 위치를 재정렬하기 위하여. 이 방법으로 가격을 짜낼 수 있습니다. 이 지그재그 표시기는 상당한 단점을 가지고 있음을 주목해야한다, 이는 강력한 가격 움직임으로 가격을 다시 작성하
지그자그 표시기는 34 의 주기로 표준으로 추가 화살표 신호가 있습니다. 추가 신호는 지그재그 표시기와 별도로 계산됩니다.이 표시기에 대한 작업은 다음과 같습니다. 지그재그 표시기의 세그먼트를 형성하고 추가 화살표 신호가 나타날 때 화살표 방향으로 위치를 열어야합니다. 이전 팔의 상단에 있는 추가 신호(화살)의 반대 방향으로 지그자그 표시기의 다른 팔을 형성할 때,대기 중인 순서의 위치를 설정하는 것이 가능해집니다.3. 반대쪽 지그재그 어깨에서 추가 신호(화살표)로 형성이 완료되면 이전에 열린 위치에 추가하거나 정지 손실을 이 수준으로 이동할 수 있습니다;4. 보수적 인 거래 모드에서 거래하는 경우 가격 움직임의 첫 번째 철수 전에 추가 포지션을 열 수 없습니다. 정확하게 시장에 진입하려면 지그재그 표시기 세그먼트의 형성과 수석 시간대에 추가 신호의 출현을 기다릴 수 있으며 열린 위치에서 40 점보다 더 가까운 정지를 배치 할 수 있습니다. 6. 당신이 무역에 추가 위치를 추가 한
Balance line
Igor Nagorniuk
지정된 표시기는 현재 기호에 이익(손실)을 표시하는 표시기의 버전 중 하나입니다. 당신은 쉽게 총 이익 또는 손실을 결정,마우스로 레벨을 이동할 수 있습니다. 이 표시기의 특징은 다음과 같습니다. 이익 또는 손실이 무역이 일어나는 장소에서,라인 근처에 표시되지 않습니다,하지만 손실 또는 이익을 계산하는 거래를 방해하지 않는다는 것을 의미 화면의 왼쪽 상단 모서리에. 2. 표시등이 자동으로 설정 한 위치를 결정합니다. 3. 당신이 잠금을 거래하는 경우,표시기는 평균 이익 수준을 뽑아 것입니다. 4. 위의 지표는 오픈 포지션뿐만 아니라 한계 주문,즉 이론적 인 이익 또는 손실의 양을 계산할 수있는 능력을 가지고 있습니다.이 지표는 수수료,스프레드 및 기타 브로커 공제(소득세)와 같은 매개 변수를 고려하지 않는다는 것을 즉시 쓸 것입니다. 표시기는 표준 모드에서 시작됩니다. 위의 표시기를 설치 한 후,당신은 지정된 시간 프레임에 파란색 수평 라인을 볼 수 있습니다. 드래그 할 때,당신은
## WPRV2 지표의 상세 설명 WPRV2는 전통적인 기술 분석 도구인 윌리엄스 퍼센트레인지(%R)를 개량한 버전입니다. 주식 시장이나 외환시장, 암호화폐 거래소 등 금융 시장에서 사용되며, 시장 동향을 분석하고 최적의 매매 타이밍을 결정하는데 도움이 됩니다. ### 지표의 목적 WPRV2 지표의 주요 목적은 현재 가격이 최근 고점과 저점에 비해 얼마나 가까운지 측정하는 것입니다. 이를 통해 트레이더들은 다음 사항을 파악할 수 있습니다. - 현재 가격이 역사적으로 높은 수준에 가까운가? - 혹은 역사적으로 낮은 수준에 접어드는 중인가? 이 정보를 통해 시장 변동성이나 현재 추세의 연속성을 신속하게 파악하여 올바른 판단을 내릴 수 있습니다. ### WPRV2 지표의 특징 #### 1. 그래픽 표현 방법 WPRV2 지표는 메인 자산 차트와 별도로 나타나며, 다음 두 줄로 구성됩니다. - 메인 라인(`WPR`) : 지정된 기간 동안 %R 값의 변화를 보여줍니다. - 추가적인
GannZigZagMACD
Igor Nagorniuk
GannZigZagMACD 지표 상세 설명 목적과 개념 GannZigZagMACD 는 MetaTrader 5 플랫폼용 하이브리드 기술 지표로, 클래식 MACD 지표와 Gann의 지그재그 요소를 결합한 것입니다. 이 지표는 극단 패턴을 기반으로 트렌드 반전을 식별하고 거래 신호를 생성하도록 설계되었습니다. 이 지표의 주요 아이디어는 Gann의 방법을 사용하여 중요한 고점과 저점을 감지한 다음 MACD 히스토그램에 신호를 투영하는 것입니다. 작동 원리 주요 구성 요소: 클래식 MACD - 빠른(12기간)과 느린(26기간) 지수 이동 평균 간의 차이를 계산 신호선 - MACD 히스토그램의 평활 이동 평균(기본값: 9기간 EMA) Gann 알고리즘 - 지정된 바 범위(GSv_range)를 기반으로 중요한 극값 결정 신호 화살표 - 잠재적 진입점을 나타내는 MACD 히스토그램의 반전 화살표 신호 생성 메커니즘: 이 지표는 반전 논리 를 사용합니다: 녹색 상향 화살표(233) → 매도 신호
ATRZigMACD
Igor Nagorniuk
ATRZigMACD - 지표 간략 설명 1. 목적과 개념 ATRZigMACD는 클래식 MACD와 위조 신호를 필터링하기 위한 ATR 지그재그 알고리즘을 결합한 고급 오실레이터입니다. 이 지표는 변동성을 고려한 트렌드 전환점을 식별하고, 트렌드 강도를 확인하며, 명확한 거래 신호를 생성합니다. 2. 작동 원리 구성 요소: MACD 히스토그램 (파랑색) – 빠른 EMA와 느린 EMA의 차이 신호선 (노란색) – 히스토그램의 평활화 이동평균 SELL 화살표 (초록색, 위쪽) – 매도 신호 BUY 화살표 (빨간색, 아래쪽) – 매수 신호 ATR 레벨 (파랑/주황색) – 동적 변동성 임계값 신호 논리: BUY가 형성되는 조건: 가격이 하위 ATR 임계값에 도달 MinPeriod 기간(캔들) 경과 빨간색 아래쪽 화살표 표시 SELL가 형성되는 조건: 가격이 상위 ATR 임계값에 도달 MinPeriod 기간(캔들) 경과 초록색 위쪽 화살표 표시 3. 설정 매개변수 ATRZIGZAG 매개변
X Sensors Pro
Igor Nagorniuk
X Sensors Pro는 선택된 기간 동안 가격 수준별 거래량 분포를 시각화하는 전문 볼륨 프로파일 지표입니다. 이 지표는 자동으로 로컬 극값(HH와 LL)을 식별하고, 최대 거래량 수준인 POC(Point of Control)를 계산하며, 식별된 범위를 기반으로 지지선과 저항선을 구축합니다. 주요 기능: 컬러 히스토그램 형태의 볼륨 프로파일 시각화 POC(Point of Control) 자동 감지 HH(더 높은 고가) 및 LL(더 낮은 저가) 수준 구축 피벗 수준 및 다중 지지/저항 수준 계산 강세(녹색) 및 약세(빨간색) 거래량의 색상 표시 모든 시간대에 적응하는 조정 기능 이 지표의 용도는 무엇인가요? 이 지표는 트레이더의 다음과 같은 과제를 해결합니다: 1. 축적 및 분배 영역 식별 거래량은 항상 큰 세력이 시장에 진입하거나 이탈하는 곳에 집중됩니다. POC는 최대 거래량이 발생한 가격을 보여줍니다. 이것은 심리적으로 중요한 수준입니다. 2. 공정 가치 탐색 PO
Dual ZigZag SSRC
Igor Nagorniuk
일반적인 목적 Dual ZigZag SSRC는 서로 다른 주기의 두 개의 ZigZag와 SSRC 필터의 조합을 기반으로 매수 및 매도 신호를 생성하도록 설계된 기술적 분석 트레이딩 인디케이터입니다. 이 인디케이터는 자동으로 국부적 극값을 식별하고 필터로 확인한 후 진입 및 손절매 수준과 함께 신호를 제공합니다. 기능 반전 지점 식별 - 이중 ZigZag는 중요한 저점과 고점을 강조 표시하고 시장 노이즈를 필터링합니다. 허위 신호 필터링 - SSRC 오실레이터는 방향성을 확인하여 잘못된 신호 발생을 줄입니다. 진입 수준 정의 - 녹색 선은 포지션을 개시하기 위한 최적의 영역을 보여줍니다. 리스크 관리 - 빨간색 선은 손절매 수준을 보여줍니다. 신호 시각화 - 화살표가 진입 시점을 명확하게 표시합니다. 시장 및 상품 외환 - 적용성이 높으며 변동성이 좋은 통화쌍에 최적입니다. 선물 - 적용성이 중간 정도이며 지수 선물 및 원자재 선물에 적합합니다. 주식 - 적용성이 중간 정
필터:
리뷰 없음
리뷰 답변